Preliminary Data Analysis
Preliminary Data Analysis
Preliminary Data Analysis

Create successful ePaper yourself
Turn your PDF publications into a flip-book with our unique Google optimized e-Paper software.
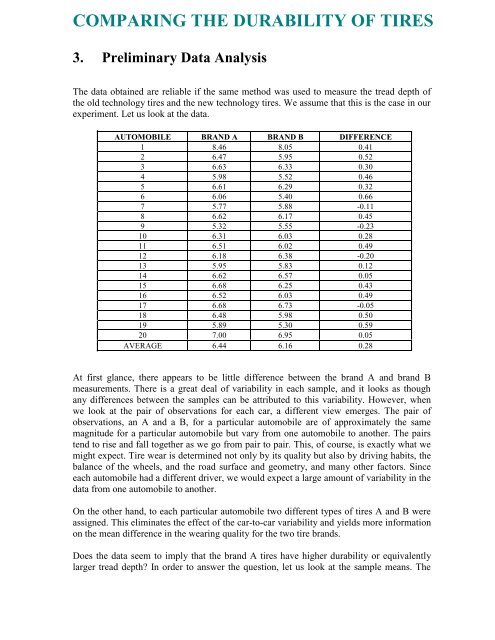
COMPARING THE DURABILITY OF TIRES<br />
3. <strong>Preliminary</strong> <strong>Data</strong> <strong>Analysis</strong><br />
The data obtained are reliable if the same method was used to measure the tread depth of<br />
the old technology tires and the new technology tires. We assume that this is the case in our<br />
experiment. Let us look at the data.<br />
AUTOMOBILE BRAND A BRAND B DIFFERENCE<br />
1 8.46 8.05 0.41<br />
2 6.47 5.95 0.52<br />
3 6.63 6.33 0.30<br />
4 5.98 5.52 0.46<br />
5 6.61 6.29 0.32<br />
6 6.06 5.40 0.66<br />
7 5.77 5.88 -0.11<br />
8 6.62 6.17 0.45<br />
9 5.32 5.55 -0.23<br />
10 6.31 6.03 0.28<br />
11 6.51 6.02 0.49<br />
12 6.18 6.38 -0.20<br />
13 5.95 5.83 0.12<br />
14 6.62 6.57 0.05<br />
15 6.68 6.25 0.43<br />
16 6.52 6.03 0.49<br />
17 6.68 6.73 -0.05<br />
18 6.48 5.98 0.50<br />
19 5.89 5.30 0.59<br />
20 7.00 6.95 0.05<br />
AVERAGE 6.44 6.16 0.28<br />
At first glance, there appears to be little difference between the brand A and brand B<br />
measurements. There is a great deal of variability in each sample, and it looks as though<br />
any differences between the samples can be attributed to this variability. However, when<br />
we look at the pair of observations for each car, a different view emerges. The pair of<br />
observations, an A and a B, for a particular automobile are of approximately the same<br />
magnitude for a particular automobile but vary from one automobile to another. The pairs<br />
tend to rise and fall together as we go from pair to pair. This, of course, is exactly what we<br />
might expect. Tire wear is determined not only by its quality but also by driving habits, the<br />
balance of the wheels, and the road surface and geometry, and many other factors. Since<br />
each automobile had a different driver, we would expect a large amount of variability in the<br />
data from one automobile to another.<br />
On the other hand, to each particular automobile two different types of tires A and B were<br />
assigned. This eliminates the effect of the car-to-car variability and yields more information<br />
on the mean difference in the wearing quality for the two tire brands.<br />
Does the data seem to imply that the brand A tires have higher durability or equivalently<br />
larger tread depth? In order to answer the question, let us look at the sample means. The
difference between the two sample means is A B 6.44<br />
6.16 0.28,<br />
a rather small<br />
quantity, considering the variability of the data and the number of observations involved.<br />
Thus, at first glance it would seem that there is a little evidence to indicate a difference<br />
between the quality of the tires.<br />
On the other hand, a more careful analysis of the data reveals an inconsistency with this<br />
conclusion. We note that the tread depth for the brand A tires is larger than the<br />
corresponding value for brand B for 16 of 20 automobiles involved. This, in itself, seems to<br />
provide strong evidence to indicate that the tread depth of brand A tends to exceed the tread<br />
depth of brand B.