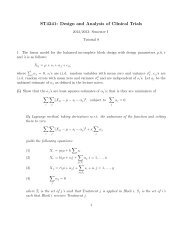
Analyzing Longitudinal Data Using Regression Splines
Analyzing Longitudinal Data Using Regression Splines
Analyzing Longitudinal Data Using Regression Splines

You also want an ePaper? Increase the reach of your titles
YUMPU automatically turns print PDFs into web optimized ePapers that Google loves.
<strong>Analyzing</strong> <strong>Longitudinal</strong> <strong>Data</strong> <strong>Using</strong><br />
<strong>Regression</strong> <strong>Splines</strong><br />
Zhang Jin-Ting<br />
Dept of Stat & Appl Prob<br />
National University of Sinagpore<br />
August 18, 2006<br />
DSAP, NUS – p.1/16
OUTLINE<br />
Motivating <strong>Longitudinal</strong> <strong>Data</strong><br />
Parametric Mixed Effects Modeling<br />
Nonparametric Mixed-Effects Modeling<br />
<strong>Regression</strong> <strong>Splines</strong><br />
<strong>Regression</strong> Spline Mixed-effects Modeling<br />
Application<br />
DSAP, NUS – p.2/16
Motivating <strong>Longitudinal</strong> <strong>Data</strong><br />
ACTG 388 <strong>Data</strong>:<br />
Collected in an AIDS Clinical Trial Group study<br />
166 HIV-1 infected patients treated with highly active antiretroviral therapy<br />
for 120 weeks<br />
CD4 cell counts for each patient monitored at baseline and at weeks 4, 8,<br />
and every 8 weeks thereafter (up to 120 weeks)<br />
Missing data presented due to missing clinical visits or other reasons<br />
Remark: CD4 cell count, an important marker for assessing immunologic<br />
response of an antiviral regimen.<br />
DSAP, NUS – p.3/16
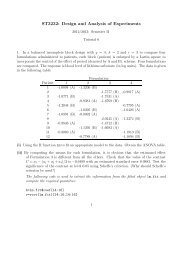
Motivating <strong>Longitudinal</strong> <strong>Data</strong><br />
1400<br />
Raw Curves<br />
1200<br />
1000<br />
<strong>Data</strong> quite messy<br />
No obvious trend<br />
CD4 count<br />
800<br />
600<br />
400<br />
200<br />
0<br />
0 20 40 60 80 100 120<br />
Week<br />
DSAP, NUS – p.4/16
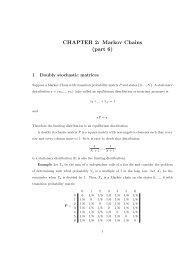
Motivating <strong>Longitudinal</strong> <strong>Data</strong><br />
Indiviudal Curves<br />
600<br />
Subj 8<br />
600<br />
Subj 11<br />
400<br />
400<br />
200<br />
200<br />
0<br />
0 20 40 60 80 100 120<br />
Subj 21<br />
600<br />
0<br />
0 20 40 60 80 100 120<br />
Subj 36<br />
600<br />
400<br />
400<br />
200<br />
200<br />
0<br />
0 20 40 60 80 100 120<br />
Subj 39<br />
600<br />
0<br />
0 20 40 60 80 100 120<br />
Subj 59<br />
600<br />
400<br />
200<br />
Measurement errors presented<br />
Subject effects presented<br />
Missing data presented<br />
0<br />
0 20 40 60 80 100 120<br />
CD4 count<br />
400<br />
200<br />
0<br />
0 20 40 60 80 100 120<br />
Week<br />
DSAP, NUS – p.5/16
¡<br />
¡<br />
Parametric Mixed Effects Modeling<br />
A Parametric Mixed-Effects Model:<br />
Response<br />
Parametric Fixed-Effect<br />
Parametric Random-Effect<br />
Measurement Error<br />
Parametric fixed-effects: model overall means<br />
Parametric random-effects: model individual (subject) effects<br />
Measurement errors: model individual errors<br />
Individual responses=overall means+individual effects<br />
Advantages:<br />
Simple and well studied<br />
Fitting methods and software available<br />
DSAP, NUS – p.6/16
Parametric Mixed Effects Modeling<br />
Difficulties:<br />
Appropriate parametric models, e.g., polynomials, needed for fixed-effects<br />
Appropriate parametric models, e.g., polynomials, needed for<br />
random-effects<br />
But in practice, parametric models may NOT available or appropriate<br />
DSAP, NUS – p.7/16
¡<br />
¡<br />
Nonpar. Mixed Effects Modeling<br />
A Nonparametric Mixed-Effects Model:<br />
Response curve<br />
Nonparametric Fixed-Effect curve<br />
Nonparametric Random-Effectcurve<br />
Measurement Error<br />
Nonparametric fixed-effect curve: model overall mean function<br />
Nonparametric random-effect curve: model individual (subject) effect curve<br />
Measurement errors: model individual errors<br />
Individual curve=fixed-effect curve+ random-effect curve<br />
Advantages:<br />
No parametric models assumed for both Fixed and Random effects<br />
Robust against model misspecification<br />
DSAP, NUS – p.8/16
Nonpar. Mixed Effects Modeling<br />
Difficulties:<br />
Methods and software rather new, still being developed<br />
Need to properly choose one smoothing method<br />
Need to properly choose the smoothing parameters<br />
Remarks:<br />
Popular smoothing methods including Local polynomials, <strong>Regression</strong><br />
splines, Smoothing splines, and Penalized splines well developed for<br />
independent data but rather new for longitudinal data analysis<br />
Each smoothing method accompanied with one, two or more smoothing<br />
parameters<br />
Properly choosing smoothing parameters often challenging<br />
DSAP, NUS – p.9/16
¦<br />
¥ ¢<br />
£<br />
£<br />
¤ ¢<br />
¥ ¥<br />
¡¢<br />
£ ¢<br />
¥ ¢<br />
<br />
¦ <br />
<br />
£<br />
£<br />
£<br />
¦ <br />
£<br />
<strong>Regression</strong> <strong>Splines</strong><br />
A regression spline is a linear combination of a truncated power basis<br />
A truncated power basis is a polynomial basis, plus some truncated power<br />
basis functions<br />
A<br />
-degree polynomial basis consists of<br />
Truncated power basis functions with<br />
§knots<br />
¨©¢<br />
¥ ¥<br />
¨can be<br />
expressed as<br />
£ ¨©<br />
¦ ¢<br />
¥ ¥<br />
£ ¨<br />
¥ ¢<br />
The truncated function so called since it equals<br />
truncated as negative<br />
when<br />
if<br />
positive and<br />
DSAP, NUS – p.10/16
¡<br />
¢<br />
¦<br />
¤¢ ¢ ¥<br />
¢<br />
£¢ ¢<br />
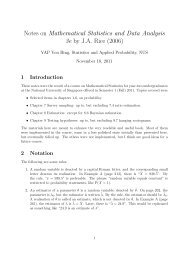
<strong>Regression</strong> <strong>Splines</strong><br />
regression spline<br />
linear combination of polynomials<br />
linear combination of truncated functions<br />
1<br />
(a) A <strong>Regression</strong> Spline Basis<br />
4<br />
(b) Three <strong>Regression</strong> <strong>Splines</strong><br />
0.8<br />
2<br />
y<br />
0.6<br />
0.4<br />
0.2<br />
0<br />
0 0.2 0.4 0.6 0.8 1<br />
x<br />
y<br />
0<br />
−2<br />
−4<br />
0 0.2 0.4 0.6 0.8 1<br />
x<br />
Left: A quadratic truncated power basis with knots<br />
, and<br />
.<br />
Right: Three quadratic regression splines with randomly selected<br />
coefficients<br />
DSAP, NUS – p.11/16
RS Mixed Effect Modeling<br />
A truncated power basis used for modeling Fixed-Effect curve<br />
Another truncated power basis used for modeling Random-Effect curve<br />
Numbers of basis functions of the truncated power bases are smoothing<br />
parameters<br />
Smoothing parameters selected using AIC, BIC and other model selection<br />
rules<br />
When smoothing parameters fixed, the model becomes a Standard Linear<br />
Mixed Effects model<br />
A standard LME model can be solved using existing methods and software<br />
DSAP, NUS – p.12/16
Application<br />
Methodologies applied to the ACTG 388 data:<br />
A quadratic truncated power basis used for Fixed-effect curve, another for<br />
Random-effect curve<br />
For fixed smoothing parameters, SPLUS function lme can be used to fit the<br />
model<br />
Smoothing parameters selected using the BIC rule<br />
4 basis functions selected for Fixed-effect curve, and another 4 for<br />
Random-effect curve<br />
DSAP, NUS – p.13/16
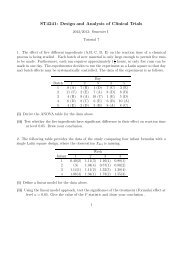
Application<br />
Overall Fits<br />
CD4 count<br />
1000<br />
800<br />
600<br />
400<br />
200<br />
(a) Fitted individual functions<br />
0<br />
0 50 100<br />
Week<br />
CD4 count<br />
(b) Fitted mean function with ± 2 SD<br />
450<br />
400<br />
350<br />
300<br />
250<br />
200<br />
150<br />
0 50 100<br />
Week<br />
x 10 4<br />
(c) Fitted covariance function<br />
(d) Fitted correlation function<br />
5<br />
1<br />
Covariance<br />
4<br />
200 2 3<br />
100<br />
Week<br />
0<br />
0<br />
100<br />
50<br />
Week<br />
150<br />
Correlation<br />
0.9<br />
0.8<br />
0.7<br />
200<br />
100<br />
Week<br />
0<br />
0<br />
100<br />
50<br />
Week<br />
150<br />
DSAP, NUS – p.14/16
Application<br />
Individual Fits<br />
Subj 8<br />
600<br />
500<br />
400<br />
300<br />
200<br />
0 50 100<br />
Subj 21<br />
400<br />
300<br />
200<br />
0 50 100<br />
Subj 39<br />
400<br />
300<br />
200<br />
100<br />
0 50 100<br />
CD4 count<br />
600<br />
500<br />
400<br />
300<br />
200<br />
400<br />
300<br />
200<br />
100<br />
400<br />
300<br />
200<br />
100<br />
Subj 11<br />
0 50 100<br />
Subj 36<br />
0 50 100<br />
Subj 59<br />
raw data<br />
population<br />
individual<br />
0<br />
0 50 100<br />
Week<br />
DSAP, NUS – p.15/16
End of the Talk<br />
Thank You<br />
DSAP, NUS – p.16/16