- Page 1 and 2:
London Borough of Hillingdon Cabine
- Page 3 and 4:
This page contains information abou
- Page 5 and 6:
Introduction This document contains
- Page 7 and 8:
1. DEFINITIONS Certain words in thi
- Page 9 and 10:
whom have reached the age of eighte
- Page 11 and 12:
secure tenants. We call these types
- Page 13 and 14:
Subletting & Lodgers (not applicabl
- Page 15 and 16:
2. ABOUT YOUR TENANCY AGREEMENT Ple
- Page 17 and 18:
If you have a probationary or a dem
- Page 19 and 20:
• At the Cashier’s Office • O
- Page 21 and 22:
• delivering it through the lette
- Page 23 and 24:
alternative accommodation is availa
- Page 25 and 26:
seek at the same time as an order f
- Page 27 and 28:
period of time after notification o
- Page 29 and 30:
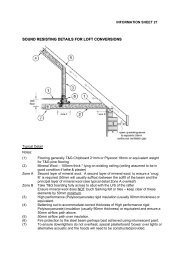
Defects, faults and disrepair 5.11
- Page 31 and 32:
Your own equipment 5.18 It is your
- Page 33 and 34:
enjoyment Anti Social Behaviour by
- Page 35 and 36:
Harassment 6.8 You may not do, or p
- Page 37 and 38:
7. LIVING IN YOUR HOME Please remem
- Page 39 and 40:
without prior notice in order to oc
- Page 41 and 42:
• Erection of garages, sheds, etc
- Page 43 and 44:
within the confines of the property
- Page 45 and 46:
9. COMMUNICATION AND CONSULTATION W
- Page 47 and 48:
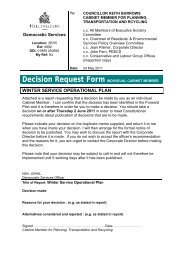
Cabinet report 15 th March 2007 app
- Page 49 and 50:
up possession of the property • P
- Page 51 and 52:
someone else. This process is calle
- Page 53 and 54:
12. BUYING YOUR HOME Please remembe
- Page 55 and 56:
MAXIMUM NUMBER OF PEOPLE ALLOWED TO
- Page 57 and 58:
PLEASE RETURN TO: LONDON BOROUGH OF
- Page 59 and 60:
23 Keeping your application up to d
- Page 61 and 62:
1. INTRODUCTION Hillingdon receives
- Page 63 and 64:
3. COMPLETING YOUR HOUSING REGISTER
- Page 65 and 66:
6. MEMBERS CONSIDERED PART OF THE H
- Page 67 and 68:
10. PRIORITY DATES The principle of
- Page 69 and 70:
14. TRANSFERS All tenants of perman
- Page 71 and 72:
♦ Other relevant information e.g.
- Page 73 and 74:
The Locata HOME free magazine is al
- Page 75 and 76:
♦ Where a recommendation has been
- Page 77 and 78:
Tel: 01895 250366 Text Phone: 01895
- Page 79 and 80:
TENANTS HOME-SEEKERS DEFINING FEATU
- Page 81 and 82:
TENANTS HOME-SEEKERS DEFINING FEATU
- Page 83 and 84:
TENANTS HOME-SEEKERS DEFINING FEATU
- Page 85 and 86:
APPENDIX 2 This is a general guide
- Page 87 and 88:
APPENDIX 3 LIST OF COUNCIL OWNED PE
- Page 89 and 90:
HOUSING DEMAND AS OF DECEMBER 2006
- Page 91 and 92:
ACCESS TO INFORMATION LONDON BOROUG
- Page 93 and 94:
LOCAL ADVICE AGENCIES Ruislip CAB O
- Page 95 and 96:
Oaklands Gate Library Green Lane No
- Page 97 and 98:
Cabinet Report - 15 March 2007 Moni
- Page 99 and 100:
Last Amended: 15 January 2007 Counc
- Page 101 and 102:
Last Amended: 15 January 2007 Counc
- Page 103 and 104:
Last Amended: 15 January 2007 Counc
- Page 105 and 106:
Last Amended: 15 January 2007 Counc
- Page 107 and 108:
Last Amended: 15 January 2007 Counc
- Page 109 and 110:
Last Amended: 15 January 2007 Counc
- Page 111 and 112:
Last Amended: 15 January 2007 Counc
- Page 113 and 114:
Last Amended: 15 January 2007 Counc
- Page 115 and 116:
Last Amended: 15 January 2007 Counc
- Page 117 and 118:
Last Amended: 15 January 2007 Counc
- Page 119 and 120:
Last Amended: 15 January 2007 Counc
- Page 121 and 122:
Last Amended: 15 January 2007 Counc
- Page 123 and 124:
Last Amended: 15 January 2007 Counc
- Page 125 and 126:
Last Amended: 15 January 2007 Counc
- Page 127 and 128:
Last Amended: 15 January 2007 Counc
- Page 129 and 130:
Last Amended: 15 January 2007 Counc
- Page 131 and 132:
Last Amended: 15 January 2007 Counc
- Page 133 and 134:
Last Amended: 15 January 2007 Counc
- Page 135 and 136:
Last Amended: 15 January 2007 Counc
- Page 137 and 138:
Last Amended: 15 January 2007 Counc
- Page 139 and 140:
Last Amended: 15 January 2007 Counc
- Page 141 and 142:
Last Amended: 15 January 2007 Counc
- Page 143 and 144:
Last Amended: 15 January 2007 Counc
- Page 145 and 146:
Last Amended: 15 January 2007 Counc
- Page 147 and 148:
Last Amended 15 January 2007 Commun
- Page 149 and 150:
Last Amended 15 January 2007 Commun
- Page 151 and 152:
Last Amended 15 January 2007 Commun
- Page 153 and 154:
Last Amended 15 January 2007 Commun
- Page 155 and 156:
Last Amended 15 January 2007 Commun
- Page 157 and 158:
Last Amended 15 January 2007 Commun
- Page 159 and 160:
Last Amended 15 January 2007 Commun
- Page 161 and 162:
Last Amended 15 January 2007 Commun
- Page 163 and 164:
Last Amended 15 January 2007 Commun
- Page 165 and 166:
Last Amended 15 January 2007 Commun
- Page 167 and 168:
Last Amended 15 January 2007 Commun
- Page 169 and 170:
Last Amended 15 January 2007 Commun
- Page 171 and 172:
Achievements Quarter 3 Appendix C A
- Page 173 and 174:
Achievements Quarter 3 Appendix C A
- Page 175 and 176:
Achievements Quarter 3 Appendix C A
- Page 177 and 178:
Achievements Quarter 3 Appendix C A
- Page 179 and 180:
Best Value Performance Indicators -
- Page 181 and 182:
Best Value Performance Indicators -
- Page 183 and 184:
Best Value Performance Indicators -
- Page 185 and 186:
Best Value Performance Indicators -
- Page 187 and 188:
Best Value Performance Indicators -
- Page 189 and 190:
Best Value Performance Indicators -
- Page 191 and 192:
Monthly PI Reporting Quarter 3 2006
- Page 193 and 194:
Monthly PI Reporting Quarter 3 2006
- Page 195 and 196: CONTENTS Page No. 1. BACKGROUND TO
- Page 197 and 198: Hillingdon Homes now manages the re
- Page 199 and 200: 2. EXECUTIVE SUMMARY The Asset Mana
- Page 201 and 202: c) Availability of clear informatio
- Page 203 and 204: London Development Association (LDA
- Page 205 and 206: Planning and Community Services •
- Page 207 and 208: and will be sold at the end of the
- Page 209 and 210: • The need for a residential home
- Page 211 and 212: due to the disposal of Hayes Stadiu
- Page 213 and 214: • The Council's property asset st
- Page 215 and 216: APPENDIX A COUNCIL’S 1-10 YEAR HO
- Page 217 and 218: Project Project Sponsor Project Man
- Page 219 and 220: Project Project Sponsor Project Man
- Page 221 and 222: Project Project Sponsor Project Man
- Page 223 and 224: Project Project Sponsor Project Man
- Page 225 and 226: COMPLETED PROJECTS Project Project
- Page 227 and 228: Project Project Sponsor Project Man
- Page 229 and 230: Use of Resources November 2006 Use
- Page 231 and 232: Use of Resources Judgements │ Con
- Page 233 and 234: Use of Resources Judgements │ Use
- Page 235 and 236: Use of Resources Judgements │ The
- Page 237 and 238: Use of Resources Judgements │ The
- Page 239 and 240: Use of Resources Judgements │ The
- Page 241 and 242: Use of Resources Judgements │ The
- Page 243 and 244: Use of Resources Judgements │ App
- Page 245: Appendix D PROPERTY PERFORMANCE IND
- Page 249 and 250: PPI 5 A & B To measure and monitor
- Page 251 and 252: 8. Over the last four years the Cou
- Page 253 and 254: CIVIC CENTRE CAPITAL REQUIREMENTS S
- Page 255 and 256: ESTATES AND VALUATION SERVICE - PER
- Page 257 and 258: P.I.NUMBER DESCRIPTION PURPOSE COMM
- Page 259 and 260: 3. A list of key buildings for gas
- Page 261 and 262: CAPITAL PROGRAMME 2007/8 - 2009/10
- Page 263 and 264: 2008/09 DEPARTMENT £k HIP Customer
- Page 265 and 266: CAPITAL PROGRAMME LINKS TO COUNCIL'
- Page 267 and 268: THE LEADER STATEMENT - the way forw
- Page 269 and 270: Deliver Phase 1 of the Mental Healt
- Page 271 and 272: APPENDIX I ORGANISATIONAL ARRANGEME
- Page 273 and 274: 2.1.3 The Director of Finance and R
- Page 275 and 276: 5.2 An officer team with an Executi
- Page 277 and 278: 7.3 The Civic Centre is now over 25
- Page 279 and 280: 10.3 In order to use the Council’
- Page 281 and 282: CORPORATE MANAGEMENT TEAM CAPITAL I
- Page 283 and 284: APPENDIX J PROPERTY DATA MANAGEMENT
- Page 285 and 286: 3.1.2 Condition Surveys 3.1.2.1 Con
- Page 287 and 288: 3.1.2.4 The total programme for an
- Page 289 and 290: 3.1.6.6 New performance management
- Page 291 and 292: APPENDIX J1 Draft Suitability and S
- Page 293 and 294: Section 2: Space 1 2 3 4 5 Possible
- Page 295 and 296: Section 4: Services/Environment 1 2
- Page 297 and 298:
Section 6: General Property Image 1
- Page 299 and 300:
APPENDIX K CONSULTATION Introductio
- Page 301 and 302:
Education and Children’s Services