APPENDIX A , item 24. PDF 4 MB - Greater Manchester Fire and ...
APPENDIX A , item 24. PDF 4 MB - Greater Manchester Fire and ...
APPENDIX A , item 24. PDF 4 MB - Greater Manchester Fire and ...

Create successful ePaper yourself
Turn your PDF publications into a flip-book with our unique Google optimized e-Paper software.
<strong>APPENDIX</strong> A<br />
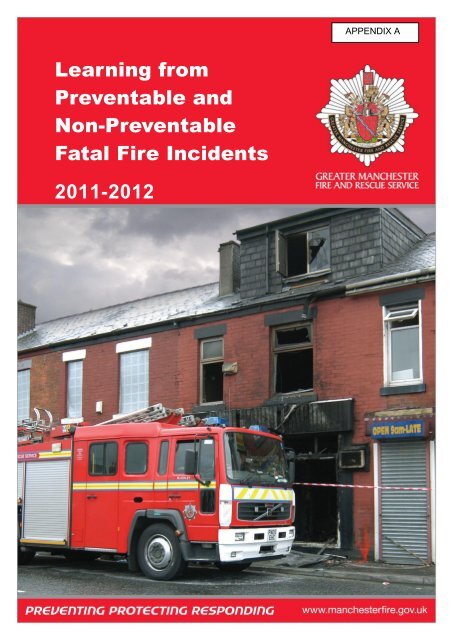
Learning from<br />
Preventable <strong>and</strong><br />
Non-Preventable<br />
Fatal <strong>Fire</strong> Incidents<br />
2011-2012
CONTENTS<br />
Contents…………………………………………………………………………………… 2<br />
Foreword…………………………………………………………………………………... 3<br />
Summary……………………………………………………………………………………4<br />
Introduction…………………………………………………………………………………5<br />
Who?...........................................................................................................................6<br />
Total number of fire deaths………………………………………………………..6<br />
Number of fire deaths by age <strong>and</strong> gender…………………………………….....7<br />
When?.......................................................................................................................11<br />
Number of deaths by month, season, day <strong>and</strong> time…………………………..11<br />
Where?......................................................................................................................15<br />
Number of deaths by borough…………………………………………………...19<br />
Why?..........................................................................................................................25<br />
Smoke detection…………………………………………………………………..25<br />
Suicide……………………………………………………………………………..31<br />
Conclusions……………………………………………………………………………….38<br />
Recommendations………………………………………………………………………..39<br />
2
FOREWORD<br />
The purpose of <strong>Greater</strong> <strong>Manchester</strong> <strong>Fire</strong> <strong>and</strong> Rescue Service (GMFRS) is to protect<br />
<strong>and</strong> improve the quality of life of the people in <strong>Greater</strong> <strong>Manchester</strong>.<br />
Throughout the last five years we have studied in detail all data relating to fatal fires<br />
that have occurred within <strong>Greater</strong> <strong>Manchester</strong>. The aim of this research was to<br />
identify <strong>and</strong> determine trends, along with contributory factors, that may allow us to<br />
underst<strong>and</strong> why members of our communities are still losing their lives in accidental<br />
fires within the home, or using fire to self-harm <strong>and</strong> commit crime.<br />
Historically we have recorded fatal fires as either fires that are accidental <strong>and</strong> could<br />
be prevented by education <strong>and</strong> intervention, or fires that are not accidental <strong>and</strong> are<br />
as the result of a deliberate human act.<br />
Preventable fatal fires have remained at a five year low, which in large part is<br />
attributable to our work within the community. During the period covered by this<br />
report, this work has included conducting 361,437 Home Safety Checks <strong>and</strong><br />
installing 432,861 smoke alarms.<br />
In contrast non-preventable fire fatalities (e.g. those resulting from suicide <strong>and</strong><br />
homicide) have increased in numbers <strong>and</strong> currently st<strong>and</strong> at a five year high.<br />
Additionally statistics show that the fiscal year 2011/12 was the 1 st year over the<br />
period of the report where non preventable fatalities from fire occurred in greater<br />
numbers than preventable fire fatalities.<br />
Non preventable fires have long been discounted as not warranting any further<br />
research due to their nature. This report clearly identifies that this category of fire<br />
incident is on the increase <strong>and</strong> therefore requires a significant effort, based on<br />
evidence, to have a positive impact on their reduction.<br />
We want to prevent all deaths that result from fire. To do so we need to challenge<br />
the belief that certain categories of fire cannot be prevented. All fatal fires deliberate<br />
or otherwise must be examined fully to determine their root cause. This approach will<br />
provide the best opportunity to assist us, our partners <strong>and</strong> our communities to put<br />
measures in place to prevent <strong>and</strong> positively intervene in the sequence of events that<br />
lead to such incidents occurring.<br />
3
SUMMARY<br />
Over the past 5 years, <strong>Greater</strong> <strong>Manchester</strong> <strong>Fire</strong> <strong>and</strong> Rescue Service have<br />
investigated 111 fatal fire related incidents. During this period we have observed<br />
preventable fire fatalities decrease by 44%, whereas in the same period we have<br />
observed non preventable fire fatalities increase by 133%.<br />
In 1991 there were 50 preventable fire fatalities in <strong>Greater</strong> <strong>Manchester</strong>, last year the<br />
number of preventable fire fatalities had reduced to 10. This fantastic reduction can<br />
be attributed to the proactive approach taken by the Service, to identify those at<br />
highest risk from fire, to help them underst<strong>and</strong> the behaviours <strong>and</strong> attributes that<br />
place them at risk <strong>and</strong> to provide them with support through education <strong>and</strong>/or<br />
equipment to reduce the risk. This has been achieved using our Emergency<br />
Response crews <strong>and</strong> staff with specialist skills <strong>and</strong> knowledge who develop <strong>and</strong><br />
deliver innovative programmes <strong>and</strong> initiatives directly in our communities.<br />
We believe that we can continue to build on this success. However this cannot be<br />
achieved in isolation <strong>and</strong> our ability to influence behaviour to further reduce the<br />
number of preventable fire fatalities, <strong>and</strong> reverse the trend in non-preventable fire<br />
fatalities can only be delivered through a partnership approach with other agencies<br />
that are engaged with the same risk groups.<br />
Historically, a fire was considered to be ‘preventable’ where it started as a result of<br />
an accident or omission <strong>and</strong> it was believed that the fire could have been prevented<br />
from occurring if appropriate education <strong>and</strong>/or advice from the fire <strong>and</strong> rescue<br />
service <strong>and</strong> its partners had been provided.<br />
A non-preventable fire was one where a fire started as a result of a deliberate act by<br />
an individual or group, or where a person had died of other causes <strong>and</strong> then a fire<br />
had occurred. It was believed that it was beyond the control of the fire <strong>and</strong> rescue<br />
service <strong>and</strong> its partners to influence the behaviours or circumstances that led to the<br />
fire occurring.<br />
<strong>Greater</strong> <strong>Manchester</strong> <strong>Fire</strong> <strong>and</strong> Rescue Service believes that all fatalities resulting from<br />
fire can be prevented through early interventions, either directly through the work of<br />
the fire <strong>and</strong> rescue service, through a joint approach with other agencies or directly<br />
by other agencies. As such the terms ‘Preventable’ <strong>and</strong> ‘Non-Preventable’, when<br />
used in relation to fatalities from fires are not entirely appropriate but assist us in<br />
identifying those deaths that occur as a consequence of an accidental act or a<br />
deliberate or unforeseen act.<br />
It is intended that this report will be shared with Elected Members, MPs, the Chief<br />
Executives of Local Authorities, Directors of Adult, <strong>and</strong> Children’s, Services,<br />
Directors of Public Health <strong>and</strong> the Chairs of Health <strong>and</strong> Wellbeing Boards to highlight<br />
the common factors that indicate a collective awareness of the risk facing those that<br />
lose their lives in fires. The objective is to place ‘<strong>Fire</strong>’ at the heart of partnership<br />
arrangements to reduce these risks, thus supporting ‘community budgets’ principles<br />
<strong>and</strong> providing better value to the communities of <strong>Greater</strong> <strong>Manchester</strong>.<br />
4
INTRODUCTION<br />
Over the past 5 years, <strong>Greater</strong> <strong>Manchester</strong> <strong>Fire</strong> <strong>and</strong> Rescue Service (GMFRS)<br />
attended 23,362 fires in buildings of which 14,825 were dwellings. During these<br />
incidents we rescued 1107 people. However, despite our best efforts, during this<br />
period 60 people lost their lives in preventable fires <strong>and</strong> 51 died as a result of nonpreventable<br />
fires.<br />
The purpose of this report is to consider preventable <strong>and</strong> non-preventable fires in<br />
greater detail. It is hoped that data will identify trends <strong>and</strong> contributory factors which<br />
will support the development of even more effective strategies <strong>and</strong> tactics to further<br />
reduce the numbers, <strong>and</strong> consequences, of fires.<br />
Previous studies into fire related deaths support the theory that the majority of fatal<br />
fires we investigate have some form of prior warning sign. If this intelligence was<br />
recognised, identified <strong>and</strong> shared between the relevant support agencies it may have<br />
resulted in the victim obtaining appropriate support, or intervention, prior to the<br />
incident occurring.<br />
It is our intention within this report to identify possible missed opportunities. We can<br />
then work with our partners, share our findings, <strong>and</strong> increase their awareness of<br />
support networks available from within GMFRS. We can then work together, more<br />
effectively, to reduce the numbers of fires within communities which result in people<br />
being seriously injured or losing their lives.<br />
5
WHO?<br />
Total number of fire deaths<br />
During the year 1 April 2011 to 31 March 2012, <strong>Greater</strong> <strong>Manchester</strong> <strong>Fire</strong> <strong>and</strong> Rescue<br />
Service recorded 24 fire related deaths. 10 of these deaths resulted from accidental<br />
fires within the home maintaining a 44% reduction in such incidents since 2007/08,<br />
when accidental fires accounted for 18 fatalities.<br />
In the same period non preventable fires resulted in 14 fatalities; this is a 133%<br />
increase on figures recorded during 2007/08 when 6 members of our community lost<br />
their lives. 2011/12 was the first year during the period covered by this report when<br />
fatalities from non-preventable fires occurred in greater numbers than preventable<br />
fires. This may be explained in part by the lack of prior research into the underlying<br />
causes <strong>and</strong> contributory factors associated with such incidents, <strong>and</strong> that it has<br />
previously been the view, held by some, that it was more difficult to prevent, ‘non<br />
preventable’ fire fatalities.<br />
In 1991 there were 50 accidental fire deaths in <strong>Greater</strong> <strong>Manchester</strong>. In 2011/12 this<br />
had reduced to 10, which equates to an 80% reduction in such incidents over this<br />
time period.<br />
Throughout the past 10 years, non-preventable fire fatalities have fluctuated from a<br />
peak of 20 fatalities during 2001/02 <strong>and</strong> the lowest recorded total of 6 during<br />
2007/08. A study of GMFRS data has identified that generally throughout this time<br />
period non preventable fire fatalities have remained in the mid to low teens showing<br />
no measurable trend, <strong>and</strong> tending to fluctuate year on year.<br />
Total number of fire deaths<br />
20<br />
18<br />
16<br />
14<br />
12<br />
10<br />
8<br />
6<br />
4<br />
2<br />
0<br />
2007/08 2008/09 2009/10 2010/11 2011/12<br />
Preventable <strong>Fire</strong> Deaths 18 11 11 10 10<br />
Non-Preventable <strong>Fire</strong> Deaths 6 13 10 8 14<br />
6
Number of fire deaths by age <strong>and</strong> gender<br />
Gender<br />
Since April 2007, 111 people in <strong>Greater</strong> <strong>Manchester</strong> have died in fire related<br />
incidents. 60 members of our community died in preventable fires. Of those 31 were<br />
male <strong>and</strong> 29 were female.<br />
51 people lost their lives as a consequence of non-preventable incidents of which 27<br />
were male <strong>and</strong> 24 were female.<br />
Our research shows that there was no evidence to suggest that one particular sex is<br />
significantly more at risk of being involved in such an incident, although figures show<br />
that both categories of fire show slightly more male fatalities than female.<br />
Preventable fire deaths by gender<br />
Period Male Female Total<br />
2007/08 9 9 18<br />
Variation<br />
from<br />
previous<br />
year<br />
2008/09 3 8 11 -7<br />
2009/10 6 5 11 0<br />
% Variation<br />
from 2007/08<br />
2010/11 5 5 10 -1<br />
2011/12 8 2 10 0 -44%<br />
5 Year Total 31 29 60<br />
Non-preventable fire deaths by gender<br />
Period Male Female Total<br />
2007/08 3 3 6<br />
Variation<br />
from<br />
previous<br />
year<br />
2008/09 7 6 13 7<br />
2009/10 5 5 10 -3<br />
% Variation<br />
from 2007/08<br />
2010/11 4 4 8 -2<br />
2011/12 8 6 14 6 133%<br />
5 Year Total 27 24 51<br />
7
Age<br />
Members of our community aged between 41 – 90 accounts for 77% of all fatalities<br />
that have occurred within <strong>Greater</strong> <strong>Manchester</strong> over the past five years. In addition,<br />
we have also lost some of our youngest <strong>and</strong> oldest members of society. Six fire<br />
fatalities involved children under the age of 10 <strong>and</strong> two persons over the age of 90<br />
lost their lives. Our oldest fatality was aged 101 years.<br />
Preventable fire deaths by age<br />
Age Range 2007/08 2008/09 2009/10 2010/11 2011/12 5 Year Total<br />
0-10 3 1 0 0 0 4<br />
11-20 0 0 0 0 0 0<br />
21-30 1 0 1 1 0 3<br />
31-40 1 0 1 1 0 3<br />
41-50 1 1 2 1 3 8<br />
51-60 3 0 1 1 2 7<br />
61-70 3 2 2 1 2 10<br />
71-80 2 2 2 2 2 10<br />
81-90 3 4 2 3 0 12<br />
91-100 0 1 0 0 1 2<br />
100+ 1 0 0 0 0 1<br />
Total 18 11 11 10 10 60<br />
People aged between 40 <strong>and</strong> 59 accounted for 29% of all GMFRS fatalities. This<br />
age group represent approximately 27% of the population of Engl<strong>and</strong>.<br />
People over the age of 60 accounted for just over 51% of all fatalities. This age<br />
group represents 23% of the population within the UK <strong>and</strong> 21% of the population of<br />
<strong>Greater</strong> <strong>Manchester</strong>. These figures identify this age group to be at significant risk of<br />
being involved in a fatal house fire.<br />
8
This risk significantly increases in members of our community above the age of 80<br />
who account for 22% of our fire fatalities, but represent only 4% of the population of<br />
<strong>Greater</strong> <strong>Manchester</strong>.<br />
It is also worth mentioning that national statistics show people aged 85 <strong>and</strong> over 1<br />
account for the fastest population increase within the UK. If this trend continues, it is<br />
anticipated that we will see an increase in fire risk <strong>and</strong> potentially fire incidents in this<br />
age group.<br />
Non-preventable fire deaths by age<br />
Age Range 2007/08 2008/09 2009/10 2010/11 2011/12 5 Year Total<br />
0-10 0 1 1 0 0 2<br />
11-20 0 0 2 0 1 3<br />
21-30 0 1 0 1 0 2<br />
31-40 1 1 0 0 3 5<br />
41-50 2 3 1 1 3 10<br />
51-60 2 3 0 2 1 8<br />
61-70 1 2 0 1 1 5<br />
71-80 0 1 5 1 2 9<br />
81-90 0 1 0 2 3 6<br />
91-100 0 0 1 0 0 1<br />
100+ 0 0 0 0 0 0<br />
Total 6 13 10 8 14 51<br />
35% of all non-preventable fire deaths occur within the age groups of 41-60.<br />
Fourteen of these fatalities occur as a result of a person utilising fire to end their life.<br />
1 In 1984, there were around 660,000 people in the UK aged 85 <strong>and</strong> over. Since then the numbers have more than doubled<br />
reaching 1.4 million in 2009. By 2034 the number of people aged 85 <strong>and</strong> over is projected to be 2.5 times larger than in 2009,<br />
reaching 3.5 million <strong>and</strong> accounting for 5 per cent of the total population. (Office for National Statistics, June 2011)<br />
9
Ethnicity<br />
Of the 111 fire fatalities, 97 were people whose ethnicity is recorded as White British,<br />
accounting for 87% of all such fatalities. 11 fatalities were from non-white ethnic<br />
groups accounting for 10% of these fatalities.<br />
Members of our community whose ethnicity is recorded as White British account for<br />
84% of the population of <strong>Greater</strong> <strong>Manchester</strong>, whereas non-white ethnic groups<br />
make up only 12%. This suggests that fatalities in both groups of ethnicity are<br />
consistent with national totals. (National statistics: Population trends 2007, Population<br />
estimates by ethnic groups 2011)<br />
Preventable fire deaths by ethnicity<br />
Ethnicity 2007/08 2008/09 2009/10 2010/11 2011/12 5 Year Total<br />
White British 15 11 10 8 9 53<br />
Sri Lankan 0 0 0 0 0 0<br />
Indian 1 0 1 0 0 2<br />
Lithuanian 0 0 0 1 0 1<br />
Hungarian 0 0 0 1 0 1<br />
Polish 1 0 0 0 0 1<br />
Somalian 0 0 0 0 0 0<br />
Pakistani 1 0 0 0 1 2<br />
Total 18 11 11 10 10 60<br />
Non-preventable fire deaths by ethnicity<br />
Ethnicity 2007/08 2008/09 2009/10 2010/11 2011/12 5 Year Total<br />
White British 3 9 10 8 14 44<br />
Sri Lankan 1 0 0 0 0 1<br />
Somalian 0 2 0 0 0 2<br />
Pakistani 2 2 0 0 0 4<br />
Total 6 13 10 8 14 51<br />
10
WHEN?<br />
Number of deaths by month, season, day <strong>and</strong> time<br />
Month<br />
Statistics throughout the five year period showed March (Preventable fire deaths)<br />
<strong>and</strong> December (Non Preventable fire deaths) as being the months in which most fire<br />
fatalities occurred. Each month recorded 12 fatalities. The months of March <strong>and</strong> April<br />
accounted for 35% of all preventable fire fatalities.<br />
Preventable fire deaths by month<br />
Month 2007/08 2008/09 2009/10 2010/11 2011/12 5 Year Total<br />
January 1 2 1 0 0 4<br />
February 1 3 1 1 0 6<br />
March 4 2 1 3 2 12<br />
April 3 0 3 2 1 9<br />
May 1 0 1 0 1 3<br />
June 1 1 1 1 1 5<br />
July 2 0 0 1 1 4<br />
August 2 1 0 1 0 4<br />
September 0 0 1 1 2 4<br />
October 0 0 0 0 2 2<br />
November 1 1 1 0 0 3<br />
December 2 1 1 0 0 4<br />
Total 18 11 11 10 10 60<br />
11
June <strong>and</strong> March (Preventable fire deaths) were the only months in which fire<br />
fatalities occurred during each year of the study, March was also the only month<br />
which recorded more than one fire death during four out of the past five years.<br />
December was the only month to record four unrelated non preventable fire fatalities.<br />
July recorded three fatalities during the year 2009/10, but these December (Non<br />
Preventable fire deaths) recorded the most fatal fire deaths occurring in one month.<br />
This resulted in 5 people losing their lives as a consequence of five separate<br />
incidents during 2011/12.<br />
Non-preventable fire deaths by month<br />
Month 2007/08 2008/09 2009/10 2010/11 2011/12 5 Year Total<br />
January 0 2 0 0 1 3<br />
February 2 1 2 0 2 7<br />
March 0 0 0 1 0 1<br />
April 0 2 0 0 1 3<br />
May 0 0 1 0 0 1<br />
June 2 2 1 1 0 6<br />
July 0 1 3 1 1 6<br />
August 0 0 1 1 0 2<br />
September 0 0 2 0 3 5<br />
October 0 1 0 0 0 1<br />
November 1 2 0 0 1 4<br />
December 1 2 0 4 5 12<br />
Total 6 13 10 8 14 51<br />
12
Season<br />
Statistics do however show some seasonal variations with 63% of preventable fires<br />
occurring in the Winter <strong>and</strong> Spring seasons. In contrast 69% of non-preventable fires<br />
occurred in the Summer <strong>and</strong> Winter seasons.<br />
The season of Spring recorded the highest total of preventable fires, but the lowest<br />
total of non-preventable fires.<br />
Winter featured the highest figures for all fatalities accounting for just over 33% of all<br />
fire deaths. Winter months lead to darker <strong>and</strong> colder nights, resulting in increased<br />
use of heating <strong>and</strong> lighting within the home. Occupants also tend to spend more time<br />
indoors, exposing the home to a higher risk of fire as a consequence of social habits<br />
such as smoking <strong>and</strong> drinking.<br />
We must also consider that Winter months may have an impact upon the increase of<br />
non-preventable fires. This time period can have a negative impact upon mental<br />
health <strong>and</strong> is often associated with financial pressures especially leading up to the<br />
festive period.<br />
Preventable fire deaths by season<br />
Season 2007/08 2008/09 2009/10 2010/11 2011/12 5 Year Total<br />
Spring 7 2 5 5 4 23<br />
Summer 5 2 1 3 2 13<br />
Autumn 1 1 2 1 4 9<br />
Winter 5 6 3 1 0 15<br />
Total 18 11 11 10 10 60<br />
Non-preventable fire deaths by season<br />
Season 2007/08 2008/09 2009/10 2010/11 2011/12 5 Year Total<br />
Spring 0 2 1 1 1 5<br />
Summer 2 3 5 3 0 13<br />
Autumn 1 3 2 0 5 11<br />
Winter 3 5 2 4 8 22<br />
Total 6 13 10 8 14 51<br />
13
Day<br />
Looking at deaths by days of the week identifies that most preventable fatal fires<br />
occurred on Sunday, Monday <strong>and</strong> Thursday, with Friday <strong>and</strong> Saturday being the<br />
safest days. It is suggested that fatalities occurring on both Sunday <strong>and</strong> Monday<br />
morning may be influenced by events occurring in the final hours of the previous<br />
evenings.<br />
Preventable fire deaths by day of the week<br />
Day 2007/08 2008/09 2009/10 2010/11 2011/12 5 Year Total<br />
Monday 2 3 1 5 1 12<br />
Tuesday 2 3 1 0 1 7<br />
Wednesday 3 1 1 0 3 8<br />
Thursday 4 1 1 3 2 11<br />
Friday 1 1 1 1 2 6<br />
Saturday 2 1 2 0 1 6<br />
Sunday 4 1 4 1 0 10<br />
Total 18 11 11 10 10 60<br />
Non-preventable fire deaths by day of the week<br />
Day 2007/08 2008/09 2009/10 2010/11 2011/12 5 Year Total<br />
Monday 1 3 0 0 4 8<br />
Tuesday 0 2 0 2 1 5<br />
Wednesday 0 1 1 3 1 6<br />
Thursday 0 2 5 0 3 10<br />
Friday 3 4 0 1 2 10<br />
Saturday 0 0 3 1 1 5<br />
Sunday 2 1 1 1 2 7<br />
Total 6 13 10 8 14 51<br />
14
During the period of the report, most non-preventable fire fatalities occurred during<br />
Thursday <strong>and</strong> Friday. One incident occurred on a Thursday in which three members<br />
of our community lost their lives. This incident occurred during 2009/10 <strong>and</strong> it is<br />
believed that the ignition of this fire was influenced by a previous history of domestic<br />
abuse <strong>and</strong> the consumption of alcohol the previous evening.<br />
All fatalities that occurred on Friday were as a consequence of ten separate<br />
incidents.<br />
15
Time<br />
<strong>Fire</strong> deaths have occurred within all defined time scales throughout the 24 hour<br />
period in both categories of fire. Most preventable fire deaths within a single time<br />
period occurred between the hours of 18:00 <strong>and</strong> 20:00, accounting for 20% of<br />
preventable fire fatalities over this five year period.<br />
Between the hours of midnight <strong>and</strong> 08:00, 21 fatalities were recorded accounting for<br />
35% of all preventable fire fatalities. It is considered that during this time period<br />
occupants will be unlikely to discover a fire in its early stage of development due to<br />
being asleep. It is therefore necessary to ensure that all properties within <strong>Greater</strong><br />
<strong>Manchester</strong> are fitted with sufficient smoke detection to ensure fires are discovered<br />
in the early stages of development <strong>and</strong> sufficient warning is provide to occupants.<br />
We must ensure that we provide a level of protection to vulnerable individuals <strong>and</strong><br />
families sufficient to address their risk. To achieve this we must ensure that Home<br />
Safety Checks are conducted in a professional manner to ensure all risks within the<br />
home are identified <strong>and</strong> fed back to the appropriate agencies <strong>and</strong> departments.<br />
Partnerships with support agencies who engage with vulnerable people should<br />
include reciprocal education <strong>and</strong> communication to ensure that risks they have<br />
identified are communicated back to GMFRS. A lack of awareness may mean that<br />
partner agencies do not identify fire risk indicators <strong>and</strong> may not appreciate the<br />
serious consequences that can result. It is our responsibility to seek out opportunities<br />
to educate key partners <strong>and</strong> establish robust partnership arrangements so that fire<br />
risk can be detected early <strong>and</strong> appropriate interventions can be offered.<br />
<strong>Fire</strong> deaths by time of day (5 year total)<br />
Preventable fire deaths<br />
Non-preventable fire deaths<br />
12<br />
10<br />
8<br />
6<br />
4<br />
2<br />
0<br />
Time range (24hr)<br />
Note: A late fire call (LFC) is one that isn’t received at the time of the fire but is received<br />
some time later, usually after the fire has been extinguished. This can occasionally be a<br />
number of days after a fire has occurred.<br />
16
Time (24hr) 2007/08 2008/09 2009/10 2010/11 2011/12 5 Year Total<br />
0000-0200 5 0 2 0 1 8<br />
0200-0400 0 0 2 1 0 3<br />
0400-0600 1 1 0 4 0 6<br />
0600-0800 1 1 0 1 1 4<br />
0800-1000 2 2 0 1 0 5<br />
1000-1200 2 1 2 0 1 6<br />
1200-1400 0 0 0 0 2 2<br />
1400-1600 0 1 1 1 0 3<br />
1600-1800 0 2 0 1 1 4<br />
1800-2000 2 3 4 1 2 12<br />
2000-2200 3 0 0 0 0 3<br />
2200-0000 2 0 0 0 0 2<br />
Undetermined<br />
Time (LFC)<br />
Preventable fire deaths by time of day<br />
0 0 0 0 2 2<br />
Total 18 11 11 10 10 60<br />
The time period in which most non preventable fatalities occurred, was between<br />
04:00 <strong>and</strong> 06:00. During this period 8 people lost their lives, three as a result of one<br />
incident that occurred during the fiscal year 2011/12.<br />
Time (24hr) 2007/08 2008/09 2009/10 2010/11 2011/12 5 Year Total<br />
0000-0200 0 1 0 1 1 3<br />
0200-0400 0 1 0 0 0 1<br />
0400-0600 0 0 3 1 4 8<br />
0600-0800 0 0 2 1 0 3<br />
0800-1000 0 2 1 0 1 4<br />
1000-1200 1 0 0 1 0 2<br />
1200-1400 0 2 0 0 1 3<br />
1400-1600 2 1 1 0 1 5<br />
1600-1800 0 1 0 0 3 4<br />
1800-2000 0 2 0 2 1 5<br />
2000-2200 0 1 0 1 1 3<br />
2200-0000 2 2 0 1 1 6<br />
Undetermined<br />
Time (LFC)<br />
Non-preventable fire deaths by time of day<br />
1 0 3 0 0 4<br />
Total 6 13 10 8 14 51<br />
17
The potential for loss of life will be increased when properties are targeted by<br />
deliberate fires during the hours when occupants are sleeping. During the time<br />
period of this report, all deliberate multiple fatal fires, where time of ignition has been<br />
clarified, occurred between the hours of 23:00 <strong>and</strong> 06:00.<br />
It is therefore important that accurate pictures of risk involving members of our<br />
community are identified. This will allow GMFRS to provide the most appropriate risk<br />
reduction strategies <strong>and</strong> interventions to address the risk.<br />
The provision of fire risk reduction equipment is one type of intervention <strong>and</strong> may<br />
consist of portable suppression equipment (sprinklers) <strong>and</strong> square wave smoke<br />
alarms. These alarms provide a low-frequency square wave signal which has been<br />
found to be significantly more effective in warning members of our community who<br />
may be hard-of-hearing or impaired by alcohol.<br />
18
WHERE?<br />
Number of deaths by borough<br />
The following tables show the distribution of both preventable <strong>and</strong> non-preventable<br />
fatalities across the ten boroughs of <strong>Greater</strong> <strong>Manchester</strong> (<strong>Manchester</strong> is split into<br />
North <strong>and</strong> South for statistical purposes). During 2011/12 there were no recorded<br />
preventable fire deaths in Bury, <strong>Manchester</strong> South, Tameside <strong>and</strong> Oldham, but<br />
comparison over a five year period identifies that Tameside, Wigan <strong>and</strong> Oldham<br />
suffered the highest levels of fatalities.<br />
Boroughs continue to work towards breaking down barriers with health <strong>and</strong> social<br />
care agencies to assist in the process of identifying people at increased risk of fire,<br />
within their community, <strong>and</strong> providing them with necessary assistance.<br />
They have been innovative in creating campaigns to address the increase in clothing<br />
related fires <strong>and</strong> continue to educate regarding the dangers of cooking related<br />
incidents. They have also identified the need for continued interaction with one<br />
borough identifying that 40% of their fires occurred in properties which had already<br />
undergone a HSC.<br />
19
Preventable fire deaths by borough<br />
Borough 2007/08 2008/09 2009/10 2010/11 2011/12 5 Year Total<br />
Bolton 0 1 0 1 2 4<br />
Bury 1 1 0 0 0 2<br />
<strong>Manchester</strong> Noth 3 0 0 2 1 6<br />
<strong>Manchester</strong> South 2 0 2 0 0 4<br />
Oldham 4 1 0 1 0 6<br />
Rochdale 1 0 2 1 2 6<br />
Salford 2 0 0 3 2 7<br />
Stockport 1 0 1 2 1 5<br />
Tameside 3 3 1 0 0 7<br />
Trafford 0 1 4 0 1 6<br />
Wigan 1 4 1 0 1 7<br />
Total 18 11 11 10 10 60<br />
During the years 2007/08 – 2010/11 Trafford was the only borough not to record any<br />
non-preventable fatalities. This trend ceased as a consequence of a multiple fatal<br />
incident during 2011/12.<br />
Non-preventable fire deaths by borough<br />
Borough 2007/08 2008/09 2009/10 2010/11 2011/12 5 Year Total<br />
Bolton 1 4 0 0 2 7<br />
Bury 1 0 2 1 1 5<br />
<strong>Manchester</strong> Noth 1 2 4 1 0 8<br />
<strong>Manchester</strong> South 0 2 0 2 1 5<br />
Oldham 1 2 0 1 0 4<br />
Rochdale 0 0 1 0 1 2<br />
Salford 1 0 1 1 1 4<br />
Stockport 1 1 0 1 2 5<br />
Tameside 0 1 0 0 2 3<br />
Trafford 0 0 0 0 3 3<br />
Wigan 0 1 2 1 1 5<br />
Total 6 13 10 8 14 51<br />
Throughout the period covered by this report no single borough has recorded zero<br />
fatalities in either preventable or non-preventable incidents. In total <strong>Manchester</strong><br />
North has recorded the most combined fatalities with a total of 14 deaths, with Bury<br />
recording the least fatalities with 7 deaths.<br />
20
Deaths by property type 2<br />
Tables below illustrate that 90% of non-preventable fire fatalities have occurred<br />
within the home, mostly within terraced, flats/maisonettes <strong>and</strong> semi-detached<br />
properties.<br />
Terraced property makes up 33% of the housing stock in <strong>Greater</strong> <strong>Manchester</strong> but<br />
accounts for 39% of all fire fatalities.<br />
Preventable fire deaths by property type<br />
Property type 2007/08 2008/09 2009/10 2010/11 2011/12 5 Year Total<br />
Aircraft 0 0 0 0 1 1<br />
Bungalow 3 0 0 1 1 5<br />
Caravan 0 0 0 1 0 1<br />
Care Home 0 1 1 0 0 2<br />
Detached 0 1 0 0 0 1<br />
Factory 0 0 0 0 1 1<br />
Flat 5 2 3 2 2 14<br />
Semi Detached 2 1 3 2 1 9<br />
Shed 0 0 0 2 0 2<br />
Terraced 8 6 3 2 4 23<br />
Public House 0 0 1 0 0 1<br />
Total 18 11 11 10 10 60<br />
2 Research shows that there are approximately 1,105,000 households within <strong>Greater</strong> <strong>Manchester</strong>, serving a population of<br />
2,572,000. (<strong>Greater</strong> <strong>Manchester</strong> Strategic Housing Market Assessment, May 2010)<br />
21
Figures show that detached properties are of a lower risk compared to other<br />
dwellings. They represent 14% of housing stock, however only 4.5% of fatalities<br />
occurred in these dwellings.<br />
It could be argued, that this reduction in risk could be as a consequence of the<br />
residents of such properties being more affluent <strong>and</strong> less socially deprived. They<br />
may have an increased awareness of fire risk within the home, <strong>and</strong> as a<br />
consequence take necessary actions to reduce this risk.<br />
Non-preventable fire deaths by property type<br />
Property type 2007/08 2008/09 2009/10 2010/11 2011/12 5 Year Total<br />
Care Home 0 1 0 0 0 1<br />
Detached 0 0 3 1 0 4<br />
Flat 1 3 2 0 3 9<br />
Motor Vehicle 0 1 0 2 0 3<br />
Open L<strong>and</strong> 0 2 0 0 1 3<br />
Semi Detached 1 1 3 2 4 11<br />
Terraced 4 5 2 3 6 20<br />
Total 6 13 10 8 14 51<br />
22
Location within property<br />
Of the 111 people that died in fire related incidents, during the period covered by this<br />
report, 37 died within the lounge of the property. These figures account for 33% of all<br />
fatalities.<br />
Both categories of fire death identify that the bedroom <strong>and</strong> lounge are the most<br />
common locations for such incidents to occur, accounting for 58% of all fatal fires.<br />
Preventable fire deaths by location within property<br />
Location 2007/08 2008/09 2009/10 2010/11 2011/12 5 Year Total<br />
Bathroom 0 0 1 0 0 1<br />
Bedroom 7 0 4 0 3 14<br />
Dining room 0 1 0 0 0 1<br />
Engine compartment 0 0 0 0 1 1<br />
Hallway 0 0 0 1 0 1<br />
Kitchen 1 1 3 3 3 11<br />
Lounge 10 7 2 4 2 25<br />
Office 0 1 0 0 0 1<br />
Processing room 0 0 0 0 1 1<br />
External 0 1 1 2 0 4<br />
Total 18 11 11 10 10 60<br />
23
16 fatalities occurred in locations outside of a domestic setting. Seven of these<br />
fatalities were as a consequence of a person deliberately using fire as a means to<br />
commit suicide.<br />
Non-preventable fire deaths by location within property<br />
Location 2007/08 2008/09 2009/10 2010/11 2011/12 5 Year Total<br />
Bathroom 0 2 0 0 0 2<br />
Bedroom 1 1 5 3 3 13<br />
Dining room 0 0 0 0 1 1<br />
Garden/yard 1 0 0 0 1 2<br />
Hallway 1 1 0 0 0 2<br />
Kitchen 1 4 2 1 1 9<br />
L<strong>and</strong>ing 0 0 0 0 3 3<br />
Lounge 2 2 3 2 3 12<br />
Motor vehicle 0 1 0 2 0 3<br />
Open l<strong>and</strong> 0 2 0 0 1 3<br />
Outhouse 0 0 0 0 1 1<br />
Total 6 13 10 8 14 51<br />
24
WHY?<br />
This section discusses the three types of deaths as recorded by HM Coroner; which<br />
are accidental death, death by natural causes <strong>and</strong> a death by intervention.<br />
An accidental death is considered to be an unforeseen <strong>and</strong> unplanned event or<br />
circumstance, often with lack of intention or necessity. It usually implies a generally<br />
negative outcome, which may have been avoided or prevented had circumstances<br />
leading up to the accident been recognised, <strong>and</strong> acted upon, prior to its occurrence.<br />
A death by natural causes is one that is primarily attributed to natural agents: usually<br />
an illness/infection or an internal malfunction of the body, such as a heart attack.<br />
Death caused by active intervention is called an unnatural death. The causes<br />
attributed to such a death are usually given as an accident (implying no<br />
unreasonable voluntary risk), misadventure (accident following a wilful <strong>and</strong><br />
dangerous risk), suicide (the intentional taking of one's own life), or homicide.<br />
Throughout the previous five years the <strong>Fire</strong> Investigation Team has investigated 111<br />
deaths. 60 deaths have been attributable to accidental causes. Throughout the<br />
previous 5 years Careless Use/Disposal of Smoking Materials (CDSM) have<br />
accounted for 42% of all preventable fire fatalities within <strong>Greater</strong> <strong>Manchester</strong>.<br />
25
Preventable fire deaths by direct cause<br />
Location 2007/08 2008/09 2009/10 2010/11 2011/12 5 Year Total<br />
C<strong>and</strong>les 2 0 0 2 0 4<br />
CDSM 10 4 4 4 3 25<br />
Chip pan 0 0 1 2 2 5<br />
Cooker left unattended 0 0 0 1 0 1<br />
Drug preparation 0 1 1 0 0 2<br />
Electrical 1 1 1 0 1 4<br />
Ignition of accelerant/vapours 0 0 1 0 1 2<br />
Microwave wheat bag 0 0 1 0 0 1<br />
Radiated heat/contact with flame 5 5 2 1 2 15<br />
Spark from machine 0 0 0 0 1 1<br />
Total 18 11 11 10 10 60<br />
Investigation into fatal fires, which occurred as a consequence of CDSM <strong>and</strong> cooking<br />
related incidents have frequently identified that several other contributory health or<br />
lifestyle factors have been present. These factors often involved the consumption of<br />
alcohol <strong>and</strong> the victim living alone. This reduced the likelihood of early discovery or<br />
escape, particularly where the occupant had some form of disability <strong>and</strong> would have<br />
required assistance to escape.<br />
<strong>Fire</strong>s involving CDSM have shown a continued reduction during the period covered<br />
by this report. During 2011/12, CDSM accounted for 30% of all preventable fire<br />
deaths, which is a considerable reduction from figures recorded in 2007/08, where<br />
10 members of our community died <strong>and</strong> CDSM accounted for 56% of all preventable<br />
fatal fires.<br />
26
Preventable fire deaths contributing factors<br />
Contributing factor 2007/08 2008/09 2009/10 2010/11 2011/12 5 Year Total<br />
Alcohol 6 2 6 6 5 25<br />
Recreational drugs 0 0 2 0 0 2<br />
Living alone 4 4 7 6 8 29<br />
Smoking materials 10 4 4 4 3 25<br />
Physical disability 3 3 2 5 5 18<br />
Social service 4 1 6 3 5 19<br />
Prescribed medication 3 1 6 4 6 20<br />
Mental illness 3 3 4 0 1 11<br />
Non-preventable fire deaths by direct cause<br />
Location 2007/08 2008/09 2009/10 2010/11 2011/12 5 Year Total<br />
Deliberate by occupier 0 0 5 0 1 6<br />
Deliberate by third party 0 3 0 1 3 7<br />
Natural causes 2 3 5 3 6 19<br />
Suicide 4 7 0 4 4 19<br />
Total 6 13 10 8 14 51<br />
Nineteen of our non-preventable fire fatalities were considered to have occurred as a<br />
result of a natural cause, following which an accidental fire has developed. These<br />
fires usually develop as a consequence of a person’s activities prior to ignition, such<br />
as smoking or cooking.<br />
The act of suicide has accounted for 37% of all non-preventable fire fatalities within<br />
<strong>Greater</strong> <strong>Manchester</strong>. This category of fire has been frequently associated with a<br />
number of contributory factors, which will be discussed later within this report.<br />
27
Thirteen people have died as a result of deliberate fires set by either an occupier of<br />
the property or a third party. All deaths relating to deliberate fires set by an occupier<br />
occurred during the years 2009/10 <strong>and</strong> 2011/12. This consisted of three incidents<br />
resulting in six fatalities. The investigation into one of these incidents resulted in a<br />
family member being convicted for manslaughter.<br />
Seven people have died as a result of deliberate fires set by a third party. One of<br />
these incidents resulted in two fatalities <strong>and</strong> three firefighters suffering injuries - one<br />
sustaining life threatening burns. A further incident involved three fatalities in which<br />
the offender died as a consequence of the fire they started.<br />
Two additional deliberate fatal fires occurred during this time period, but are not<br />
recorded within this report. The reason for this absence is that these incidents were<br />
confirmed as being non fire related deaths. The victims were confirmed deceased<br />
prior to the fire occurring, which had been ignited to conceal a prior murder.<br />
Non-preventable fire deaths contributing factors<br />
Contributing factor 2007/08 2008/09 2009/10 2010/11 2011/12 5 Year Total<br />
Alcohol 1 2 2 4 6 15<br />
Recreational drugs 0 0 1 1 0 2<br />
Living alone 2 2 3 2 9 18<br />
Smoking materials 2 0 4 2 3 11<br />
Physical disability 2 2 4 3 5 16<br />
Social service 0 3 4 2 7 16<br />
Prescribed medication 4 5 4 3 7 23<br />
Mental illness 6 6 0 1 2 15<br />
Contributory factors relating to both categories of fire identified that many of the<br />
victims had some involvement with, or were known to partner agencies. In many<br />
cases support was being received for mental health problems alcohol dependency<br />
<strong>and</strong> domestic abuse. As mentioned previously some partners are not aware or do<br />
not engage effectively with GMFRS who can support them with fire risk assessment<br />
<strong>and</strong> management. It is clear from examining the types of contributory factors<br />
associated with fatal fires that GMFRS need to work with those individuals who are<br />
often known to other agencies. We therefore need to focus our prevention work on<br />
targeting the services that support these individuals to raise awareness about the<br />
link to fire, <strong>and</strong> to develop sustainable partnership working.<br />
Contributory factors relating to non-preventable fires have identified that many<br />
individuals had the potential to be identified to GMFRS as a consequence of being<br />
known to, or under the care of, support agencies. Non preventable fires may be<br />
prevented by exploration of a person’s lifestyle. This may lead to a death by natural<br />
causes, depression that may result in a person committing suicide or physical abuse<br />
with fire being used to cause harm to themselves or to a third party.<br />
28
We need to explore with our partners how we can work together to identify<br />
opportunities to intervene in such a sequence of events. This approach is vital to<br />
ensure appropriate support is identified <strong>and</strong> provided at the earliest opportunity.<br />
Smoke detection<br />
Survey research shows that the proportion of households with a smoke alarm<br />
increased rapidly from 8% in 1988 to 70% in 1994, but has risen more slowly in later<br />
years up to 86% in 2008.<br />
In 2010/11, a smoke alarm raised the alarm in 36% of reported dwelling fires. This<br />
continued the general increase since 2000 when smoke alarms raised the alarm in<br />
only 25% of reported fires (<strong>Fire</strong> Statistics, 2010/11).<br />
Dwelling fires in which smoke alarms raise the alarm continue to:<br />
1. Be discovered more rapidly after ignition<br />
2. Be associated with lower fatal casualty rates<br />
3. Cause less damage as they are more often confined to the <strong>item</strong> first ignited.<br />
Preventable fire deaths by smoke detection<br />
2007/08 2008/09 2009/10 2010/11 2011/12 5 Year Total<br />
Total fire deaths 18 11 11 10 10 60<br />
Smoke alarm installed 14 9 9 7 6 45<br />
Smoke alarm not installed 4 2 2 3 4 15<br />
Of the smoke alarms installed<br />
Smoke alarm functioning 9 3 4 5 4 25<br />
Smoke alarm not functioning 3 3 5 2 2 15<br />
Unknown 2 3 0 0 0 5<br />
45<br />
29
Of the 55 people who died in preventable dwelling fires within <strong>Greater</strong> <strong>Manchester</strong>,<br />
45 of them lived in properties fitted with smoke alarms. Only 25 of those properties<br />
however were protected by a working smoke alarm. Of these 25 operational alarms it<br />
has to be considered that contributory factors such as the effects of alcohol <strong>and</strong><br />
disabilities may have prevented the occupier from responding effectively when<br />
alerted. It is therefore important that prevention activity is tailored to meet the needs<br />
of the individual as a one size fits all approach is not sufficient. GMFRS along with<br />
our partners must look at alternative solutions involving technology <strong>and</strong> specialist<br />
alarms such as the square wave alarm or equivalent. It must also be considered that<br />
some of the smoke alarms that were in situ may have been fitted in inappropriate<br />
locations to manage the risk effectively.<br />
<strong>Fire</strong> Investigators have identified that on many occasions residents are forced to<br />
reassess the way they live within their properties due to a change in circumstance<br />
e.g. reduced mobility. Smoke alarm provision has not been reassessed to reflect<br />
such changes in circumstances.<br />
Fifteen alarms had been installed in properties, but were found to be defective.<br />
These findings are disappointing as it would appear that smoke detection is being<br />
fitted but not being maintained. The main reasons for smoke alarms failing to<br />
activate was that they had missing or flat batteries, or the unit being unable to detect<br />
the products of combustion, resulting from improper installation or being incorrectly<br />
located.<br />
The table identifies that during the course of the study the occurrence of deaths in<br />
properties without smoke alarms has increased. It is considered that this may be as<br />
a consequence of a small percentage of the community not having been provided<br />
with a HSC.<br />
GMFRS must undertake necessary action to identify this hard to reach group <strong>and</strong><br />
provide them with necessary fire prevention advice <strong>and</strong> smoke alarm provision<br />
Note: It is important to remember that these figures do not include the many occasions when<br />
smoke alarms have alerted the occupier <strong>and</strong> allowed them <strong>and</strong> their families to safely<br />
escape the property.<br />
30
Suicide<br />
Gender<br />
The act of Suicide has accounted for 37% of all non-preventable fire fatalities within<br />
<strong>Greater</strong> <strong>Manchester</strong> <strong>and</strong> along with Natural Causes is the largest cause of nonpreventable<br />
fire fatalities.<br />
Statistics produced over the past five years do not identify a particular gender being<br />
at greater risk of committing such an act.<br />
Suicide by gender<br />
Period Male Female 5 Year Total<br />
2007/08 1 3 4<br />
2008/09 3 4 7<br />
2009/10 0 0 0<br />
2010/11 3 1 4<br />
2011/12 2 2 4<br />
5 year total 9 10 19<br />
31
Age<br />
74% of all fire related suicides involved members of our community aged between 41<br />
<strong>and</strong> 60. This is a significant finding, which requires further investigation by GMFRS<br />
<strong>and</strong> its partners to identify the contributory factors which place these age groups at a<br />
greater risk.<br />
Suicide by age<br />
Age Range 2007/08 2008/09 2009/10 2010/11 2011/12 5 Year Total<br />
0-10 0 0 0 0 0 0<br />
11-20 0 0 0 0 0 0<br />
21-30 0 1 0 1 0 2<br />
31-40 1 1 0 0 0 2<br />
41-50 2 2 0 1 3 8<br />
51-60 1 2 0 2 1 6<br />
61-70 0 1 0 0 0 1<br />
71-80 0 0 0 0 0 0<br />
81-90 0 0 0 0 0 0<br />
91-100 0 0 0 0 0 0<br />
100+ 0 0 0 0 0 0<br />
Total 4 7 0 4 4 19<br />
32
Location<br />
This table shows that of the 19 people that have died as a result of suicide, 12 have<br />
died within a dwelling. Of these, 67% occurred within the kitchen or bedroom.<br />
Remote from the property, 3 suicides occurred within a motor vehicle, one in an<br />
outhouse <strong>and</strong> 2 on open l<strong>and</strong>. All of these incidents involved the use of an ignitable<br />
liquid to accelerate the fire.<br />
Suicide by location within property<br />
Location 2007/08 2008/09 2009/10 2010/11 2011/12 5 Year Total<br />
Bedroom 0 2 0 1 1 4<br />
Garden/yard 1 0 0 0 0 1<br />
Hallway 1 0 0 0 0 1<br />
Kitchen 1 2 0 1 0 4<br />
L<strong>and</strong>ing 0 0 0 0 1 1<br />
Lounge 1 0 0 0 1 2<br />
Motor vehicle 0 1 0 2 0 3<br />
Open l<strong>and</strong> 0 2 0 0 0 2<br />
Outhouse 0 0 0 0 1 1<br />
Total 4 7 0 4 4 19<br />
33
Cause<br />
Records over the past 5 years show self-immolation being the main cause of deaths<br />
attributed to the act of suicide. Self-immolation is defined as the deliberate sacrifice<br />
of oneself by fire, <strong>and</strong> accounted for 68% of all fatalities.<br />
Suicide by direct cause<br />
Direct cause 2007/08 2008/09 2009/10 2010/11 2011/12 5 Year Total<br />
Deliberate ignition of<br />
BBQ indoors, resulting 0 0 0 0 1 1<br />
in fire<br />
Deliberate activation<br />
of explosive device<br />
0 0 0 1 0 1<br />
Delibrate ignition of<br />
dwelling whilst inside<br />
0 2 0 0 1 3<br />
Deliberate ignition of<br />
vapours<br />
0 0 0 0 1 1<br />
Self-immolation 4 5 0 3 1 13<br />
Total 4 7 0 4 4 19<br />
34
Contributory factors<br />
There are many factors, which may contribute to someone taking their own life by<br />
fire. Many people that do so are already known to other agencies <strong>and</strong> are already<br />
being provided with support <strong>and</strong> care. They may also upon investigation have<br />
previously attempted to end their own life, albeit not with the use of fire.<br />
There are also instances though, when investigations into these fires identify that a<br />
person had not been under the care of partner agencies, nor displayed any<br />
behaviour consistent with wanting to take their own life. It is this category of person<br />
that represents the greatest challenge for partner agencies to identify <strong>and</strong> provide<br />
with necessary support.<br />
The investigation into these incidents identified that mental illness, particularly<br />
depression, was the largest single contributory factor involving fire related suicides.<br />
This category predominantly involved female members of our community.<br />
Only three male non preventable fire victims displayed any evidence of mental<br />
illness. During our investigations into these deaths we were unable to determine if<br />
mental illness had been diagnosed by a doctor or the individual was considered to<br />
be depressed by loved ones. The investigation of these fires revealed no evidence of<br />
prescribed medication.<br />
35
Contributing factor<br />
Suicides by contributing factors<br />
2007/08 2008/09 2009/10<br />
2010/11 2011/12 5 year total 5 Year<br />
Total<br />
M ale F emale M ale F emale M ale F emale M ale F emale M ale F emale M ale F emale<br />
Alcohol 0 0 2 0 0 0 1 0 1 2 4 2 6<br />
Recreational drugs 0 0 0 0 0 0 1 0 0 0 1 0 1<br />
Mental health/depression 1 4 2 3 0 0 0 1 0 2 3 10 13<br />
Physical disability 0 0 1 0 0 0 0 1 0 0 1 1 2<br />
Prescribed medication 0 2 0 2 0 0 0 1 0 2 0 7 7<br />
Social services 0 0 0 2 0 0 0 0 1 2 1 4 5<br />
Total 1 6 5 7 0 0 2 3 2 8 10 24 34<br />
36
Coroner verdict<br />
HM Coroner will not always attribute a death to suicide even though a person has<br />
performed an act of deliberately setting fire to themselves or deliberately setting fire<br />
to a property they occupied then made no attempt to escape.<br />
The Coroner will in certain circumstances consider that other factors may have<br />
contributed to this death; therefore the person may not have fully understood the<br />
consequences of their actions. This may lead them to record at Inquest an open<br />
verdict (Open verdict, a finding by HM Coroner without stating the cause, where<br />
there is insufficient evidence to record any of the other verdicts, i.e. the evidence<br />
fails to meet the required proof) or death by misadventure (a lawful human act, which<br />
takes an unexpected turn <strong>and</strong> leads to death).<br />
The <strong>Fire</strong> Investigation team are required to attend <strong>and</strong> provide evidence at all HM<br />
Coroners Inquests. They will record the Coroners verdict, but will still determine an<br />
act of self-immolation under the category of suicide for our own purposes unless the<br />
Coroner determines it to be an accidental death or deliberate by third party.<br />
Coroner suicide verdict<br />
Verdict 2007/08 2008/09 2009/10 2010/11 2011/12 5 Year Total<br />
Suicide 3 3 0 1 2 9<br />
Misadventure 1 1 0 2 1 5<br />
Open 0 3 0 1 1 5<br />
Total 4 7 0 4 4 19<br />
GMFRS attend the <strong>Greater</strong> <strong>Manchester</strong> Suicide Prevention Partnership which is a<br />
multi-agency forum that provides us with access to partners with a specific interest in<br />
suicide <strong>and</strong> suicide prevention. Our aim is to assist our partners in sharing<br />
information <strong>and</strong> developing suitable support mechanisms <strong>and</strong> initiatives that can<br />
used to reduce the risk of these incidents occurring.<br />
37
Conclusions<br />
This report presents a wealth of information that has been gathered regarding the<br />
circumstances surrounding fatalities from fire in <strong>Greater</strong> <strong>Manchester</strong> over the last<br />
five years. It also shows that we have had significant successes in reducing the<br />
number of preventable fire fatalities. However the overall numbers of fire fatalities<br />
has not reduced in a similar way, due to the marked increase in the number of nonpreventable<br />
fire fatalities over the same period.<br />
This report identifies a number of issues for further consideration including:<br />
The risks of dying as a result of fire increase significantly with age <strong>and</strong> there are<br />
specific age groups that consistently demonstrate this risk e.g. 41-60 for nonpreventable<br />
fire fatalities, 81-90 for preventable fire fatalities<br />
Preventable fire fatalities appear to peak during the Spring with non-preventable<br />
fire fatalities peaking during the Winter, with a significant number of these<br />
occurring during December<br />
<strong>Manchester</strong> Borough experiences the highest number of preventable <strong>and</strong> nonpreventable<br />
fire fatalities, it also has the highest population of any borough in<br />
<strong>Greater</strong> <strong>Manchester</strong><br />
Both preventable <strong>and</strong> non-preventable fire fatalities are significantly more likely<br />
to occur in terraced housing. It is unlikely that this is attributable to the property<br />
type but may be of relevance if other factors, such as lifestyle, deprivation <strong>and</strong><br />
educational achievement are also considered<br />
Careless use of smoking materials <strong>and</strong> contact with a flame or radiated heat are<br />
by far the most significant direct causes of fires that result in preventable<br />
fatalities, with natural causes <strong>and</strong> suicide being the most significant causes of<br />
non-preventable fire fatalities<br />
Living alone, use of alcohol <strong>and</strong> smoking are the most prevalent contributory<br />
factors in preventable fire fatalities. The distinction between contributory factors<br />
is more difficult to identify when considering non-preventable fire fatalities,<br />
however the presence or use of prescription medicines has been a factor in over<br />
50% of all such fire fatalities<br />
Although there has been a significant reduction in the number of preventable fire<br />
fatalities, it remains the case that the majority of preventable fire fatalities occur<br />
in properties that either have not had a smoke alarm fitted or the smoke alarm<br />
has been defective<br />
The number of fatalities where fire has been used as a means of committing<br />
suicide has remained relatively unchanged during the period of the report. This is<br />
an approach that is predominantly used by those aged between 41 <strong>and</strong> 60, with<br />
mental health being the most significant contributory factor <strong>and</strong> self-immolation<br />
being the most prevalent method used<br />
38
The information presented provides <strong>Greater</strong> <strong>Manchester</strong> <strong>Fire</strong> <strong>and</strong> Rescue Service an<br />
opportunity, with its’ partners, to develop <strong>and</strong> deliver appropriate strategies <strong>and</strong><br />
tactics to further reduce the impact of fire on our communities whilst simultaneously<br />
meeting the aims of a number of agencies.<br />
Recommendations<br />
1. Share this report with elected officials, <strong>and</strong> our statutory partners, to influence<br />
greater involvement, by GMFRS, in partnership arrangements to reduce overall<br />
risk within our communities<br />
2. Develop <strong>and</strong> implement a consistent approach to supporting those that are at a<br />
higher risk from fire as a result of threats or violence. Particular attention should<br />
be paid to consistency of approaches with Victim Support, Witness Support <strong>and</strong><br />
through the Multi Agency Risk Assessment Conference (MARAC) process.<br />
3. Through our Corporate Planning <strong>and</strong> Intelligence (CPI) Directorate, commission<br />
analysis/research to consider whether there are any emerging combinations of<br />
contributory factors contained within the report that are more likely to lead to<br />
either a preventable or non-preventable fire fatality.<br />
4. Through our team of Central Prevention Coordinators, develop campaigns <strong>and</strong><br />
initiatives to address the findings of the analysis/research referenced above.<br />
5. Further develop our relationships with partners such as Age UK, Health/Mental<br />
Health service providers <strong>and</strong> Suicide Prevention Partnerships, to identify why the<br />
number of non-preventable fire fatalities is rising <strong>and</strong> to support those individuals<br />
most at risk from fire.<br />
6. To provide a more robust measure of rates of fire related fatalities, introduce<br />
reporting <strong>and</strong> measurement of fire fatalities by Borough, on a per capita basis.<br />
7. To provide a statistically valid evidence base for our future activities, exp<strong>and</strong> the<br />
role of <strong>Fire</strong> Investigators within <strong>Greater</strong> <strong>Manchester</strong>, to include more detailed<br />
recording <strong>and</strong> reporting of information from fires (preventable <strong>and</strong> nonpreventable)<br />
that have resulted in serious injuries.<br />
8. To support the work of our CPI Directorate, train our <strong>Fire</strong> Investigators to<br />
undertake the role of interviewers as part of the Post Incident Research project.<br />
39