ECS Transactions 3, (4), 321-337 (2006) - Dieter Schroder - Arizona ...
ECS Transactions 3, (4), 321-337 (2006) - Dieter Schroder - Arizona ...
ECS Transactions 3, (4), 321-337 (2006) - Dieter Schroder - Arizona ...

You also want an ePaper? Increase the reach of your titles
YUMPU automatically turns print PDFs into web optimized ePapers that Google loves.
<strong>ECS</strong> <strong>Transactions</strong> 3, (4), <strong>321</strong>-<strong>337</strong> (<strong>2006</strong>)<br />
For a p-type semiconductor with steady state or transient light incident on the sample,<br />
the effective lifetime τ eff is<br />
∆n(<br />
t)<br />
τ<br />
eff<br />
( ∆n)<br />
=<br />
[3]<br />
G(<br />
t)<br />
− d∆n(<br />
t) / dt<br />
where ∆n(t) is the time-dependent excess minority carrier density and G the ehp generation<br />
rate. The effective lifetime is given by 12<br />
1 1 2 ⎛ βd<br />
⎞ sr<br />
= + Dβ<br />
tan ⎜ ⎟ =<br />
[4]<br />
τ<br />
eff<br />
τ<br />
B ; ⎝ 2 ⎠ βD<br />
where τ B is the bulk recombination lifetime, D the minority carrier diffusion constant under<br />
low injection level and the ambipolar diffusion constant under high injection, s r the<br />
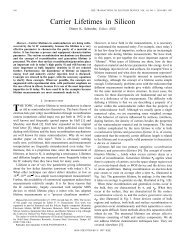
surface recombination velocity, and d the sample thickness. τ eff is plotted in Fig. 3(a) versus<br />
d as a function of sr. For thin samples, τ eff no longer bears any resemblance to τ B , the<br />
bulk lifetime, and is entirely dominated by surface recombination. The surface recombination<br />
velocity must be known to determine τ B unambiguously unless the sample is sufficiently<br />
thick. For low to moderate s r , Eq. [4] becomes<br />
1 1 1<br />
= +<br />
[5]<br />
τ<br />
eff<br />
τ<br />
B<br />
τ<br />
S<br />
where τ S is the surface lifetime.<br />
τ eff<br />
(s)<br />
10 -4<br />
10 -5<br />
s r =10 cm/s<br />
10 -6<br />
10 3<br />
10 -7<br />
τ<br />
10 -8<br />
B<br />
= 9x10 -5 s<br />
10 5<br />
10 -9<br />
10 7 D n<br />
= 30 cm 2 /s<br />
10 -5 10 -4 10 -3 10 -2 10 -1 10 0<br />
d (cm)<br />
10 2 600<br />
10 4 400<br />
200<br />
0<br />
325<br />
τ eff<br />
(µs)<br />
1200<br />
1000<br />
800<br />
SRH<br />
Recomb.<br />
Auger<br />
Recomb.<br />
10 12 10 13 10 14 10 15 10 16 10 17<br />
Injection Level (cm -3 )<br />
(a)<br />
(b)<br />
Figure 3. (a) Effective lifetime versus wafer thickness as a function of surface recombination<br />
velocity; (b) effective lifetime versus excess carrier density. 13<br />
The QSSPC lifetime is shown in Fig. 3(b) as a function of injection level. As the injection<br />
level increases, the lifetime increases due to high-level injection and eventually<br />
decreases due to Auger recombination. The important point is that this measurement is<br />
done during one flash lamp decay and it yields information about the injection level dependence<br />
of the lifetime.<br />
Free carrier absorption An interesting lifetime characterization approach uses infrared<br />
(IR) radiation from a black body transmitted through the sample and detected by an infrared<br />
light detecting array as the detector. 14 The black body source can be as simple as a<br />
hot plate. A laser with photon energy hν > E G creates electron-hole pairs in the sample.<br />
By taking the difference of the IR radiation through the sample with and without the laser<br />
irradiation, one measures the free carrier absorption due to the excess carriers. Taking<br />
two-dimensional images of the IR radiation over the entire wafer simultaneously, allows<br />
for rapid measurements.