Carrier Lifetimes in Silicon - Dieter Schroder - Arizona State University
Carrier Lifetimes in Silicon - Dieter Schroder - Arizona State University
Carrier Lifetimes in Silicon - Dieter Schroder - Arizona State University

You also want an ePaper? Increase the reach of your titles
YUMPU automatically turns print PDFs into web optimized ePapers that Google loves.
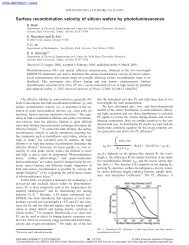
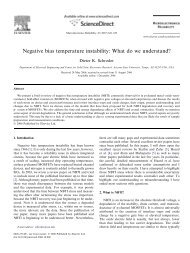
166 IEEE TRANSACTIONS ON ELECTRON DEVICES, VOL. 44, NO. 1, JANUARY 1997<br />
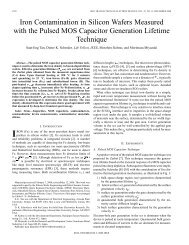
Fig. 12. r;e versus N T for E T = 0:4 eV;p o = 10 15 cm 03 ; n =<br />
2210 014 cm 2 ; p =5210 016 cm 2 ; =0:01;t = 650 m;T = 300<br />
K. The experimental data sources are for Fe <strong>in</strong> Si.<br />
Fig. 13. r;e versus N Fe for p o =10 15 cm 03 ; p =5210 016 cm 2<br />
; = 0:01;t = 650 m;T = 300 K.<br />
proportional to impurity density only <strong>in</strong> that range where the<br />
bulk lifetime dom<strong>in</strong>ates the surface lifetime, i.e., at the higher<br />
impurity densities. For low impurity densities, becomes<br />
<strong>in</strong>dependent of and is governed chiefly by<br />
The scatter <strong>in</strong> the experimental data is caused by Fe be<strong>in</strong>g<br />
<strong>in</strong> one of two states <strong>in</strong> -Si: either <strong>in</strong>terstitial iron Fe or<br />
iron-boron pairs (Fe-B). When an Fe-contam<strong>in</strong>ated, B-doped<br />
Si wafer has been at room temperature for a few hours, the<br />
iron forms pairs with boron. Upon heat<strong>in</strong>g at around 200<br />
C for a few m<strong>in</strong>utes or illum<strong>in</strong>at<strong>in</strong>g the device, the Fe-B<br />
pairs dissociate <strong>in</strong>to <strong>in</strong>terstitial Fe and substitutional B. The<br />
recomb<strong>in</strong>ation properties of Fe differ from those of Fe-B.<br />
Fig. 13 shows the effective lifetime for these two states of Fe<br />
<strong>in</strong> B-doped Si us<strong>in</strong>g the recomb<strong>in</strong>ation coefficients of Zoth and<br />
Bergholz [13]. The ratio (Fe-B)/ Fe and the<br />
data po<strong>in</strong>ts agree quite well with theory. It is this ratio, or more<br />
commonly the ratio of m<strong>in</strong>ority carrier diffusion lengths, that is<br />
commonly used to determ<strong>in</strong>e the Fe contam<strong>in</strong>ation <strong>in</strong> -doped<br />
Si. By measur<strong>in</strong>g the diffusion length of an Fe-contam<strong>in</strong>ated<br />
sample before and after Fe-B pair dissociation, Fe<br />
is [13]<br />
(a)<br />
cm (18)<br />
with diffusion lengths <strong>in</strong> units of m Similar to iron,<br />
chromium <strong>in</strong> -doped Si also forms pairs. However, <strong>in</strong> this<br />
case the diffusion length <strong>in</strong>creases after pair dissociation and<br />
the appropriate relationship is [14]<br />
cm (19)<br />
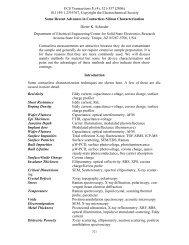
To separate bulk and surface lifetimes, one can use the<br />
approximation of (17) <strong>in</strong> (14) and vary the sample thickness<br />
For low one plots versus The <strong>in</strong>tercept of<br />
such a plot yields and the slope yields as shown <strong>in</strong><br />
Fig. 14(a). For high usually obta<strong>in</strong>ed by sandblast<strong>in</strong>g the<br />
sample surfaces, one plots versus The <strong>in</strong>tercept<br />
(b)<br />
Fig. 14. (a) 1= r;e versus 1=t to extract r and s r: After [19]; (b) 1= r;e<br />
versus 1=t 2 to extract r and D n; p-Si, 18.3 1cm. After [20].<br />
of this plot yields and the slope yields as shown <strong>in</strong><br />
Fig. 14(b).<br />
Low surface recomb<strong>in</strong>ation velocities can be achieved by<br />
treat<strong>in</strong>g the surface <strong>in</strong> one of several ways. Oxidized Si<br />
surfaces have been reported with cm/s, [21] but values