Surface voltage and surface photovoltage - Dieter Schroder ...
Surface voltage and surface photovoltage - Dieter Schroder ...
Surface voltage and surface photovoltage - Dieter Schroder ...

You also want an ePaper? Increase the reach of your titles
YUMPU automatically turns print PDFs into web optimized ePapers that Google loves.
<strong>Surface</strong> <strong>voltage</strong> <strong>and</strong> <strong>surface</strong> photo<strong>voltage</strong><br />
Q Q S<br />
+ _ _<br />
+ _<br />
+<br />
(a)<br />
p-type<br />
E c<br />
V SPV<br />
E c<br />
E i<br />
Φ<br />
E Fn<br />
E i<br />
E F<br />
E v<br />
E Fp<br />
E F<br />
E v<br />
(b)<br />
(c)<br />
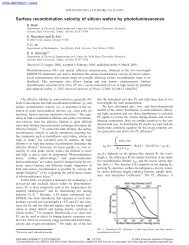
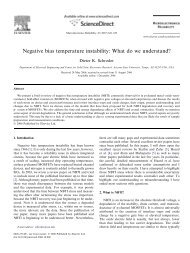
Figure 8. (a) Device cross section showing the <strong>surface</strong> charge density Q <strong>and</strong> the semiconductor charge density Q S , (b) the b<strong>and</strong> diagram in<br />
the dark <strong>and</strong> (c) the illuminated b<strong>and</strong> diagram.<br />
carrier lifetime/diffusion lengths are so commonly measured<br />
is that they provide information about the low defect densities<br />
consistent with today’s integrated circuits. No other technique<br />
can detect defect densities as low as 10 9 –10 11 cm −3 in a simple,<br />
contactless room temperature measurement. In contrast to<br />
analytical techniques whose signals are usually proportional<br />
to impurity density, lifetime <strong>and</strong> diffusion length are<br />
inversely proportional to impurity density. Hence, analytical<br />
technique signals decrease while lifetime/diffusion length<br />
signals increase with decreasing impurity density. Further, the<br />
availability of commercial, clean room compatible equipment<br />
makes these measurements relatively simple. It is for these<br />
reasons that the IC community has adopted lifetime/diffusion<br />
length measurements as a ‘process cleanliness monitor’. The<br />
introduction of corona charge has extended the applicability<br />
of <strong>surface</strong> <strong>voltage</strong>/photo<strong>voltage</strong> characterization to many other<br />
measurements, mentioned above.<br />
<strong>Surface</strong> photo<strong>voltage</strong> is an attractive diffusion length<br />
characterization technique, because it is nondestructive <strong>and</strong><br />
contactless, sample preparation is simple (no contacts,<br />
junctions, or high temperature processing required), it is<br />
a steady-state method <strong>and</strong> the equipment is commercially<br />
available. The concept of <strong>surface</strong> photo<strong>voltage</strong> can be<br />
understood with the b<strong>and</strong> diagram in figure 8. <strong>Surface</strong><br />
charge density Q induces an equivalent charge density in the<br />
semiconductor, Q S , with Q + Q S = 0 shown in figure 8(a).<br />
The semiconductor charge, in depletion, is provided by the<br />
ionized space charge density qN A W, neglecting electrons <strong>and</strong><br />
holes in the space-charge region. The b<strong>and</strong> diagram in the<br />
dark is shown in figure 8(b). When the sample is illuminated,<br />
the Fermi level splits into the quasi-Fermi levels E Fn <strong>and</strong> E Fp<br />
with the <strong>surface</strong> photo<strong>voltage</strong> equal to the splitting potential.<br />
The b<strong>and</strong> bending is reduced as in figure 8(c).<br />
The sample is assumed to be homogeneous <strong>and</strong> is of<br />
thickness d, as shown in figure 9. One <strong>surface</strong> is chemically<br />
treated to induce a <strong>surface</strong> space-charge region as described<br />
earlier. The wafer can be homogeneous, or it can be in the<br />
form of a pn junction or metal–semiconductor junction. We<br />
will only treat the homogeneous case here. The <strong>surface</strong> with the<br />
induced scr is uniformly illuminated by monochromatic light<br />
of energy higher than the b<strong>and</strong> gap, with the back <strong>surface</strong> kept<br />
in the dark. The light is chopped to enhance the signal/noise<br />
ratio using lock-in techniques. The wavelength is varied with<br />
a monochromator or a series of filters transmitting selected<br />
wavelengths.<br />
s r s 1<br />
Φ(λ)<br />
V P<br />
V SPV<br />
p-Type<br />
(τ n , D n , L n )<br />
0 W d x<br />
Figure 9. Sample for SPV measurements. The black circles<br />
represent electrons <strong>and</strong> the open circles represent holes.<br />
Electron–hole pairs (ehps) are generated in both the spacecharge<br />
region (scr) <strong>and</strong> in the p-substrate by absorbed photons.<br />
The ehps generated in the scr are very quickly separated by the<br />
electric field with the minority electrons drifting to the <strong>surface</strong>.<br />
Those minority carriers in the quasi-neutral substrate, within<br />
approximately a minority carrier diffusion length of the scr<br />
edge, diffuse <strong>and</strong> drift toward the <strong>surface</strong>, establishing a <strong>surface</strong><br />
potential or <strong>surface</strong> photo<strong>voltage</strong> relative to the grounded back<br />
<strong>surface</strong>. The <strong>surface</strong> photo<strong>voltage</strong> is proportional to the excess<br />
minority carrier density, n(W), at the edge of the scr, as<br />
described in more detail in appendix A. Light reaching the<br />
back <strong>surface</strong> produces an undesirable SPV signal that can be<br />
detected by its large amplitude, by a reversal in signal polarity<br />
over the SPV wavelength range or by a signal decrease with<br />
increasing illumination at the longer wavelengths.<br />
Equation (A4) in appendix A gives the excess carrier<br />
density. In principle, it is possible to extract the diffusion<br />
length L n from that expression for arbitrary W, d <strong>and</strong> α, the<br />
optical absorption coefficient. In practice this is difficult to<br />
do <strong>and</strong> several constraints are usually imposed on the sample<br />
to simplify data extraction. The undepleted wafer should<br />
be much thicker than the diffusion length <strong>and</strong> the scr width<br />
should be small compared to L n . The absorption coefficient<br />
should be sufficiently low for αW ≪ 1, but sufficiently high<br />
for α(d − W) ≫ 1. The diameter of the light should be<br />
larger than the sample thickness, allowing a one-dimensional<br />
analysis <strong>and</strong> low-level injection (excess carrier density (n)<br />
is lower than the majority carrier density p 0 ) should prevail.<br />
The assumptions<br />
d − W 4L n W ≪ L n αW ≪ 1<br />
α(d − W) ≫ 1 n ≪ p 0 (16)<br />
allow equation (A4) to be simplified to (see appendix A)<br />
(1 − R) L n<br />
n(W) ≈<br />
(s 1 + D n /L n ) (L n +1/α) . (17)<br />
R21