Surface voltage and surface photovoltage - Dieter Schroder ...
Surface voltage and surface photovoltage - Dieter Schroder ...
Surface voltage and surface photovoltage - Dieter Schroder ...

You also want an ePaper? Increase the reach of your titles
YUMPU automatically turns print PDFs into web optimized ePapers that Google loves.
INSTITUTE OF PHYSICS PUBLISHING<br />
MEASUREMENT SCIENCE AND TECHNOLOGY<br />
Meas. Sci. Technol. 12 (2001) R16–R31 www.iop.org/Journals/mt PII: S0957-0233(01)13738-0<br />
REVIEW ARTICLE<br />
<strong>Surface</strong> <strong>voltage</strong> <strong>and</strong> <strong>surface</strong> photo<strong>voltage</strong>:<br />
history, theory <strong>and</strong> applications<br />
<strong>Dieter</strong> K <strong>Schroder</strong><br />
Department of Electrical Engineering, Center for Solid State Electronics Research,<br />
Arizona State University, Tempe, AZ 85287-5706, USA<br />
Received 3 May 2000, in final form 19 October 2000, accepted for<br />
publication 14 December 2000<br />
Abstract<br />
<strong>Surface</strong> <strong>voltage</strong> <strong>and</strong> <strong>surface</strong> photo<strong>voltage</strong> measurements have become<br />
important semiconductor characterization tools, largely because of the<br />
availability of commercial equipment <strong>and</strong> the contactless nature of the<br />
measurements. The range of the basic technique has been exp<strong>and</strong>ed through<br />
the addition of corona charge. The combination of <strong>surface</strong> charge <strong>and</strong><br />
illumination allows <strong>surface</strong> <strong>voltage</strong>, <strong>surface</strong> barrier height, flatb<strong>and</strong> <strong>voltage</strong>,<br />
oxide thickness, oxide charge density, interface trap density, mobile charge<br />
density, oxide integrity, minority carrier diffusion length, generation<br />
lifetime, recombination lifetime <strong>and</strong> doping density to be determined. In<br />
this review I shall briefly review the history of <strong>surface</strong> <strong>voltage</strong>, then discuss<br />
the principles of the technique <strong>and</strong> give some examples <strong>and</strong> applications.<br />
Keywords: semiconductors, <strong>surface</strong> <strong>voltage</strong>, photo<strong>voltage</strong>, Kelvin probe,<br />
lifetime, diffusion length, charge, oxide, oxide thickness<br />
(Some figures in this article are in colour only in the electronic version; see www.iop.org)<br />
1. Introduction<br />
<strong>Surface</strong> <strong>voltage</strong> (SV) <strong>and</strong> <strong>surface</strong> photo<strong>voltage</strong> (SPV)<br />
semiconductor characterization techniques have become<br />
powerful methods to determine a number of material/device<br />
parameters. The range of the basic technique has been<br />
exp<strong>and</strong>ed through the addition of corona charge deposited on<br />
the sample. The method is particularly attractive because<br />
it is usually contactless with the potential measured with<br />
a Kelvin probe. Kelvin probes have traditionally been<br />
used to measure the sample work function as a function<br />
of <strong>surface</strong> treatment. They were adapted to semiconductor<br />
characterization for oxide charge <strong>and</strong> later, in combination<br />
with optical excitation, to minority carrier diffusion length<br />
by <strong>surface</strong> photo<strong>voltage</strong>. The introduction of commercial<br />
equipment led to widespread adoption by the semiconductor<br />
industry. When this contactless technique was further<br />
exp<strong>and</strong>ed by the addition of deposited corona charge, the<br />
application exp<strong>and</strong>ed further, leading to characterization of<br />
<strong>surface</strong> <strong>voltage</strong>, <strong>surface</strong> barrier height, flatb<strong>and</strong> <strong>voltage</strong>,<br />
oxide thickness, oxide leakage current, interface trap density,<br />
mobile charge density, oxide integrity, generation lifetime,<br />
recombination lifetime <strong>and</strong> doping density.<br />
After giving a brief history, I shall discuss charging<br />
techniques including both chemical rinses <strong>and</strong> corona charge.<br />
This is followed by the theory of charged <strong>surface</strong>s <strong>and</strong> then by<br />
some examples.<br />
2. Some history<br />
Bardeen <strong>and</strong> Brattain first described the SPV technique in 1953<br />
[1]. They characterized the light-induced <strong>surface</strong> potential<br />
variation in Ge samples with a mechanically vibrating reed.<br />
In 1955 Garrett <strong>and</strong> Brattain presented the basic theory<br />
of the photo-induced change of the <strong>surface</strong> potential in a<br />
semiconductor when illuminated with light [2]. In the same<br />
year, Moss considered diffusion of photo-generated carriers<br />
during <strong>surface</strong> photo<strong>voltage</strong> measurements [3]. He called<br />
it ‘photo<strong>voltage</strong>’ <strong>and</strong> the ‘photovoltaic effect’. The name<br />
‘<strong>surface</strong> photo<strong>voltage</strong>’ appears to have been used first by<br />
Brattain <strong>and</strong> Garret in 1956 using continuous illumination [4].<br />
Morrison used a chopped light signal for capacitive detection<br />
of the <strong>voltage</strong> [5]. The application of SPV to determine the<br />
minority carrier diffusion length was proposed by Moss in<br />
1955, by Johnson in 1957 [6], by Quilliet <strong>and</strong> Gosar in 1960 [7]<br />
0957-0233/01/030016+16$30.00 © 2001 IOP Publishing Ltd Printed in the UK R16
<strong>Surface</strong> <strong>voltage</strong> <strong>and</strong> <strong>surface</strong> photo<strong>voltage</strong><br />
<strong>and</strong> by Goodman in 1961 [8]. It was Goodman’s SPV approach<br />
that led to the first full-scale implementation of the technique<br />
in the semiconductor industry at RCA [9]. It was employed<br />
during semiconductor production by inserting high diffusion<br />
length wafers into critical furnaces <strong>and</strong> measuring the diffusion<br />
length after heating the wafers to characterize the cleanliness<br />
of these furnaces. Through this relatively simple, contactless<br />
method, they were able to determine cracked furnace tubes,<br />
contaminated solid source diffusion sources, metallic contact<br />
contamination <strong>and</strong> other contamination sources.<br />
Instead of dc <strong>surface</strong> <strong>voltage</strong> or photo<strong>voltage</strong> measurements,<br />
lifetimes or diffusion lengths can also be extracted<br />
from frequency-dependent, charge-based measurements.<br />
Nakhmanson was one of the first to introduce<br />
frequency-dependent optically induced lifetime measurements<br />
[10]. The equivalent circuit concept has proven to be<br />
very powerful for the analysis of such measurements. Some of<br />
the earliest papers dealing with equivalent circuits are due to<br />
Lehovec <strong>and</strong> Slobodskoy [11] <strong>and</strong> Hofstein <strong>and</strong> Warfield [12].<br />
During charge-based measurements, charge is deposited<br />
on the wafer <strong>and</strong> the semiconductor response is measured by<br />
one of several techniques, from a corona source or through a<br />
chemical rinse. To underst<strong>and</strong> charge-based measurements, it<br />
is necessary to underst<strong>and</strong> Kelvin probe measurements, first<br />
proposed by Kelvin in 1881 [13]. Kronik <strong>and</strong> Shapira give an<br />
excellent review of such probes <strong>and</strong> their various applications<br />
[14]. A Kelvin probe is usually operated as a vibrating probe<br />
with minimization of the external current. The probes in some<br />
characterization instruments are not vibrating <strong>and</strong> we will refer<br />
to such probes as <strong>surface</strong> <strong>voltage</strong> probes.<br />
The energy b<strong>and</strong> diagram of the probe–air–semiconductor<br />
system is analogous to that of an MOS capacitor with the<br />
insulator replaced with air. Positive charges, deposited on<br />
the semiconductor <strong>surface</strong>, deplete the <strong>surface</strong> of the p-type<br />
sample. Photons, incident on the sample, generate excess<br />
carriers within the space-charge region <strong>and</strong> in the quasineutral<br />
bulk region. The electrons within the scr <strong>and</strong> within a<br />
distance of approximately the minority carrier diffusion length<br />
from the edge of the scr are collected in the space-charge<br />
region <strong>and</strong> reduce the <strong>surface</strong> potential barrier. The barrier<br />
lowering is similar to a forward-biased junction <strong>and</strong> the probe<br />
detects the difference of the quasi-Fermi levels. For high-level<br />
injection, the <strong>surface</strong> potential vanishes <strong>and</strong> the probe achieves<br />
its maximum potential [15].<br />
3. <strong>Surface</strong> charging<br />
A crucial component for charge-based measurements is the<br />
<strong>surface</strong> treatment to create the <strong>surface</strong> space-charge region.<br />
Two options are available: treat the <strong>surface</strong> chemically or<br />
deposit corona charge. During chemical treatment, for n-type<br />
silicon, the oxide on the sample <strong>surface</strong> should removed <strong>and</strong><br />
then the sample should be boiled in H 2 O 2 or in water for<br />
about 15 min <strong>and</strong> then rinsed in deionized water (DI) [16].<br />
Alternately, one can soak the sample in KMnO 4 for 1–2 min<br />
<strong>and</strong> then rinse in DI water. These treatments produce a stable<br />
depletion <strong>surface</strong> potential barrier. For p-type silicon very little<br />
treatment is required. In the case of very low V SPV , etching in<br />
buffered HF followed by a DI water rinse is recommended.<br />
+<br />
5 – 10 kV<br />
Semiconductor Wafer<br />
Wafer Chuck<br />
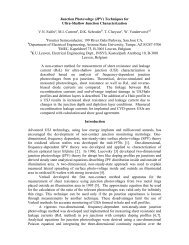
Figure 1. Schematic illustration of a point electrode corona<br />
charging method. The deposited charge is precisely measured with<br />
the operational amplifier charge meter.<br />
Corona charging is a second method of depositing charge<br />
on a <strong>surface</strong>. It is most commonly used in copying processes<br />
using xerographic techniques where the charge is deposited on<br />
a photoconductive drum [17]. One of the first uses of deposited<br />
charge in the field of semiconductors was by Williams <strong>and</strong><br />
Willis in the characterization of ZnO in 1968 [18]. Williams<br />
<strong>and</strong> Woods [19] <strong>and</strong> Weinberg [20] later exp<strong>and</strong>ed the approach<br />
to the characterization of oxide leakage current <strong>and</strong> mobile<br />
charge drift [21]. The method consists of the deposition of<br />
ions on a <strong>surface</strong> at atmospheric pressure through an electric<br />
field applied to a source of ions. The corona source consists of a<br />
wire, a series of wires, a single point or multiple points located<br />
a few mm or cm above the sample <strong>surface</strong> [22]. The substrate<br />
may be moved during charging or between charging cycles <strong>and</strong><br />
the sample may be charged uniformly or in well defined areas<br />
through a mask arrangement. It is even possible to deposit positive<br />
(negative) charge in a given area <strong>and</strong> surround the area with<br />
negative (positive) charge, to act as a guard ring [23]. In contrast<br />
to metallic guard rings that always contain a gap between<br />
the two electrodes, a corona charge guard ring has zero gap.<br />
A potential of 5000–10 000 V of either polarity is applied<br />
to the corona source, as illustrated in figure 1. Ions are<br />
generated close to the electrode, where a faint glow may<br />
be observed in a darkened room. For a negative source<br />
potential, positive ions bombard the source while free electrons<br />
are rapidly captured by ambient molecules to form negative<br />
ions. For a positive source potential, electrons are attracted<br />
to the source <strong>and</strong> positive ions follow the electric field lines<br />
to the substrate. The negative <strong>and</strong> positive corona ionic<br />
species are predominantly CO 3− <strong>and</strong> H 3 O + (hydrated protons),<br />
respectively. The corona source forces a uniform flow of<br />
ionized air molecules toward the <strong>surface</strong>. The very short<br />
(approximately 0.1 µm) atmospheric mean free path of the<br />
ionized gas ensures collision-dominated ion transport with the<br />
molecules retaining very little kinetic energy. The charge is<br />
not permanent <strong>and</strong> can be removed by a water rinse. Typically<br />
a few seconds are required to charge an insulating <strong>surface</strong> to a<br />
saturation potential.<br />
One of the advantages for oxide thickness <strong>and</strong> oxide<br />
integrity measurements using corona charge ‘gates’ rather than<br />
conductive gates is the low <strong>surface</strong> mobility of the ‘corona’ ions<br />
on the sample <strong>surface</strong>. A charge deposited on the <strong>surface</strong> of<br />
an oxidized wafer, creates an oxide electric field. The oxide<br />
will break down at its weakest spot, with the current confined<br />
to the breakdown spot, because the <strong>surface</strong> corona charge does<br />
R17
D K <strong>Schroder</strong><br />
Vibrating Ref.<br />
Electrode<br />
V B<br />
Substrate<br />
Vibrating<br />
Fork<br />
Steady Ref.<br />
Electrode<br />
V B<br />
Substrate<br />
Figure 2. Kelvin probe (left) <strong>and</strong> Monroe probe (right) for contact<br />
potential difference measurements.<br />
not readily drift or diffuse along the <strong>surface</strong>. By contrast, for<br />
a conductive gate with applied gate <strong>voltage</strong>, the breakdown<br />
area may be the same as for the corona charge method, but the<br />
current from the entire gate area will be channelled into the<br />
weak spot, frequently leading to catastrophic breakdown.<br />
4. Theory<br />
How does a <strong>surface</strong> <strong>voltage</strong> or photo<strong>voltage</strong> come about <strong>and</strong><br />
how is it measured? A <strong>surface</strong> <strong>voltage</strong> is usually the result of<br />
a <strong>surface</strong> or insulator charge or work function difference <strong>and</strong><br />
it is most commonly detected with a non-contacting probe.<br />
The probe is a small plate, 2–4 mm in diameter, held above<br />
the sample at a distance of typically 0.1–1 mm. Two types of<br />
probe are used, as illustrated in figure 2. In the Kelvin probe,<br />
the electrode is vibrated vertically, changing the capacitance<br />
between probe <strong>and</strong> sample. In the Monroe probe, the electrode<br />
is fixed <strong>and</strong> a grounded shutter, mounted in front of the<br />
electrode, is vibrated horizontally, thereby modulating the<br />
probe to wafer capacitance. The difference in design makes<br />
Monroe probes less sensitive to external vibrations so that the<br />
measurement setup need not be vibration isolated. Both vibrate<br />
at frequencies of typically 500–600 Hz.<br />
The contact potential difference V cpd is determined by<br />
measuring the ac current [24]<br />
I = V cpd dC/dt (1)<br />
where C is the capacitance between the probe <strong>and</strong> the<br />
sample. The contact potential difference is determined by<br />
either calibrating the current versus the bias <strong>voltage</strong> V B ,or<br />
by adjusting V B until I = 0 in which case V B = V cpd . The<br />
former method is faster <strong>and</strong> is used for mapping purposes.<br />
I shall now address the issue of potential <strong>and</strong> reference<br />
potential. The energy or potential b<strong>and</strong> diagram of the probe–<br />
air–semiconductor system is shown in figure 3. Potentials<br />
are more appropriate than energy because it is the potential<br />
that is measured, not the energy. W M <strong>and</strong> W S are the metal<br />
<strong>and</strong> semiconductor work function potentials, i.e., potentials<br />
between the vacuum potential E vac /q <strong>and</strong> the Fermi potential<br />
φ F . E c <strong>and</strong> E v are the conduction b<strong>and</strong> <strong>and</strong> valence b<strong>and</strong><br />
energies <strong>and</strong> E c /q <strong>and</strong> E v /q their potentials. The potential of<br />
the intrinsic energy level in the neutral bulk semiconductor, φ,<br />
is taken as the reference potential. The semiconductor <strong>surface</strong><br />
potential φ S (φ S is φ at x = 0) is zero for flatb<strong>and</strong>, positive for<br />
depletion <strong>and</strong> inversion <strong>and</strong> negative for accumulation.<br />
The potential on the sample <strong>surface</strong> is the <strong>surface</strong><br />
<strong>voltage</strong> V S . For a bare sample V S = φ S , but for an oxidized<br />
wafer with charge in or on the oxide, V S ≠ φ S . The potential<br />
measured at the probe is the contact potential difference, also<br />
called the contact potential V cpd , which I shall denote as the<br />
probe potential V P from now on. All potentials are measured<br />
with respect to the grounded substrate. The probe <strong>voltage</strong> is<br />
the difference in Fermi potential between probe <strong>and</strong> substrate.<br />
First consider the bare, grounded p-type semiconductor in<br />
figure 3 with the metal probe placed a distance t air above the<br />
sample. The external nulling <strong>voltage</strong> V B ensures zero probe<br />
current <strong>and</strong> zero probe charge. There is no <strong>surface</strong> charge <strong>and</strong><br />
W M <strong>and</strong> W S are equal in this example in figure 3(a), leading<br />
to the work function difference W MS = W M − W S = 0. Later<br />
we will relax this simplification. The b<strong>and</strong> diagram is very<br />
similar to that of an MOS capacitor, with the oxide replaced<br />
by air. Next, positive charge of charge density Q (C cm −2 )<br />
is deposited on the semiconductor <strong>surface</strong> as in figure 3(b),<br />
inducing charge density Q S in the semiconductor. The dashed<br />
lines on the energy b<strong>and</strong> diagram pertain for zero charge <strong>and</strong><br />
the solid lines for charge density Q, inducing charge only<br />
in the semiconductor, not in the nulled probe. Hence, no<br />
electric field exists between the sample <strong>and</strong> the probe making<br />
V P = V S = φ S .<br />
The induced semiconductor charge density Q S , in the<br />
absence of an inversion layer, consists of ionized acceptors<br />
in the space-charge region (scr)<br />
Q =−Q S = qN A W (2)<br />
where W is the scr width <strong>and</strong> N A the acceptor density. To<br />
determine the <strong>surface</strong> <strong>voltage</strong>, we use the expression for W<br />
√<br />
W =<br />
Q 2K s ε 0 φ s<br />
= . (3)<br />
qN A qN A<br />
Solving for the <strong>surface</strong> potential φ S gives<br />
φ s =<br />
Q 2<br />
=<br />
(qN)2 = 9.07 × 10 −7 N 2<br />
(4)<br />
2K s ε 0 qN A 2K s ε 0 qN A K s N A<br />
where N is the <strong>surface</strong> charge atom density (cm −2 ). As an<br />
example, for a Si sample with N A = 10 16 cm −3 , K s = 11.7,<br />
<strong>and</strong> a <strong>surface</strong> charge atom density N = 10 11 cm −2 ,wefind<br />
φ S = 0.077 V.<br />
Many semiconductor samples that are characterized by SV<br />
or SPV techniques are oxidized <strong>and</strong> contain charges <strong>and</strong> work<br />
function differences. To underst<strong>and</strong> the effect of work function<br />
differences <strong>and</strong> charge density on <strong>surface</strong> <strong>voltage</strong>, we will first<br />
consider the simpler <strong>and</strong> well known MOS capacitor (MOS-C)<br />
in figure 4, containing work function difference W MS , positive<br />
oxide charge density ρ ox (C cm −3 ) distributed throughout the<br />
oxide, <strong>and</strong> a positive charge sheet Q 1 (C cm −2 )atx = x 1 . The<br />
gate <strong>voltage</strong> is given by [25]<br />
V G = V FB + V ox + φ s (5)<br />
where V ox is the potential across the oxide. The flatb<strong>and</strong><br />
<strong>voltage</strong> is given by<br />
V FB = W MS − x 1 Q 1<br />
− 1 ∫ tox<br />
x<br />
ρ ox dx (6)<br />
t ox C ox C ox 0 t ox<br />
where t ox is the oxide thickness.<br />
R18
<strong>Surface</strong> <strong>voltage</strong> <strong>and</strong> <strong>surface</strong> photo<strong>voltage</strong><br />
Probe<br />
φ s<br />
V s<br />
-<br />
V P<br />
p-type<br />
V P<br />
+<br />
+<br />
+<br />
Q Q S<br />
-<br />
-<br />
p-type<br />
t air<br />
E vac /q<br />
V,<br />
φ<br />
W M<br />
W S<br />
φ s<br />
E c /q<br />
φ = 0<br />
E v /q<br />
x<br />
φ F<br />
V P<br />
φ s<br />
= V s<br />
(a)<br />
(b)<br />
Figure 3. Cross section <strong>and</strong> b<strong>and</strong> diagram of a metal–air–semiconductor system with zero work function difference: (a) no <strong>surface</strong> charge,<br />
(b) with <strong>surface</strong> charge.<br />
V ox<br />
Q 1<br />
V G φ s<br />
V G<br />
+<br />
+ +<br />
+<br />
+<br />
ρ ox<br />
p-type<br />
0 x 1 t ox x<br />
(a)<br />
(b)<br />
Figure 4. (a) MOS capacitor cross section showing a charge sheet Q 1 at x = x 1 <strong>and</strong> uniform charge ρ ox throughout the oxide; (b) the<br />
corresponding b<strong>and</strong> diagram showing oxide <strong>and</strong> <strong>surface</strong> potentials.<br />
Let us now extend this example to a Kelvin probe held<br />
above a semiconductor covered with an insulator <strong>and</strong> a probe–<br />
semiconductor work function difference W MS leading to the<br />
negative probe potential V P = W MS in figure 5(a). Next<br />
consider oxide charge density ρ ox (C cm −3 ) <strong>and</strong> <strong>surface</strong> charge<br />
density Q (C cm −2 )asinfigure 5(b). These charges induce<br />
charge density qN A W in the semiconductor (indicated by the<br />
negative charges) <strong>and</strong> qn on the probe (indicated by the solid<br />
circles, representing electrons). The probe <strong>voltage</strong>, calculated<br />
with the same approach as used for MOS capacitors, is<br />
V P = V FB + V air + V ox + φ. (7)<br />
The flatb<strong>and</strong> <strong>voltage</strong> in this case is<br />
V FB = W MS − t air<br />
t equ<br />
Q<br />
C equ<br />
− 1<br />
C equ<br />
∫ tequ<br />
t air<br />
x<br />
t equ<br />
ρ ox dx (8)<br />
where C equ is the equivalent capacitance <strong>and</strong> t equ the equivalent<br />
thickness given by<br />
C equ =<br />
C airC ox<br />
C air + C ox<br />
= ε 0<br />
t equ<br />
t equ = t air + t ox /K ox . (9)<br />
Equations (7)–(9) show the probe <strong>voltage</strong> to be due to W MS ,<br />
Q <strong>and</strong> ρ ox . A single measurement is unable to distinguish<br />
between these three parameters.<br />
Next we will consider the effect of light on the sample. For<br />
simplicity, we will use the bare sample in figure 6. Figure 6(a)<br />
shows the b<strong>and</strong> diagram with <strong>surface</strong> charge density Q in<br />
the dark <strong>and</strong> in figure 6(b) the sample is strongly illuminated<br />
driving the semiconductor to the flatb<strong>and</strong> condition <strong>and</strong> the<br />
probe potential approaches zero. Hence by measuring the<br />
<strong>surface</strong> <strong>voltage</strong> without <strong>and</strong> with light, we obtain the <strong>surface</strong><br />
potential <strong>and</strong> hence the charge density from equation (4). To<br />
underst<strong>and</strong> how this comes about, we must look at the flatb<strong>and</strong><br />
condition in more detail.<br />
The semiconductor charge density Q S for a p-type<br />
semiconductor in depletion or inversion is<br />
Q S =− √ 2kT K s ε 0 n i F(U S ,K) (10)<br />
where F is the normalized <strong>surface</strong> electric field, defined as [26]<br />
F(U S ,K)= [K(e −US + U S − 1) + K −1 (e US − U S − 1)<br />
+K(e US +e −US − 2)] 1/2 . (11)<br />
In this expression K = p 0 /n i (p 0 is the majority carrier<br />
density <strong>and</strong> n i the intrinsic carrier density), U s = qφ s /kT<br />
is the normalized <strong>surface</strong> potential, φ s the <strong>surface</strong> potential<br />
<strong>and</strong> the normalized excess carrier density ( = p/p 0 ,<br />
where p = n is the excess carrier density). In the<br />
absence of excess carriers, i.e., in equilibrium, the last term<br />
in equation (11) vanishes.<br />
F is plotted versus φ s in figure 7 as a function of the<br />
normalized excess carrier density, produced by illuminating<br />
the device. The electric field is related to the charge density<br />
through equation (10). Constant charge implies constant<br />
R19
D K <strong>Schroder</strong><br />
Figure 5. (a) B<strong>and</strong> diagram for φ MS ≠ 0, but zero charges, (b) φ MS ≠ 0, Q ≠ 0 <strong>and</strong> ρ ox ≠ 0.<br />
V P<br />
+<br />
+<br />
+<br />
-<br />
-<br />
-<br />
p-type<br />
V P ≈ 0<br />
Light<br />
+<br />
+<br />
+<br />
p-type<br />
E Fn<br />
V P<br />
φ s<br />
E Fp<br />
E F<br />
(a)<br />
(b)<br />
Figure 6. (a) B<strong>and</strong> diagram with <strong>surface</strong> charge, (b) b<strong>and</strong> diagram with <strong>surface</strong> charge <strong>and</strong> strong illumination. The black circles represent<br />
electrons.<br />
with V ox given by<br />
F<br />
10 3<br />
10 2<br />
10 1<br />
100<br />
10<br />
1<br />
10 4 0 0.05 0.1 0.15<br />
∆ =0<br />
0.2<br />
Si, T=300 K<br />
V ox = Q/C ox =−Q S /C ox (13)<br />
where Q is the <strong>surface</strong> charge density <strong>and</strong> Q S the<br />
semiconductor charge density.<br />
The <strong>voltage</strong>s in the dark <strong>and</strong> under intense illumination<br />
(φ S → 0) are given by<br />
V P,dark = V FB + V air + Q/C ox + φ s<br />
φ s<br />
(V)<br />
Figure 7. Normalized <strong>surface</strong> electric field, F , function versus<br />
<strong>surface</strong> potential as a function of normalized excess carrier density<br />
or light intensity.<br />
electric field or constant F . Hence as n increases, the<br />
<strong>surface</strong> potential decreases, because the locus of the F –φ s<br />
plot is along a horizontal line such as the dashed line. It<br />
is obvious from figure 7 that the <strong>surface</strong> potential decreases<br />
with increasing light-generated excess carriers. In the limit<br />
of intense illumination, φ s → 0 <strong>and</strong> the semiconductor<br />
approaches flatb<strong>and</strong>.<br />
The probe potential is given by<br />
V P = V FB + V air + V ox + φ s (12)<br />
V P,light = V FB + V air + Q/C ox . (14)<br />
The charge density Q remains constant during the<br />
measurement, regardless of illumination, <strong>and</strong> the change in<br />
the <strong>surface</strong> <strong>voltage</strong> becomes<br />
5. Applications<br />
V P = V P,dark − V P,light ≈ φ s . (15)<br />
5.1. Minority carrier diffusion length<br />
A major application of SPV is the measurement of minority<br />
carrier diffusion length, even though the minority carrier<br />
diffusion length plays a negligible role in most integrated<br />
circuits (ICs) consisting of MOS devices. Then why measure<br />
the minority carrier diffusion length? The reason that minority<br />
R20
<strong>Surface</strong> <strong>voltage</strong> <strong>and</strong> <strong>surface</strong> photo<strong>voltage</strong><br />
Q Q S<br />
+ _ _<br />
+ _<br />
+<br />
(a)<br />
p-type<br />
E c<br />
V SPV<br />
E c<br />
E i<br />
Φ<br />
E Fn<br />
E i<br />
E F<br />
E v<br />
E Fp<br />
E F<br />
E v<br />
(b)<br />
(c)<br />
Figure 8. (a) Device cross section showing the <strong>surface</strong> charge density Q <strong>and</strong> the semiconductor charge density Q S , (b) the b<strong>and</strong> diagram in<br />
the dark <strong>and</strong> (c) the illuminated b<strong>and</strong> diagram.<br />
carrier lifetime/diffusion lengths are so commonly measured<br />
is that they provide information about the low defect densities<br />
consistent with today’s integrated circuits. No other technique<br />
can detect defect densities as low as 10 9 –10 11 cm −3 in a simple,<br />
contactless room temperature measurement. In contrast to<br />
analytical techniques whose signals are usually proportional<br />
to impurity density, lifetime <strong>and</strong> diffusion length are<br />
inversely proportional to impurity density. Hence, analytical<br />
technique signals decrease while lifetime/diffusion length<br />
signals increase with decreasing impurity density. Further, the<br />
availability of commercial, clean room compatible equipment<br />
makes these measurements relatively simple. It is for these<br />
reasons that the IC community has adopted lifetime/diffusion<br />
length measurements as a ‘process cleanliness monitor’. The<br />
introduction of corona charge has extended the applicability<br />
of <strong>surface</strong> <strong>voltage</strong>/photo<strong>voltage</strong> characterization to many other<br />
measurements, mentioned above.<br />
<strong>Surface</strong> photo<strong>voltage</strong> is an attractive diffusion length<br />
characterization technique, because it is nondestructive <strong>and</strong><br />
contactless, sample preparation is simple (no contacts,<br />
junctions, or high temperature processing required), it is<br />
a steady-state method <strong>and</strong> the equipment is commercially<br />
available. The concept of <strong>surface</strong> photo<strong>voltage</strong> can be<br />
understood with the b<strong>and</strong> diagram in figure 8. <strong>Surface</strong><br />
charge density Q induces an equivalent charge density in the<br />
semiconductor, Q S , with Q + Q S = 0 shown in figure 8(a).<br />
The semiconductor charge, in depletion, is provided by the<br />
ionized space charge density qN A W, neglecting electrons <strong>and</strong><br />
holes in the space-charge region. The b<strong>and</strong> diagram in the<br />
dark is shown in figure 8(b). When the sample is illuminated,<br />
the Fermi level splits into the quasi-Fermi levels E Fn <strong>and</strong> E Fp<br />
with the <strong>surface</strong> photo<strong>voltage</strong> equal to the splitting potential.<br />
The b<strong>and</strong> bending is reduced as in figure 8(c).<br />
The sample is assumed to be homogeneous <strong>and</strong> is of<br />
thickness d, as shown in figure 9. One <strong>surface</strong> is chemically<br />
treated to induce a <strong>surface</strong> space-charge region as described<br />
earlier. The wafer can be homogeneous, or it can be in the<br />
form of a pn junction or metal–semiconductor junction. We<br />
will only treat the homogeneous case here. The <strong>surface</strong> with the<br />
induced scr is uniformly illuminated by monochromatic light<br />
of energy higher than the b<strong>and</strong> gap, with the back <strong>surface</strong> kept<br />
in the dark. The light is chopped to enhance the signal/noise<br />
ratio using lock-in techniques. The wavelength is varied with<br />
a monochromator or a series of filters transmitting selected<br />
wavelengths.<br />
s r s 1<br />
Φ(λ)<br />
V P<br />
V SPV<br />
p-Type<br />
(τ n , D n , L n )<br />
0 W d x<br />
Figure 9. Sample for SPV measurements. The black circles<br />
represent electrons <strong>and</strong> the open circles represent holes.<br />
Electron–hole pairs (ehps) are generated in both the spacecharge<br />
region (scr) <strong>and</strong> in the p-substrate by absorbed photons.<br />
The ehps generated in the scr are very quickly separated by the<br />
electric field with the minority electrons drifting to the <strong>surface</strong>.<br />
Those minority carriers in the quasi-neutral substrate, within<br />
approximately a minority carrier diffusion length of the scr<br />
edge, diffuse <strong>and</strong> drift toward the <strong>surface</strong>, establishing a <strong>surface</strong><br />
potential or <strong>surface</strong> photo<strong>voltage</strong> relative to the grounded back<br />
<strong>surface</strong>. The <strong>surface</strong> photo<strong>voltage</strong> is proportional to the excess<br />
minority carrier density, n(W), at the edge of the scr, as<br />
described in more detail in appendix A. Light reaching the<br />
back <strong>surface</strong> produces an undesirable SPV signal that can be<br />
detected by its large amplitude, by a reversal in signal polarity<br />
over the SPV wavelength range or by a signal decrease with<br />
increasing illumination at the longer wavelengths.<br />
Equation (A4) in appendix A gives the excess carrier<br />
density. In principle, it is possible to extract the diffusion<br />
length L n from that expression for arbitrary W, d <strong>and</strong> α, the<br />
optical absorption coefficient. In practice this is difficult to<br />
do <strong>and</strong> several constraints are usually imposed on the sample<br />
to simplify data extraction. The undepleted wafer should<br />
be much thicker than the diffusion length <strong>and</strong> the scr width<br />
should be small compared to L n . The absorption coefficient<br />
should be sufficiently low for αW ≪ 1, but sufficiently high<br />
for α(d − W) ≫ 1. The diameter of the light should be<br />
larger than the sample thickness, allowing a one-dimensional<br />
analysis <strong>and</strong> low-level injection (excess carrier density (n)<br />
is lower than the majority carrier density p 0 ) should prevail.<br />
The assumptions<br />
d − W 4L n W ≪ L n αW ≪ 1<br />
α(d − W) ≫ 1 n ≪ p 0 (16)<br />
allow equation (A4) to be simplified to (see appendix A)<br />
(1 − R) L n<br />
n(W) ≈<br />
(s 1 + D n /L n ) (L n +1/α) . (17)<br />
R21
D K <strong>Schroder</strong><br />
As is obvious from the boundary condition in the detailed<br />
derivation in appendix A, s 1 is the <strong>surface</strong> recombination<br />
velocity at the edge of the space-charge region, i.e., at x = W ,<br />
not at the <strong>surface</strong>. The <strong>surface</strong> recombination velocity at the<br />
<strong>surface</strong> is s r as illustrated in figure 9.<br />
The excess carrier density at x = W is related to the<br />
<strong>surface</strong> <strong>voltage</strong> by the ‘law of the junction’ from pn junction<br />
theory<br />
n(W ) = n 0 (exp(qV S /kT) − 1) ≈ n 0 qV S /kT (18)<br />
for V S ≪ kT/q. The <strong>surface</strong> <strong>voltage</strong> is equal to the probe<br />
<strong>voltage</strong>, giving<br />
V P = kT (1 − R) L n<br />
q n 0 (s 1 + D n /L n ) (L n +1/α) . (19)<br />
The dimensions are shown approximately to scale in figure 10.<br />
Optically generated excess carriers diffuse <strong>and</strong> recombine.<br />
Because the electron <strong>and</strong> hole diffusion coefficients or<br />
mobilities differ, a Dember <strong>voltage</strong> is developed as a result<br />
of this mobility difference, given by [27]<br />
V b = kT (<br />
)<br />
(b − 1)<br />
q (b +1) ln (b +1)n<br />
1+ (20)<br />
n 0 + bp 0<br />
where b = µ n /µ p , with µ n <strong>and</strong> µ p the electron <strong>and</strong> hole<br />
mobilities. For p-type Si with b ≈ 3, p 0 ≫ n 0 <strong>and</strong> room<br />
temperature, equation (20) becomes<br />
(<br />
V b = 0.013 ln 1+ 4n )<br />
≈ 0.013 4n . (21)<br />
3p 0 3p 0<br />
With n/p 0 typically 10 −6 –10 −4 , V b ≈ 1.7 × 10 −8 –1.7<br />
×10 −6 V, a <strong>voltage</strong> that is low compared to the <strong>surface</strong><br />
photo<strong>voltage</strong> <strong>and</strong> is usually neglected.<br />
V S is proportional to n(W) for V S < 0.5kT/q. Typical<br />
<strong>surface</strong> photo<strong>voltage</strong>s are in the low millivolt range, ensuring<br />
a linear relationship. D n <strong>and</strong> L n are assumed to be constant<br />
<strong>and</strong> over a restricted wavelength range, the reflectivity R can<br />
also be considered constant for bare <strong>surface</strong>s. The <strong>surface</strong><br />
recombination velocity s 1 is usually unknown. However, if<br />
n(W ) is held constant during the measurement, the <strong>surface</strong><br />
potential is also constant, <strong>and</strong> s 1 can be considered reasonably<br />
constant. This leaves α <strong>and</strong> as the only variables.<br />
There are two implementations of the SPV method:<br />
(1) constant <strong>surface</strong> photo<strong>voltage</strong> <strong>and</strong> (2) constant photon flux<br />
density. In method (1), V P is held constant, implying n(W)<br />
is also constant. A series of different wavelengths is selected<br />
during the measurement with each wavelength providing a<br />
different α. The photon flux density is adjusted for each<br />
wavelength to hold V P constant, allowing equation (19) to be<br />
written as<br />
= n 0V P (s 1 + D n /L n ) (L n +1/α)<br />
= C 1 (L n +1/α) (22)<br />
(kT /q)(1 − R) L n<br />
where C 1 is a constant.<br />
Then is plotted against 1/α for constant V P . The<br />
result is a line whose extrapolated intercept on the negative<br />
1/α axis ( = 0) is the minority carrier diffusion length L n ,<br />
as shown in figure 11(a). The slope of such a plot is C 1 ,<br />
containing the <strong>surface</strong> recombination velocity s 1 . While it<br />
W ≈ 0.5 µm<br />
1/α (λ = 0.8 µm)<br />
1/α (λ = 1.04 µm)<br />
L n<br />
(τ r<br />
= 100 µs)<br />
0 100 200 300 400 500 600 700 x (µm)<br />
Figure 10. Cross section showing the various lengths for a 675 µm<br />
thick p-type wafer.<br />
Φ (normalized)<br />
1/V P<br />
(normalized)<br />
1<br />
0.8<br />
0.6<br />
0.4<br />
L n<br />
0.2<br />
s 1<br />
= 1000 cm/s<br />
0<br />
-50 0 50 100 150 200<br />
1<br />
0.8<br />
0.6<br />
0.4<br />
0.2<br />
L n<br />
1/α (µm)<br />
(a)<br />
s 1<br />
= 1000 cm/s<br />
0<br />
-50 0 50 100 150 200<br />
1/α (µm)<br />
Figure 11. Normalized SPV plots for (a) constant <strong>surface</strong><br />
photo<strong>voltage</strong> (theory) <strong>and</strong> (b) constant photon flux density (points:<br />
data, lines: theory).<br />
(b)<br />
is difficult to extract s 1 from the other parameters contained in<br />
C 1 , it is possible to observe changes in s 1 by comparing SPV<br />
plots before <strong>and</strong> after a <strong>surface</strong> treatment that changes <strong>surface</strong><br />
recombination.<br />
For the constant photon flux density implementation, we<br />
write equation (19) as<br />
1<br />
= n 0(s 1 + D n /L n ) (L n +1/α)<br />
= C 2 (L n +1/α) (23)<br />
V P (kT /q)(1 − R) L n<br />
where C 2 is a constant. A plot of 1/V P (normalized) versus<br />
1/α gives L n as illustrated in figure 11(b), where both<br />
experimental data <strong>and</strong> theory are shown. V P changes during<br />
the measurement, hence <strong>surface</strong> recombination may vary<br />
during the measurement. However, the <strong>surface</strong> photo<strong>voltage</strong><br />
variation is small <strong>and</strong> variations in <strong>surface</strong> recombination<br />
velocity are likely to be negligible.<br />
The condition W ≪ L n is generally satisfied for singlecrystal<br />
Si, but not necessarily for other semiconductors. For<br />
example, the diffusion length in GaAs is often only a few<br />
microns because radiative recombination dominates. Hence,<br />
diffusion length measurements, primarily used for Si to<br />
determine recombination centre densities, are less important<br />
R22
<strong>Surface</strong> <strong>voltage</strong> <strong>and</strong> <strong>surface</strong> photo<strong>voltage</strong><br />
in GaAs. In amorphous Si L n is even shorter. In such a<br />
situation the intercept is given by [28]<br />
(<br />
1<br />
α =−L (W/L n ) 2 )<br />
n 1+<br />
. (24)<br />
2(1+W/L n )<br />
For W ≫ L n the 1/α intercept is −W/2, independent of the<br />
diffusion length. For W = L n the intercept becomes −5L n /4.<br />
The scr width can be reduced by shining steady-state light onto<br />
the device.<br />
What role does <strong>surface</strong> recombination play in diffusion<br />
length measurements? To answer this question, we have<br />
to look at the dependence of the recombination lifetime on<br />
bulk <strong>and</strong> <strong>surface</strong> recombination. The effective recombination<br />
lifetime is [29]<br />
1<br />
= 1 + 1 (25)<br />
τ eff τ B τ S<br />
with the bulk lifetime τ B <strong>and</strong> the <strong>surface</strong> lifetime τ S given by<br />
τ B = τ p(n 0 + n 1 + n) + τ n (p 0 + p 1 + p)<br />
p 0 + n 0 + n<br />
τ S = d<br />
2s r<br />
(26)<br />
where n 0 <strong>and</strong> p 0 are the equilibrium carrier densities, p the<br />
excess carrier density, d the sample thickness, s r the <strong>surface</strong><br />
recombination velocity <strong>and</strong><br />
τ p =<br />
1<br />
σ p ν th N T<br />
τ n =<br />
1<br />
σ n ν th N T<br />
n 1 = n i e (ET −Ei)/kT p 1 = n i e −(ET −Ei)/kT (27)<br />
with σ p <strong>and</strong> σ n the hole <strong>and</strong> electron capture cross sections,<br />
v th the thermal velocity, N T the impurity density <strong>and</strong> E T the<br />
energy level of the impurity. The τ S term in equation (26) is<br />
valid for s r
D K <strong>Schroder</strong><br />
(a)<br />
L n (µm)<br />
L n (µm)<br />
5.2. Lifetime<br />
Two types of lifetime are measured in Si wafers: the<br />
recombination lifetime, τ r , <strong>and</strong> the generation lifetime, τ g [29].<br />
As the name implies, the recombination lifetime characterizes<br />
the recombination of ehps, while the generation lifetime<br />
characterizes the generation of ehps. The recombination<br />
lifetime is determined by depositing sufficient charge on an<br />
oxidized wafer to invert the semiconductor <strong>surface</strong> forming a<br />
field-induced np junction in a p-type substrate. A brief light<br />
pulse forward biases this np junction, injecting excess carriers<br />
that subsequently recombine. The resulting time-dependent<br />
<strong>surface</strong> <strong>voltage</strong> is monitored with a Kelvin probe. This method<br />
is very similar to the open-circuit <strong>voltage</strong> decay technique. τ r is<br />
determined from the equation [37]<br />
τ r =<br />
kT/q<br />
dV p /dt . (30)<br />
(b)<br />
N Fe (x10 11 cm -3 )<br />
(c)<br />
Figure 15. Diffusion length maps (a) before, (b) after Fe–B pair<br />
dissociation; (c) iron density map (in units of 10 11 cm −3 ). Courtesy<br />
of P Edelman <strong>and</strong> J Lagowski, Semiconductor Diagnostics, Inc.<br />
those of Fe–B. By measuring the diffusion length before (L ni )<br />
<strong>and</strong> after (L nf ) Fe–B pair dissociation, the iron density N Fe is<br />
obtained from the expression [34]<br />
N Fe = 1.05 × 10 16 ( 1<br />
L 2 nf<br />
− 1 )<br />
L 2 cm −3 (29)<br />
ni<br />
with diffusion lengths in units of µm. The Fe i <strong>and</strong> Fe–B<br />
diffusion lengths as a function of Fe density are shown in<br />
figure 14 [35]. This large difference in diffusion length<br />
between Fe i <strong>and</strong> Fe–B only pertains at low injection levels<br />
<strong>and</strong> disappears at medium to high injection levels. Maps of<br />
diffusion lengths before <strong>and</strong> after Fe–B pair dissociation <strong>and</strong><br />
the resultant Fe density are shown in figure 15. Metals rarely<br />
pair with impurities in n-type Si, although Cu does form such<br />
pairs [36].<br />
The generation lifetime is determined by depositing a charge<br />
pulse driving the corona–oxide–semiconductor (COS) device<br />
into deep depletion. Electron–hole pairs are subsequently<br />
generated <strong>and</strong> the resulting <strong>voltage</strong> transient is monitored<br />
with a contactless Kelvin probe [23]. These two methods<br />
were recently used to characterize both epitaxial films <strong>and</strong><br />
their substrates [38]. The epitaxial layer is characterized<br />
through τ g measurements, with the thermal carrier generation<br />
confined to the charge-induced space-charge region, which is<br />
typically of the order of 1 µm below the semiconductor <strong>surface</strong>.<br />
The recombination lifetime, on the other h<strong>and</strong>, characterizes<br />
a depth determined by the minority carrier diffusion<br />
length. Figure 16 illustrates corona-induced generation <strong>and</strong><br />
recombination lifetime measurements of n-epitaxial layers on<br />
n-substrates. Figure 16(a) shows the results for both ‘good’<br />
layer <strong>and</strong> ‘good’ substrate with τ g ≈ 4 ms <strong>and</strong> τ r ≈ 300 µs.<br />
Figure 16(b) shows a ‘good’ epitaxial layer (τ g ≈ 3ms),<br />
but the substrate is contaminated, reducing the recombination<br />
lifetime to about 50 µs. While recombination lifetime<br />
measurements can be made without corona charge, using<br />
conventional <strong>surface</strong> photo<strong>voltage</strong> or photoconductance decay<br />
measurements, contactless generation lifetime measurements<br />
require corona charge.<br />
5.3. Charge<br />
The <strong>surface</strong> <strong>voltage</strong> dependence on <strong>surface</strong> charge lends itself<br />
to measurements of charge in the insulator on a semiconductor<br />
wafer or charge on the wafer. This charge can be oxide charge,<br />
interface trapped charge plasma damage charge, or other<br />
charge. Let us illustrate this by considering the mobile charge<br />
density Q m in an oxidized wafer [39]. Such mobile charge<br />
in silicon technology is most commonly sodium, originating<br />
from such sources as humans, chemicals, equipment etc.<br />
Other possible mobile charges are potassium, associated<br />
with chemical polishing compounds, <strong>and</strong> lithium, which can<br />
originate from pump oils.<br />
One way to measure such a mobile charge is to<br />
combine SV measurements with corona charge techniques<br />
by depositing corona charge on an oxidized semiconductor<br />
<strong>surface</strong>. First deposit positive corona charge, then heat the<br />
wafer to a moderate temperature of around 200 ◦ Cforafew<br />
R24
<strong>Surface</strong> <strong>voltage</strong> <strong>and</strong> <strong>surface</strong> photo<strong>voltage</strong><br />
τ g<br />
τ g<br />
, τ r (µ s)<br />
10 3<br />
10 2<br />
10 1<br />
10 4 τ r<br />
Good epi/good substrate<br />
0 1 2 3 4 5 6<br />
Wafer Site<br />
(a)<br />
τ g<br />
τ g<br />
, τ r (µ s)<br />
10 4 0 1 2 3 4 5 6<br />
10 3<br />
10 2<br />
τ r<br />
(a)<br />
10 1<br />
Good epi/poor substrate<br />
Wafer Site<br />
Figure 16. Corona charge-induced generation <strong>and</strong> recombination<br />
data for (a) good epitaxial layer <strong>and</strong> substrate, <strong>and</strong> (b) good epitaxial<br />
layer <strong>and</strong> poor substrate. Data after [38].<br />
minutes, driving the mobile charge to the oxide–semiconductor<br />
interface. Cool the sample <strong>and</strong> determine the flatb<strong>and</strong><br />
<strong>voltage</strong> V FB1 . Next repeat the procedure with a negative corona<br />
charge <strong>and</strong> drive the mobile charge to the oxide–air interface<br />
determining V FB2 . From equation (8), Q m is then determined<br />
by the flatb<strong>and</strong> <strong>voltage</strong> difference V FB = V FB2 − V FB1<br />
through the relation<br />
(b)<br />
Q m = C ox V FB . (31)<br />
Unless the oxide is heavily contaminated, the flatb<strong>and</strong> <strong>voltage</strong><br />
difference V FB is likely to be very small for today’s thin gate<br />
oxides.<br />
The sensitivity of the measurement can be enhanced by<br />
decreasing the oxide capacitance through thicker oxides, but<br />
that is inconsistent with today’s thin gate oxides. The problem<br />
is illustrated in equation (6). The flatb<strong>and</strong> <strong>voltage</strong> due to<br />
oxide charge density ρ ox alone is V FB = −ρ ox tox 2 /2K oxε 0 .<br />
For a charge density of ρ ox t ox /q = 10 10 cm −2 , we find<br />
V FB = −2.3 × 10 3 t ox . For example, for t ox = 10 nm,<br />
V FB = −2.3 mV, illustrating that <strong>voltage</strong> measurements<br />
become impractical for thin oxides. A solution to this problem<br />
is to take an oxidized wafer <strong>and</strong> measure the <strong>surface</strong> potential.<br />
We showed earlier that the <strong>surface</strong> potential can be obtained by<br />
<strong>surface</strong> <strong>voltage</strong> measurements without <strong>and</strong> with intense light.<br />
Then deposit corona charge until the <strong>surface</strong> potential becomes<br />
zero. The deposited corona charge is then equal in magnitude<br />
but opposite in sign to the original oxide charge [40]. The<br />
accuracy <strong>and</strong> precision of this charge-based measurement is<br />
identical for thin <strong>and</strong> thick oxides.<br />
13.5 4.1 3.7 13.5<br />
13.9 13.9 4.1 4.4 6.1 3.7 4.1 13.5<br />
13.9 3.7 4.4 4.7 13.9 13.9 4.4 4.4 3.0 13.5<br />
4.7 5.1 4.4 13.9 13.9 13.9 13.9 13.5 4.1 3.4<br />
4.1 4.4 3.4 13.9 13.9 13.5 13.9 13.9 13.9 13.5 4.7 4.4<br />
13.9 13.9 13.9 13.9 13.9 13.9 13.5 13.5 13.9 13.9 13.9 13.5<br />
13.9 13.9 13.9 13.9 13.9 13.5 13.9 13.9 13.9 13.9 13.5 13.9<br />
4.1 13.9 13.9 13.9 13.9 13.9 13.9 13.9 13.9 13.9 13.9 13.9<br />
3.4 4.1 14.2 14.2 13.9 14.2 13.9 13.9 14.2 3.4<br />
14.2 4.1 4.1 4.4 7.1 14.2 3.7 4.4 5.4 4.1<br />
13.9 4.4 4.7 4.7 4.7 5.1 3.4 3.4<br />
13.9 14.2 14.2 14.2<br />
Figure 17. Plasma damage contour maps measured by (a) corona<br />
charge <strong>and</strong> (b) MOSFET antenna structures. Courtesy of<br />
S Weinzierl, KLA-Tencor.<br />
(b)<br />
Other charges that have been determined with SV<br />
measurements are plasma-induced charge <strong>and</strong> damage [41]. A<br />
map of plasma charge density is shown in figure 17. Another<br />
interesting application is the study of hydrogen-stabilized<br />
silicon <strong>surface</strong>s. Here Si <strong>surface</strong>s were exposed to two<br />
hydrogen treatments: annealing in hydrogen or immersing<br />
in HF [41]. Hydrogen-annealed <strong>surface</strong>s were more stable,<br />
determined by measuring the <strong>surface</strong> barrier as a function of<br />
time. The measurement of oxide charge in buried oxides of<br />
silicon-on-insulator materials is also feasible [42].<br />
5.4. Oxide thickness<br />
Corona charge density Q is deposited on the oxidized wafer<br />
<strong>and</strong> the <strong>surface</strong> <strong>voltage</strong> in the dark <strong>and</strong> under intense light<br />
are measured [43]. According to equation (15) this gives the<br />
<strong>surface</strong> potential φ S , which is then plotted as a function of<br />
deposited charge density as shown in figure 18 [44]. When the<br />
R25
D K <strong>Schroder</strong><br />
φ s<br />
(V)<br />
1<br />
0.5<br />
0<br />
-0.5<br />
t ox<br />
= 9.2 nm<br />
Depletion<br />
Accumulation<br />
-1<br />
-1.5 10 -7 0 1.5 10 -7<br />
Q (C/cm 2 )<br />
Inversion<br />
Figure 18. <strong>Surface</strong> potential versus charge showing the various<br />
regions of the device. t ox = 9.2 nm. After Roy et al [43].<br />
device is biased into accumulation or inversion, the oxide<br />
thickness is given by<br />
C ox = dQ t ox = K oxε 0<br />
. (32)<br />
dφ s C ox<br />
This method is not subject to the poly-Si gate depletion effects<br />
that affect conventional MOS-C measurements [45]. It is also<br />
not affected by probe punchthrough <strong>and</strong> is relatively insensitive<br />
to oxide pinhole leakage currents. Repeatability of 0.01 nm<br />
has been demonstrated for 1.8 nm thick oxides [40].<br />
5.5. Oxide leakage current<br />
To determine oxide leakage current, usually known as gate<br />
current in MOS devices, corona charge is deposited on the<br />
<strong>surface</strong> of an oxidized wafer <strong>and</strong> the <strong>surface</strong> <strong>voltage</strong> is<br />
measured as a function of time. The device is biased into<br />
accumulation or inversion <strong>and</strong> the oxide leakage current is<br />
related to the <strong>voltage</strong> through the relationship [46]<br />
I leak = C ox<br />
dV P<br />
dt<br />
⇒ V P (t) = I leak<br />
C ox<br />
t. (33)<br />
When the charge density is too high, the charge leaks very<br />
rapidly through the oxide by Fowler–Nordheim or direct<br />
tunnelling <strong>and</strong> the <strong>surface</strong> <strong>voltage</strong> is clamped.<br />
The deposited charge density is related to the oxide electric<br />
field E ox through the relationship<br />
Q = K ox ε 0 E ox = 3.45 × 10 −13 E ox (34)<br />
for SiO 2 . Silicon dioxide breaks down at electric fields of<br />
10–14 MV cm −1 .ForE ox = 12 MV cm −1 ,wefind the charge<br />
to be 4.1 × 10 −6 Ccm −2 . Figure 19 is a plot of E ox versus Q,<br />
clearly showing the electric field saturation at a charge density<br />
of around 4.4 × 10 −6 Ccm −2 .<br />
6. Frequency-dependent <strong>surface</strong> photo<strong>voltage</strong><br />
Most SPV measurements are made under dc conditions. It may<br />
be that the incident light is chopped at a moderate frequency<br />
(typically 500–600 Hz) for signal/noise enhancement through<br />
lock-in techniques. However, there is information to be gained<br />
by using ac-modulated incident light. For example, using<br />
frequency-modulated light as the excitation source eliminates<br />
the need to vibrate the Kelvin probe. The requirements on the<br />
E ox (MV/cm)<br />
0<br />
-3<br />
Accumulation<br />
-6<br />
Tunnel<br />
-9 Regime<br />
t ox<br />
= 12 nm<br />
-12<br />
-6 10 -6 -4 10 -6 -2 10 -6 0<br />
Q (C/cm 2 )<br />
Figure 19. Oxide electric field versus <strong>surface</strong> charge for an oxidized<br />
Si wafer. t ox = 12 nm. After Roy et al [43].<br />
back contact can also be relaxed with a suitable capacitive<br />
contact. As shown in appendix B, under such conditions,<br />
the frequency-dependent minority carrier diffusion length<br />
becomes<br />
L n0<br />
L n (ω) = √ (35)<br />
1+jωτr<br />
with L n0 the low-frequency value. The <strong>surface</strong> photo<strong>voltage</strong> is<br />
measured versus the sinusoidally modulated input frequency.<br />
The SPV equation becomes<br />
V P (ω) = kT (1 − R) L n (ω)<br />
(36)<br />
q n 0 (s 1 + D n /L n (ω)) (L n (ω) +1/α)<br />
with the frequency-dependent diffusion length L n (ω) given by<br />
equation (35).<br />
Nakhmanson originally put forth the theory for frequencydependent<br />
SPV measurements [10]. It was later implemented<br />
by Munakata et al who proposed [47] <strong>and</strong> later implemented<br />
it with a flying spot scanner incorporating both blue <strong>and</strong><br />
infrared light sources [48]. The blue light, absorbed near<br />
the <strong>surface</strong>, mainly characterizes the semiconductor near the<br />
<strong>surface</strong>, while the infrared light probes deeper into the wafer.<br />
By scanning the light beam, wafer maps can be generated<br />
in a few minutes. The <strong>surface</strong> photo<strong>voltage</strong> depends on the<br />
semiconductor b<strong>and</strong> bending, which depends on the <strong>surface</strong><br />
charge density. Hence ac SPV measurements lend themselves<br />
to <strong>surface</strong> charge density measurements [49].<br />
In another version of ac SPV, the semiconductor <strong>surface</strong><br />
is depleted/inverted by chemically induced <strong>surface</strong> charges<br />
<strong>and</strong> a sinusoidally modulated, low-intensity light generates<br />
excess carriers. The carrier lifetime is determined from the<br />
ratio of the real <strong>and</strong> imaginary SPV signals. Short-wavelength<br />
light (λ = 0.4 µm) with high absorption coefficient ensures<br />
carrier generation near the <strong>surface</strong>. Hence, the measured<br />
lifetime is primarily determined by the oxide–semiconductor<br />
interface, i.e., <strong>surface</strong> recombination, <strong>and</strong> is sometimes termed<br />
the ‘<strong>surface</strong> lifetime’ [50].<br />
In another commercial version, an oxidized wafer is<br />
biased into inversion with pulsed light incident on the sample.<br />
Optically generated minority carriers add to the inversion<br />
charge, reducing the <strong>surface</strong> potential <strong>and</strong> space-charge region<br />
width. The measured current I signal contains the relevant<br />
parameters [51]. The slope of the I signal / versus plot gives<br />
the <strong>surface</strong> lifetime. The signal also contains the substrate<br />
doping density or resistivity, leading to contactless resistivity<br />
R26
<strong>Surface</strong> <strong>voltage</strong> <strong>and</strong> <strong>surface</strong> photo<strong>voltage</strong><br />
(a)<br />
(b)<br />
1100<br />
1000<br />
900<br />
5.6<br />
5.4<br />
5.1<br />
Figure 20. Resistivity maps of epitaxial layers determined by ac SV<br />
measurements. The values are in ohm cm. The black peripheral ring<br />
in (a) is low resistivity (
D K <strong>Schroder</strong><br />
Φ (photons/sÂP 2 )<br />
4 10 9<br />
3 10 9<br />
L n<br />
=100 µm<br />
200 150<br />
2 10 9<br />
300<br />
500<br />
1 10 9<br />
1000<br />
0<br />
-400 -200 0 200 400<br />
1/α (µm)<br />
(a)<br />
1/Φ (photons/sÂP 2 ) -1<br />
2 10 -9 L n =1000 µm<br />
500<br />
1 10 -9<br />
200<br />
0<br />
0 250 500 750 1000<br />
1/α (µm)<br />
(b)<br />
Figure 21. Constant <strong>voltage</strong> SPV plots of exact equation <strong>and</strong> approximation. (a) versus 1/α <strong>and</strong> (b) 1/ versus 1/α. The solid lines are<br />
the exact calculations (equation (A4)) <strong>and</strong> the dashed lines are the extrapolations. s 1 = 10 4 cm s −1 , s 2 = 10 4 cm s −1 , D n = 30 cm 2 s −1 ,<br />
V P = 10 mV, R = 0.3, n 0 = 10 5 cm −3 <strong>and</strong> d = 500 µm.<br />
light beam, a 1500 µm diffusion length would be measured<br />
as 675 µm <strong>and</strong> a 750 µm diffusion length would be measured<br />
as 525 µm. For d light − d probe ≈ 2L n,real , the error becomes<br />
insignificant [60].<br />
8.3. Reflectivity<br />
The light intensity transmitted into the sample depends on<br />
the reflectivity. The reflectivity for bare wafers is reasonably<br />
constant with wavelength. However, for oxidized wafers R<br />
depends on insulator film thickness <strong>and</strong> on wavelength. Hence<br />
the effective photon flux density, eff = (1 − R), must<br />
be known for correct interpretation of SPV diffusion length<br />
measurements.<br />
8.4. Temperature<br />
Temperature causes α to change because the semiconductor<br />
b<strong>and</strong> gap is temperature dependent. Higher measurement<br />
temperature leads to lower b<strong>and</strong> gap <strong>and</strong> higher α. Hence,<br />
if the measurement temperature is higher than the usual<br />
room temperature, the value of L n extracted from such<br />
SPV measurements will be too high due to the temperature<br />
dependence of the absorption coefficient.<br />
8.5. Trapping<br />
Trapping centres in the semiconductor capture carriers <strong>and</strong> then<br />
release them back to the b<strong>and</strong> from which they were captured.<br />
Excess ehps are generated by light. Instead of recombining<br />
directly, some electrons are temporarily captured or trapped.<br />
They are subsequently re-emitted into the conduction b<strong>and</strong>,<br />
<strong>and</strong> finally recombine with the holes. Clearly the electrons<br />
‘live’ longer in this case by the length of time that they are<br />
trapped, <strong>and</strong> diffusion length measurements give erroneously<br />
high values.<br />
Trapping is detected in SPV measurements, for example,<br />
by a diffusion length dependence on photon flux density<br />
[61] <strong>and</strong> can be much reduced by illuminating the sample<br />
with a steady-state background light. The light continually<br />
creates ehps, keeping the traps filled, <strong>and</strong> additional ehps will<br />
recombine with reduced trapping.<br />
9. Summary<br />
<strong>Surface</strong> <strong>voltage</strong> <strong>and</strong> <strong>surface</strong> photo<strong>voltage</strong> measurements are<br />
the topic of this review. After a brief history, tracing the<br />
basic technique to 1953, the theory of these techniques is<br />
developed. In order for a <strong>surface</strong> <strong>voltage</strong> to exist, it is necessary<br />
to deposit charge on the sample by some means. This is most<br />
commonly done by rinsing the sample in certain solutions or<br />
depositing corona charge on it. Rinsing is usually done on bare<br />
samples <strong>and</strong> corona charge is deposited on samples covered<br />
by insulators. The use of these contactless measurement<br />
techniques has broadened from initial application of minority<br />
carrier diffusion length measurements to a wide variety of<br />
semiconductor characterization, including <strong>surface</strong> <strong>voltage</strong>,<br />
<strong>surface</strong> barrier height, flatb<strong>and</strong> <strong>voltage</strong>, oxide thickness, oxide<br />
charge density, interface trap density, mobile charge density,<br />
oxide integrity, generation lifetime, recombination lifetime <strong>and</strong><br />
doping density. It is likely that this range of application will<br />
broaden further. As with all characterization techniques, there<br />
are limitations <strong>and</strong> some of these are also discussed. I have<br />
chosen to give detailed derivations of the necessary concepts,<br />
including liberal use of b<strong>and</strong> diagrams, because this aspect of<br />
the technique is rarely discussed in the published literature.<br />
Acknowledgments<br />
The research leading to this paper was partially funded<br />
by the Silicon Wafer Engineering <strong>and</strong> Defect Science<br />
Consortium (SiWEDS) (Intel, Komatsu Electronic Metals,<br />
MEMC Electronic Materials, Mitsubishi Silicon, Okmetic,<br />
Nippon Steel, SEH America, Sumitomo Sitix Silicon, Texas<br />
Instruments, <strong>and</strong> Wacker Siltronic Corp.). I wish to thank them<br />
for their support. I also wish to thank the anonymous reviewer<br />
for a thorough review <strong>and</strong> for thoughtful comments, allowing<br />
the manuscript to be improved.<br />
Appendix A. DC excitation<br />
We first consider the p-type semiconductor of figure A1(a).<br />
It is a wafer of thickness d, reflectivity R, minority carrier<br />
lifetime τ, minority carrier diffusion coefficient D, minority<br />
carrier diffusion length L <strong>and</strong> <strong>surface</strong> recombination velocities<br />
s 1 <strong>and</strong> s 2 at the front <strong>and</strong> back <strong>surface</strong>s. Monochromatic light of<br />
R28
<strong>Surface</strong> <strong>voltage</strong> <strong>and</strong> <strong>surface</strong> photo<strong>voltage</strong><br />
R<br />
Φ(λ)<br />
s 1 s 2<br />
p-Type<br />
τ, D, L<br />
0 d x<br />
(a)<br />
R<br />
Φ(λ)<br />
s 1 s 2<br />
p-Type<br />
τ, D, L<br />
∆n(W)<br />
0 W d x<br />
(b)<br />
Figure A1. Homogeneous p-type sample geometry with optical<br />
excitation: (a) neutral, (b) with <strong>surface</strong>-induced space-charge region.<br />
photon flux density , wavelength λ <strong>and</strong> absorption coefficient<br />
α is incident on one side of this wafer. We assume that carriers<br />
generated by absorbed photons diffuse in the x-direction <strong>and</strong><br />
that the wafer has infinite extent in the y–z-plane, allowing the<br />
neglect of edge effects. The steady state, small-signal excess<br />
minority carrier density n(x) is obtained from a solution of<br />
the one-dimensional continuity equation<br />
D d2 n(x)<br />
dx 2<br />
− n(x)<br />
τ<br />
subject to the boundary conditions<br />
+ G(x) = 0 (A1)<br />
x = 0: dn(x) n(0)<br />
= s 1<br />
dx x=0 D<br />
<strong>and</strong><br />
x = d: dn(x) n(d)<br />
=−s 2<br />
dx x=d D . (A2)<br />
The electric field in the semiconductor sample is low <strong>and</strong><br />
is neglected for simplicity. The generation rate is given by<br />
G(x, λ) = (λ)α(λ)[1 − R(λ)]exp(−α(λ)x).<br />
(A3)<br />
An implicit assumption in this expression is that each<br />
absorbed photon generates one ehp. This is usually a good<br />
assumption for semiconductors.<br />
The solution to equation (A1) using (A2) <strong>and</strong> (A3) is [62]<br />
{[ ( )<br />
(1 − R)ατ<br />
d − x<br />
n(x) = K<br />
(α 2 L 2 1 sinh<br />
− 1)<br />
L<br />
( ) [ ( d − x<br />
x<br />
+K 2 cosh +e −αd K 3 sinh<br />
L<br />
L)<br />
( )]][( x s1 s 2 L<br />
+K 4 cosh<br />
L D<br />
+ D ) ( d<br />
sinh<br />
L L)<br />
( d −1 }<br />
+(s 1 + s 2 ) cosh − e<br />
L)] −αx (A4)<br />
where<br />
K 1 = s 1s 2 L<br />
D + s 2αL K 2 = s 1 + αD<br />
K 3 = s 1s 2 L<br />
D − s 1αL K 4 = s 2 − αD.<br />
For SPV measurements, a <strong>surface</strong> charge induced spacecharge<br />
region of width W exists as shown in figure A1(b). The<br />
light generates excess carriers <strong>and</strong> it is well known from pn<br />
junction theory (law of the junction) that the excess carrier<br />
density at the scr edge is related to the resulting <strong>surface</strong><br />
<strong>voltage</strong> V S through the relation [25]<br />
n(W) = n 0 (exp(qV S /kT) − 1) ≈ n 0 qV S /kT<br />
(A5)<br />
where n 0 is the equilibrium minority carrier density. The<br />
approximation in equation (A5) holds for V S ≪ kT/q.<br />
To determine the <strong>surface</strong> <strong>voltage</strong>, we need an expression<br />
for n(W). Forx = W, equation (A4) becomes<br />
{[ ( ) ( )<br />
d − W<br />
d − W<br />
n(W) = A K 1 sinh + K 2 cosh<br />
L<br />
L<br />
( ) ( )]]<br />
W W<br />
+e<br />
[K −αd 3 sinh + K 4 cosh<br />
L L<br />
[(<br />
s1 s 2 L<br />
×<br />
D<br />
+ D ) ( ( d d −1<br />
sinh + (s 1 + s 2 ) cosh<br />
L L)<br />
L)]<br />
}<br />
−e −αW (A6)<br />
with A = (1 − R)ατ/(α 2 L 2 − 1). Let us now examine the<br />
various assumptions that are made for the simplified equation<br />
usually used to analyse SPV data. The space-charge region<br />
width W is usually much smaller than the wafer thickness d,<br />
hence d −W ≈ d. Assumption (i): d −W ≫ L, i.e., the wafer<br />
is much thicker than the minority carrier diffusion length. This<br />
allows equation (A6) to be written as<br />
{[ [ ( ) ( )]<br />
W W<br />
n(W) = A (K 1 + K 2 ) cosh − sinh<br />
L L<br />
( ) ( )]/ ]<br />
W W<br />
+e<br />
[K −αd 3 sinh + K 4 cosh cosh(d/L)<br />
L L<br />
[<br />
s1 s 2 L<br />
×<br />
D + D ] −1 }<br />
L + s 1 + s 2 − e −αW . (A7)<br />
For W ≪ L <strong>and</strong> α(d − W) ≈ αd ≫ 1, we have<br />
{( [<br />
(1 − R)ατ<br />
n(W) = (K<br />
(α 2 L 2 1 + K 2 ) 1 − W ])<br />
− 1)<br />
L<br />
(<br />
s1 s 2 L<br />
×<br />
D + D ) −1 }<br />
L + s 1 + s 2 − e −αW . (A8)<br />
The assumption αW ≪ 1 leads to<br />
{[(<br />
(1 − R)αL<br />
n(W) = s<br />
(α 2 L 2 2 + D ) (<br />
(αL − 1) 1+ s )]<br />
1W<br />
− 1) L<br />
D<br />
[<br />
× s 2 s 1 + D ( )] D −1 }<br />
L L + s 1 + s 2<br />
{[(<br />
(1 − R)αL<br />
= 1+ D )(<br />
1+ s )]<br />
1W<br />
(αL +1) s 2 L D<br />
[<br />
× s 1 + D (<br />
1+ D<br />
L s 2 L + s )] −1 }<br />
1<br />
. (A9)<br />
s 2<br />
If we assume the back contact to have very high <strong>surface</strong><br />
recombination, i.e., s 2 →∞, equation (A9) becomes<br />
n(W) =<br />
(1 − R)αL<br />
(αL +1)<br />
( 1+s1 W/D<br />
s 1 + D/L<br />
The term s 1 W/D is usually ≪1, leading to<br />
(1 − R) αL<br />
n(W) =<br />
(s 1 + D/L) (1+αL)<br />
which is the desired result.<br />
)<br />
. (A10)<br />
(A11)<br />
R29
D K <strong>Schroder</strong><br />
Appendix B. Sinusoidal excitation<br />
In some measurement techniques, a phase shift between<br />
the optical excitation source <strong>and</strong> the detected parameter is<br />
measured. For a sinusoidally varying generation rate,<br />
G(x, t) = (G 0 + G 1 e jωt ) e −αx = ( 0 + 1 e jωt )α(1 − R) e −αx<br />
(B1)<br />
the fundamental component of the variation of the excess<br />
minority carrier density n 1 (x) exp(jωt) is determined from<br />
the equation<br />
D d2 n 1 (x)<br />
dx 2<br />
− n 1(x)<br />
τ<br />
+ G 1 e −αx = jωn 1 (x). (B2)<br />
The solution to this equation, subject to the same boundary<br />
conditions as equation (A1), is similar to equation (A4),<br />
with L replaced by L/(1 +jωτ) 1/2 , the frequency-dependent<br />
diffusion length. The sinusoidally varying light is obtained<br />
by modulating a semiconductor laser. The time varying<br />
<strong>surface</strong> photo<strong>voltage</strong> <strong>and</strong> phase are measured as a function<br />
of frequency.<br />
References<br />
[1] Brattain W H <strong>and</strong> Bardeen J 1953 <strong>Surface</strong> properties of<br />
germanium Bell Syst. Tech. J. 32 1–41<br />
[2] GarrettCGB<strong>and</strong>Brattain W H 1955 Physical theory of<br />
semiconductor <strong>surface</strong>s Phys. Rev. 99 376–87<br />
[3] Moss T S 1955 Photovoltaic <strong>and</strong> photoconductive theory<br />
applied to InSb J. Electron. Control 1 126–38<br />
[4] Brattain W H <strong>and</strong> Garrett CGB1956 Combined<br />
measurements of field-effect, <strong>surface</strong> photo-<strong>voltage</strong> <strong>and</strong><br />
photoconductivity Bell Syst. Tech. J. 35 1019–40<br />
[5] Morrison S R 1953 Changes of <strong>surface</strong> conductivity of<br />
germanium with ambient J. Phys. Chem. 57 860–3<br />
[6] Johnson E O 1957 Measurement of minority carrier lifetime<br />
with the <strong>surface</strong> photo<strong>voltage</strong> J. Appl. Phys. 28 1349–53<br />
[7] Quilliet A <strong>and</strong> Gosar P 1960 The <strong>surface</strong> photovoltaic effect in<br />
silicon <strong>and</strong> its application to measure the minority carrier<br />
lifetime J. Physique Radium 21 575–80 (in French)<br />
[8] Goodman A M 1961 A method for the measurement of short<br />
minority carrier diffusion lengths in semiconductors<br />
J. Appl. Phys. 32 2550–2<br />
[9] Goodman A M, Goodman L A <strong>and</strong> Gossenberger H F 1983<br />
Silicon-wafer process evaluation using minority-carrier<br />
diffusion length measurements by the SPV method RCA<br />
Rev. 44 326–41<br />
[10] Nakhmanson R S 1975 Frequency dependence of the<br />
photo-EMF of strongly inverted Ge <strong>and</strong> Si MIS<br />
structures—I. Theory Solid-State Electron. 18 617–26<br />
Nakhmanson R S 1975 Frequency dependence of the<br />
photo-EMF of strongly inverted Ge <strong>and</strong> Si MIS<br />
structures—II. Experiment Solid-State Electron. 18 627–34<br />
[11] Lehovec K <strong>and</strong> Slobodskoy A 1964 Impedance of<br />
semiconductor–insulator–metal capacitors Solid-State<br />
Electron. 7 59–79<br />
[12] Hofstein S R <strong>and</strong> Warfield G 1965 Physical limitations on the<br />
frequency response of a semiconductor <strong>surface</strong> inversion<br />
layer Solid-State Electron. 8 321–41<br />
[13] Lord Kelvin 1881 On a method of measuring contact<br />
electricity Nature April 1881<br />
Lord Kelvin 1898 Contact electricity of metals Phil. Mag. 46<br />
82–121<br />
[14] Kronik L <strong>and</strong> Shapira Y 1999 <strong>Surface</strong> photo<strong>voltage</strong><br />
phenomena: theory, experiment, <strong>and</strong> applications Surf. Sci.<br />
Rep. 37 1–206<br />
[15] Johnson E O 1958 Large-signal <strong>surface</strong> photo<strong>voltage</strong> studies<br />
with germanium Phys. Rev. 111 153–66<br />
[16] Semiconductor Diagnostics, Inc. 1993 Contamination<br />
Monitoring System Based on SPV Diffusion Length<br />
Measurements Manual SDI<br />
[17] Shaffert R M 1975 Electrophotography (New York: Wiley)<br />
[18] Williams R <strong>and</strong> Willis A 1968 Electron multiplication <strong>and</strong><br />
<strong>surface</strong> charge on zinc oxide single crystals J. Appl. Phys.<br />
39 3731–6<br />
[19] Williams R <strong>and</strong> Woods M H 1973 High electric fields in<br />
silicon dioxide produced by corona charging J. Appl. Phys.<br />
44 1026–8<br />
[20] Weinberg Z A 1977 Tunneling of electrons from Si into<br />
thermally grown SiO 2 Solid-State Electron. 20 11–18<br />
[21] Woods M H <strong>and</strong> Williams R 1973 Injection <strong>and</strong> removal of<br />
ionic charge at room temperature through the interface of<br />
air with SiO 2 J. Appl. Phys. 44 5506–10<br />
[22] Comizzoli R B 1987 Uses of corona discharges in the<br />
semiconductor industry J. Electrochem. Soc. 134 424–9<br />
[23] <strong>Schroder</strong> D K, Fung M S, Verkuil R L, P<strong>and</strong>ey S,<br />
Howl<strong>and</strong> W H <strong>and</strong> Kleefstra M 1998<br />
Corona-oxide-semiconductor device characterization<br />
Solid-State Electron. 42 505–12<br />
[24] Lagowski J <strong>and</strong> Edelman P 1997 Contact potential difference<br />
methods for full wafer characterization of oxidized silicon<br />
7th Int. Conf. on Defect Recognition <strong>and</strong> Image Processing<br />
(1997)<br />
[25] Pierret R F 1996 Semiconductor Device Fundamentals<br />
(Reading, MA: Addison-Wesley)<br />
[26] Johnson E O 1958 Large-signal <strong>surface</strong> photo<strong>voltage</strong> studies<br />
with germanium Phys. Rev. 111 153–66<br />
[27] Choo S C <strong>and</strong> Mazur R G 1970 Open circuit <strong>voltage</strong> behavior<br />
of junction devices Solid-State Electron. 13 553–64<br />
[28] Moore A R 1983 Theory <strong>and</strong> experiment on the<br />
<strong>surface</strong>-photo<strong>voltage</strong> diffusion-length measurement as<br />
applied to amorphous silicon J. Appl. Phys. 54 222–8<br />
Chiang C L, Schwarz R, Slobodin D E, Kolodzey J <strong>and</strong><br />
Wagner S 1986 Measurement of the minority-carrier<br />
diffusion length in thin semiconductor films IEEE Trans.<br />
Electron Devices 33 1587–92<br />
Chiang C L <strong>and</strong> Wagner S 1985 On the theoretical basis of the<br />
<strong>surface</strong> photo<strong>voltage</strong> technique IEEE Trans. Electron<br />
Devices 32 1722–6<br />
[29] <strong>Schroder</strong> D K 1997 Carrier lifetimes in silicon IEEE Trans.<br />
Electron Devices 44 160–70<br />
[30] Lagowski J, Edelman P, Dexter M <strong>and</strong> Henley W 1982<br />
Non-contact mapping of heavy metal contamination for<br />
silicon IC fabrication Semicond. Sci. Technol. 7<br />
A185–92<br />
[31] Michel J, Reddy A J, Norga G F, Platero M <strong>and</strong> Kimerling L C<br />
1997 In-situ determination of Si wafer contamination using<br />
photoconductance decay measurements Diagnostic<br />
Techniques for Semiconductor Materials <strong>and</strong> Devices<br />
PV97-12, ed P Rai-Choudhury et al (Princeton, NJ:<br />
Electrochemical Society) pp 212–22<br />
[32] Mishra K <strong>and</strong> Falster R 1992 Electrochem. Soc. Meeting<br />
Extended Abstracts 92-2 (Toronto, 1992) Abstract 426,<br />
p 632<br />
[33] Lagowski J, Edelman P, Kontkiewicz A M, Milic O,<br />
Henley W, Jastrzebski L <strong>and</strong> Hoff A M 1993 Iron detection<br />
in the part per quadrillion range in silicon using <strong>surface</strong><br />
photo<strong>voltage</strong> <strong>and</strong> photodissociation of iron–boron pairs<br />
Appl. Phys. Lett. 32 3043–5<br />
[34] Zoth G <strong>and</strong> Bergholz W 1990 A fast, preparation-free method<br />
to detect iron in silicon J. Appl. Phys. 67 6764–71<br />
[35] Zoth G <strong>and</strong> Bergholz W 1990 A fast, preparation-free method<br />
to detect iron in silicon J. Appl. Phys. 67 6764–71<br />
Antilla O J <strong>and</strong> Tilli M V 1992 Metal contamination removal<br />
on silicon wafers using dilute acidic solutions<br />
J. Electrochem. Soc. 139 1751–6<br />
Kitagawara Y, Yoshida T, Hamaguchi T <strong>and</strong> Takenaka T 1995<br />
Evaluation of oxygen-related carrier recombination centers<br />
in high-purity Czochralski-grown Si crystals by the bulk<br />
lifetime measurements J. Electrochem. Soc. 142 3505–9<br />
R30
<strong>Surface</strong> <strong>voltage</strong> <strong>and</strong> <strong>surface</strong> photo<strong>voltage</strong><br />
Miyazaki M, Miyazaki S, Kitamura T, Aoki T, Nakashima Y,<br />
Hourai M <strong>and</strong> Shigematsu T 1995 Influence of Fe<br />
contamination in Czochralski-grown silicon single crystals<br />
on LSI-yield related crystal quality characteristics Japan. J.<br />
Appl. Phys. 34 409–13<br />
RotondaroALP,Hurd T Q, Kaniava A, Vanhellemont J,<br />
Simoen E, Heyns M M <strong>and</strong> Claeys C 1996 Impact of Cu<br />
<strong>and</strong> Fe contamination on the minority carrier lifetime of<br />
silicon substrates J. Electrochem. Soc. 143 3014–19<br />
[36] Henley W, Ramappa D <strong>and</strong> Jastrzebski L 1999 Detection of<br />
copper contamination in silicon by <strong>surface</strong> photo<strong>voltage</strong><br />
diffusion length measurements Appl. Phys. Lett. 74 278–80<br />
[37] <strong>Schroder</strong> D K 1998 Semiconductor Material <strong>and</strong> Device<br />
Characterization 2nd edn (New York: Wiley–Interscience)<br />
pp 459–63<br />
[38] Renaud P <strong>and</strong> Walker A 2000 Measurement of carrier lifetime:<br />
monitoring epitaxy quality Solid State Technol. 43 143–6<br />
[39] DeBusk D K <strong>and</strong> Hoff A M 1999 Fast noncontact<br />
diffusion-process monitoring Solid State Technol. 42 67–74<br />
[40] Weinzierl S R <strong>and</strong> Miller T G 1999 Non-contact corona-based<br />
process control measurements: where we’ve been <strong>and</strong><br />
where we’re headed Analytical <strong>and</strong> Diagnostic Techniques<br />
for Semiconductor Materials, Devices, <strong>and</strong> Processes ECS<br />
99-16, edBOKolbesen et al (Princeton, NJ:<br />
Electrochemical Society) pp 342–50<br />
[41] Nauka K <strong>and</strong> Lagowski J 1998 Advances in <strong>surface</strong><br />
photo<strong>voltage</strong> techniques for monitoring of the IC processes<br />
Characterization <strong>and</strong> Metrology for ULSI Technology:<br />
1998 Int. Conf. ed D G Seiler et al (American Institute of<br />
Physics) pp 245–9<br />
Fung M S 1997 Monitoring PSG plasma damage with COS<br />
Semicond. Int. 20 211–18<br />
[42] Nauka K 1997 Contactless measurement of the Si–buried<br />
oxide interfacial charges in SOI wafers with <strong>surface</strong><br />
photo<strong>voltage</strong> technique Microelectron. Eng. 36 351–7<br />
[43] Roy P K, Chacon C, Ma Y, Kizilyalli I C, Horner G S,<br />
Verkuil R L <strong>and</strong> Miller T G 1997 Non-contact<br />
characterization of ultrathin dielectrics for the gigabit era<br />
Diagnostic Techniques for Semiconductor Materials <strong>and</strong><br />
Devices PV97-12, ed P Rai-Choudhury et al (Princeton, NJ:<br />
Electrochemical Society) pp 280–94<br />
[44] Miller T G 1995 A new approach for measuring oxide<br />
thickness Semicond. Int. 18 147–8<br />
[45] Lo S H, Buchanan D A <strong>and</strong> Taur Y 1999 Modeling <strong>and</strong><br />
characterization of quantization, polysilicon depletion, <strong>and</strong><br />
direct tunneling effects in MOSFETs with ultrathin oxides<br />
IBM J. Res. Dev. 43 327–37<br />
[46] Weinberg Z A, Johnson W C <strong>and</strong> Lampert M A 1976<br />
High-field transport in SiO 2 on silicon induced by corona<br />
charging of the unmetallized <strong>surface</strong> J. Appl. Phys. 47<br />
248–55<br />
[47] Munakata C, Nishimatsu S, Homma N <strong>and</strong> Yagi K 1984 AC<br />
<strong>surface</strong> photo<strong>voltage</strong>s in strongly-inverted oxidized p-type<br />
silicon wafers Japan. J. Appl. Phys. 11 1451–61<br />
Munakata C <strong>and</strong> Nishimatsu S 1986 Analysis of ac <strong>surface</strong><br />
photo<strong>voltage</strong>s in a depleted oxidized p-type silicon wafer<br />
Japan. J. Appl. Phys. 25 807–12<br />
[48] Kinameri K, Munakata C <strong>and</strong> Mayama K 1988 A scanning<br />
photon microscope for non-destructive observations of<br />
crystal defect <strong>and</strong> interface trap distributions in silicon<br />
wafers J. Phys. E: Sci. Instrum. 21 91–7<br />
[49] Shimizu H <strong>and</strong> Munakata C 1993 Nondestructive diagnostic<br />
method using ac <strong>surface</strong> photo<strong>voltage</strong> for detecting metallic<br />
contaminants in silicon wafers J. Appl. Phys. 73 8336–9<br />
[50] Kamieniecki E 1998 Non-contact measurements of the<br />
minority carrier recombination lifetime at the silicon<br />
<strong>surface</strong> Recombination Lifetime Measurements in Silicon<br />
ASTM, STP 1340, ed D C Gupta, F R Bacher <strong>and</strong><br />
W M Hughes, pp 147–55<br />
[51] Liberman S 1998 <strong>Surface</strong> minority carrier lifetime<br />
measurements using modulated photocurrent<br />
Recombination Lifetime Measurements in Silicon ASTM,<br />
STP 1340, ed D C Gupta, F R Bacher <strong>and</strong> W M Hughes,<br />
pp 156–67<br />
[52] Roman P, Staffa J, Fakhouri S, Brubaker M, Ruzyllo J,<br />
Torek K <strong>and</strong> Kamieniecki E 1998 <strong>Surface</strong> dopant<br />
concentration monitoring using noncontact <strong>surface</strong> charge<br />
profiling J. Appl. Phys. 83 2297–300<br />
[53] Nguyen M C, Tower J P <strong>and</strong> Danel A 1999 Epilayer quality<br />
<strong>and</strong> yield improvement using the <strong>surface</strong> charge profiler as a<br />
non-destructive diagnostic technique Analytical <strong>and</strong><br />
Diagnostic Techniques for Semiconductor Materials,<br />
Devices, <strong>and</strong> Processes ECS 99-16, ed BOKolbesen et al<br />
(Princeton, NJ: Electrochemical Society) pp 408–18<br />
[54] Green M A <strong>and</strong> Keevers M J 1995 Optical properties of<br />
intrinsic silicon at 300 K Prog. Photovolt. 3 189–92<br />
[55] ASTM St<strong>and</strong>ard F391-96 1996 St<strong>and</strong>ard test method for<br />
minority-carrier diffusion length in silicon by measurement<br />
of steady-state <strong>surface</strong> photo<strong>voltage</strong> 1996 Annual Book of<br />
ASTM St<strong>and</strong>ards (West Conshohocken, PA: American<br />
Society for Testing of Materials)<br />
[56] Phillips W E 1972 Interpretation of steady-state <strong>surface</strong><br />
photo<strong>voltage</strong> measurements in epitaxial semiconductor<br />
layers Solid-State Electron. 15 1097–102<br />
[57] Antilla O J <strong>and</strong> Hahn S K 1993 Study on <strong>surface</strong> photo<strong>voltage</strong><br />
measurement of long diffusion length silicon: simulation<br />
results J. Appl. Phys. 74 558–69<br />
[58] Hara T, Tamura F <strong>and</strong> Kitamura T 1997 Minority carrier<br />
lifetime measurements in epitaxial silicon layers<br />
J. Electrochem. Soc. 144 L54–7<br />
[59] Lagowski J, Faifer V <strong>and</strong> Edelman P 1996 Recent refinements<br />
in the <strong>surface</strong> photo<strong>voltage</strong> method for measuring very long<br />
minority carrier diffusion length Proc. Electrochem. Soc.<br />
96-13 512–22<br />
[60] Lagowski J, Edelman P <strong>and</strong> Faifer V 1998 Present status of the<br />
<strong>surface</strong> photo<strong>voltage</strong> method (SPV) for measuring minority<br />
carrier diffusion length <strong>and</strong> related parameters<br />
Recombination Lifetime Measurements in Silicon ASTM,<br />
STP 1340, ed D C Gupta, F R Bacher <strong>and</strong> W M Hughes,<br />
pp 125–44<br />
[61] Zoth G, Geyer S <strong>and</strong> Schulze H J 1999 Silicon contamination<br />
control by lifetime measurements Analytical <strong>and</strong><br />
Diagnostic Techniques for Semiconductor Materials,<br />
Devices, <strong>and</strong> Processes ECS 99-16, ed BOKolbesen et al<br />
(Princeton, NJ: Electrochemical Society) pp 5–20<br />
[62] <strong>Schroder</strong> D K 1998 Semiconductor Material <strong>and</strong> Device<br />
Characterization 2nd edn (New York: Wiley-Interscience)<br />
pp 485–7<br />
R31