Youth Customer Perception of Brand Big Bazaar - international ...
Youth Customer Perception of Brand Big Bazaar - international ...
Youth Customer Perception of Brand Big Bazaar - international ...
You also want an ePaper? Increase the reach of your titles
YUMPU automatically turns print PDFs into web optimized ePapers that Google loves.
International Indexed & Refereed Research Journal, ISSN 0975-3486,(Print)E-ISSN-2320-5482, April- May (Combind),2013 VOL-IV * ISSUE 43-44<br />
April-May ,2013<br />
Introduction<br />
India's Retail sector is wearing new clothes<br />
and with a three year compounded annual growth rate<br />
<strong>of</strong> 46.64 percent, retail is the fastest growing sector in<br />
the Indian economy. <strong>Big</strong> <strong>Bazaar</strong> a part <strong>of</strong> Future Group<br />
is a chain <strong>of</strong> hypermarket in India is designed as an<br />
agglomeration <strong>of</strong> bazaars with clusters <strong>of</strong>fering a wide<br />
range <strong>of</strong> merchandise. Now a day's youth plays an<br />
important role in the field <strong>of</strong> decision making, in this<br />
context the study also try to throw light on the youth<br />
perception and expectations in different ways towards<br />
the <strong>Big</strong> <strong>Bazaar</strong>.<br />
Literature Review<br />
SERVQUAL (Parsuraman et al, 1988) is a two<br />
part instrument for measuring service quality that was<br />
refined later (Parsuraman et al; 1991). Much <strong>of</strong> the<br />
research to date has focused on measuring service<br />
quality using this approach and its use has become<br />
quite widespread (Brown et al; 1993 and Kang and<br />
James, 2004) the instrument comprises <strong>of</strong> 22 items<br />
questionnaire which primarily measure dimensions<br />
namely Tangibles, Reliability, Assurance, Empathy and<br />
Responsiveness.<br />
Objective<br />
To find the quality gap <strong>of</strong> <strong>Big</strong> <strong>Bazaar</strong><br />
To suggest the measures to fill the quality gap and<br />
enabling <strong>Big</strong> <strong>Bazaar</strong> as a leading <strong>Brand</strong> among young<br />
sters<br />
Hypotheses<br />
H 0<br />
There is no significance difference between expected<br />
and perceived quality<br />
H 1<br />
There is a significant difference between expected and<br />
perceived quality<br />
Research Methodology:-<br />
DATA COLLECTION<br />
Research Paper-Marketing<br />
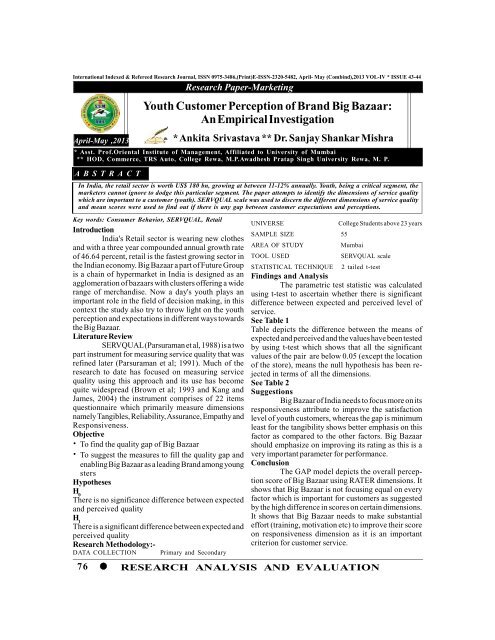
<strong>Youth</strong> <strong>Customer</strong> <strong>Perception</strong> <strong>of</strong> <strong>Brand</strong> <strong>Big</strong> <strong>Bazaar</strong>:<br />
An Empirical Investigation<br />
* Ankita Srivastava ** Dr. Sanjay Shankar Mishra<br />
* Asst. Pr<strong>of</strong>.Oriental Institute <strong>of</strong> Management, Affiliated to University <strong>of</strong> Mumbai<br />
** HOD, Commerce, TRS Auto, College Rewa, M.P.Awadhesh Pratap Singh University Rewa, M. P.<br />
A B S T R A C T<br />
In India, the retail sector is worth US$ 180 bn, growing at between 11-12% annually. <strong>Youth</strong>, being a critical segment, the<br />
marketers cannot ignore to dodge this particular segment. The paper attempts to identify the dimensions <strong>of</strong> service quality<br />
which are important to a customer (youth). SERVQUAL scale was used to discern the different dimensions <strong>of</strong> service quality<br />
and mean scores were used to find out if there is any gap between customer expectations and perceptions.<br />
Key words: Consumer Behavior, SERVQUAL, Retail<br />
Primary and Secondary<br />
UNIVERSE<br />
SAMPLE SIZE 55<br />
AREA OF STUDY Mumbai<br />
College Students above 23 years<br />
TOOL USED SERVQUAL scale<br />
STATISTICAL TECHNIQUE 2 tailed t-test<br />
Findings and Analysis<br />
The parametric test statistic was calculated<br />
using t-test to ascertain whether there is significant<br />
difference between expected and perceived level <strong>of</strong><br />
service.<br />
See Table 1<br />
Table depicts the difference between the means <strong>of</strong><br />
expected and perceived and the values have been tested<br />
by using t-test which shows that all the significant<br />
values <strong>of</strong> the pair are below 0.05 (except the location<br />
<strong>of</strong> the store), means the null hypothesis has been rejected<br />
in terms <strong>of</strong> all the dimensions.<br />
See Table 2<br />
Suggestions<br />
<strong>Big</strong> <strong>Bazaar</strong> <strong>of</strong> India needs to focus more on its<br />
responsiveness attribute to improve the satisfaction<br />
level <strong>of</strong> youth customers, whereas the gap is minimum<br />
least for the tangibility shows better emphasis on this<br />
factor as compared to the other factors. <strong>Big</strong> <strong>Bazaar</strong><br />
should emphasize on improving its rating as this is a<br />
very important parameter for performance.<br />
Conclusion<br />
The GAP model depicts the overall perception<br />
score <strong>of</strong> <strong>Big</strong> <strong>Bazaar</strong> using RATER dimensions. It<br />
shows that <strong>Big</strong> <strong>Bazaar</strong> is not focusing equal on every<br />
factor which is important for customers as suggested<br />
by the high difference in scores on certain dimensions.<br />
It shows that <strong>Big</strong> <strong>Bazaar</strong> needs to make substantial<br />
effort (training, motivation etc) to improve their score<br />
on responsiveness dimension as it is an important<br />
criterion for customer service.<br />
76 RESEARCH ANALYSIS AND EVALUATION
International Indexed & Refereed Research Journal, ISSN 0975-3486,(Print)E-ISSN-2320-5482, April- May (Combind),2013 VOL-IV * ISSUE 43-44<br />
Table 1 Service Quality Gap For The <strong>Youth</strong> <strong>Customer</strong> Of <strong>Big</strong> <strong>Bazaar</strong> India<br />
Dimensions E P Mean (P) Mean (E) GAP (E-P) Sig - 2 - Significant Null Hypothesis<br />
Tangibility Tailed (S)or Not Accepted (A) or<br />
Significant(NS) Rejected (R)<br />
Ambience is excellent E1 P1 3.636363636 4.418181818 0.781818182 0.000 S R<br />
Proper parking facilities E2 P2 3.690909091 4.490909091 0.8 0.000 S R<br />
Location is very convenient E3 P3 4.054545455 4.381818182 0.327272727 0.051 NS A<br />
layout <strong>of</strong> the store is very E4 P4 3.654545455 4.290909091 0.636363636 0.001 S R<br />
convenient<br />
Facilities provided are excellent E5 P5 3.490909091 4.472727273 0.981818182 0.000 S R<br />
Proper arrangement for check E6 P6 3.254545455 4.490909091 1.236363636 0.000 S R<br />
outs in peak time<br />
store is neat and clean E7 P7 3.581818182 4.672727273 1.090909091 0.000 S R<br />
Reliability<br />
Adequate assurance <strong>of</strong> E8 P8 3.472727273 4.363636364 0.890909091 0.000 S R<br />
availability on my purchases<br />
Excellent Quality <strong>of</strong> in-house E9 P9 3.272727273 4.327272727 1.054545455 0.000 S R<br />
brands<br />
Efficient Home delivery service E10 P10 2.818181818 4.345454545 1.527272727 0.000 S R<br />
Effective Implementation <strong>of</strong> E11 P11 3.454545455 4.309090909 0.854545455 0.000 S R<br />
the loyalty schemes<br />
effectively grievances handling E12 P12 3.254545455 4.509090909 1.254545455 0.000 S R<br />
Responsiveness<br />
Helpful Staff E13 P13 3.618181818 4.636363636 1.018181818 0.000 S R<br />
No longer time for payment E14 P14 2.4 4.472727273 2.072727273 0.000 S R<br />
Staff answers my all query E15 P15 3.309090909 4.436363636 1.127272727 0.000 S R<br />
very patiently<br />
separate customer care team E16 P16 3.109090909 4.490909091 1.381818182 0.000 S R<br />
to provide quick response<br />
Assurance<br />
I feel assured buying store E17 P17 3.236363636 4.363636364 1.127272727 0.000 S R<br />
brands<br />
Staff are knowledgeable and E18 P18 3.436363636 4.490909091 1.054545455 0.000 S R<br />
courteous<br />
prices are competitive E19 P19 3.636363636 4.472727273 0.836363636 0.000 S R<br />
Empathy<br />
Staff understand my problem E20 P20 3.072727273 4.472727273 1.4 0.000 S R<br />
and need<br />
Individual attention E21 P21 2.872727273 4.254545455 1.381818182 0.000 S R<br />
Convenient operating hour E22 P22 4.109090909 4.545454545 0.436363636 0.007 S R<br />
Table 2 Rater Scaling For <strong>Big</strong> <strong>Bazaar</strong><br />
Factors Combined Combined Gap ( E-P)<br />
Mean (P) Mean(E)<br />
Tangibility 3.6233 4.4597 0.8363<br />
Reliability 3.2545 4.3709 1.1164<br />
Responsiveness 3.109 4.509 1.4<br />
Assurance 3.4363 4.4424 1.0061<br />
Empathy 3.3515 4.4242 1.0727<br />
R E F E R E N C E<br />
1 Shukla Timira (2011), "<strong>Customer</strong> <strong>Perception</strong> <strong>of</strong> <strong>Brand</strong> LIC: An Empirical Investigation" The IUP Journal <strong>of</strong> <strong>Brand</strong><br />
Management Vol. VIII No.1 pp 48-59<br />
2 Arora R and Stoner C (1996), "The effect <strong>of</strong> perceived Service Quality and Name familiarity on the service selection decision",<br />
Journal <strong>of</strong> Marketing, Vol.10, No.1 pp 22-34<br />
3 Parasuraman A, Zeithaml V A and Berry L L (1988), "SERVQUAL: A Multiple Item Scale for Measuring Consumer <strong>Perception</strong>s<br />
<strong>of</strong> Service Quality", Journal <strong>of</strong> Retailing, Vol.64, No.1, pp. 12-40<br />
4 Ernst &Young, "The Great Indian Retail Story", 2006.<br />
RESEARCH ANALYSIS AND EVALUATION<br />
77


