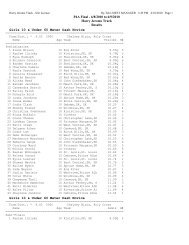
First Nations and Métis - Saskatchewan Rivers School Division No.119
First Nations and Métis - Saskatchewan Rivers School Division No.119
First Nations and Métis - Saskatchewan Rivers School Division No.119

You also want an ePaper? Increase the reach of your titles
YUMPU automatically turns print PDFs into web optimized ePapers that Google loves.
<strong>First</strong> <strong>Nations</strong><br />
<strong>and</strong> Métis<br />
Education<br />
June 2010<br />
<strong>Saskatchewan</strong> <strong>Rivers</strong> <strong>School</strong> <strong>Division</strong><br />
Excellence for Every Learner
<strong>First</strong> <strong>Nations</strong> <strong>and</strong> Métis Education<br />
June 2010<br />
This report was accepted by the Board of Education on June 7, 2010.<br />
Contact Person<br />
Tom Sutherl<strong>and</strong><br />
Superintendent of <strong>School</strong>s<br />
<strong>Saskatchewan</strong> <strong>Rivers</strong> <strong>School</strong> <strong>Division</strong><br />
545 11 th Street East<br />
Prince Albert, <strong>Saskatchewan</strong>, Canada<br />
S6V 1B1<br />
Telephone: (306) 764-1571<br />
Facsimile: (306) 763-4460<br />
Web Site: www.srsd119.ca/continuousimprovement.html<br />
Cover Photo: Westview Community <strong>School</strong> Pow Wow Dance Troupe
Table of Contents<br />
Introduction Page 4<br />
1. <strong>First</strong> <strong>Nations</strong> <strong>and</strong> Métis Students: Two Frameworks to Measure Success Page 5<br />
2. Demographics <strong>and</strong> Social Conditions Page 8<br />
• <strong>First</strong> <strong>Nations</strong> <strong>and</strong> Métis People in Prince Albert Page 8<br />
• <strong>First</strong> <strong>Nations</strong> <strong>and</strong> Métis Students in the <strong>School</strong> <strong>Division</strong> Page 9<br />
3. <strong>First</strong> <strong>Nations</strong> <strong>and</strong> Métis Education Plan Page 11<br />
• The Plan Page 11<br />
• The Board of Education Three Year Plan Page 12<br />
• Letter of Intent with the Prince Albert Gr<strong>and</strong> Council Page 12<br />
4. The Education Outcomes of <strong>First</strong> <strong>Nations</strong> <strong>and</strong> Métis Students Page 13<br />
• Graduation Rates Page 13<br />
• Provincial Assessment for Learning Program: Reading Page 15<br />
• An Analysis of the Reading Assessment Results by Ethnicity Page 15<br />
• <strong>School</strong> <strong>Division</strong> Common Mathematics Assessment Page 16<br />
• An Analysis of the Math Assessment Results by Ethnicity Page 16<br />
Appendix A<br />
Detailed Assessment Data by Ethnicity Page 18<br />
List of Figures (page number)<br />
Figure 1: Student Data Sets (6)<br />
Figure 2: Student Academic Achievement Framework (6)<br />
Figure 3: Sources <strong>and</strong> Domains of Knowledge (7)<br />
Figure 4: The Lifelong Learning Journey (7)<br />
Figure 5: <strong>First</strong> <strong>Nations</strong> <strong>and</strong> Métis Students (9)<br />
Figure 6: <strong>First</strong> <strong>Nations</strong> <strong>and</strong> Métis Students by <strong>School</strong> (10)<br />
Figure 7: Average Graduation Rate by Ethnic Group (13)<br />
Figure 8: The Percentage <strong>and</strong> Number of <strong>First</strong> <strong>Nations</strong> <strong>and</strong><br />
Métis Graduates: 1999-2000 to 2008-2009 (14)<br />
Assessment for Learning: Reading (Achievement Scores)<br />
Figure 9: Grade 4, 2007, <strong>First</strong> <strong>Nations</strong> Students (18)<br />
Figure 10: Grade 4, 2007, Métis Students (18)<br />
Figure 11: Grade 4, 2007, non-<strong>First</strong> <strong>Nations</strong> <strong>and</strong> Métis<br />
Students (18)<br />
Figure 12: Grade 4, 2009, <strong>First</strong> <strong>Nations</strong> Students (19)<br />
Figure 13: Grade 4, 2009, Métis Students (19)<br />
Figure 14: Grade 4, 2009, non-<strong>First</strong> <strong>Nations</strong> <strong>and</strong> Métis<br />
Students (19)<br />
Assessment for Learning: Reading (Performance Outcomes)<br />
Figure 15: Grade 4, 2007, <strong>First</strong> <strong>Nations</strong> Students (20)<br />
Figure 16: Grade 4, 2007, Métis Students (20)<br />
Figure 17: Grade 4, 2007, non-<strong>First</strong> <strong>Nations</strong> <strong>and</strong> Métis<br />
Students (20)<br />
Figure 18: Grade 4, 2009, <strong>First</strong> <strong>Nations</strong> Students (21)<br />
Figure 19: Grade 4, 2009, Métis Students (21)<br />
Figure 20: Grade 4, 2009, non-<strong>First</strong> <strong>Nations</strong> <strong>and</strong> Métis<br />
Students (21)<br />
Assessment for Learning: Reading (Achievement Scores)<br />
Figure 21: Grade 7, 2007, <strong>First</strong> <strong>Nations</strong> Students (22)<br />
Figure 22: Grade 7, 2007, Métis Students (22)<br />
Figure 23: Grade 7, 2007, non-<strong>First</strong> <strong>Nations</strong> <strong>and</strong> Métis<br />
Students (22)<br />
Figure 24: Grade 7, 2009, <strong>First</strong> <strong>Nations</strong> Students (23)<br />
Figure 25: Grade 7, 2009, Métis Students (23)<br />
Figure 26: Grade 7, 2009, non-<strong>First</strong> <strong>Nations</strong> <strong>and</strong> Métis<br />
Students (23)<br />
Assessment for Learning: Reading (Performance Outcomes)<br />
Figure 27: Grade 7, 2007, <strong>First</strong> <strong>Nations</strong> Students (24)<br />
Figure 28: Grade 7, 2007, Métis Students (24)<br />
Figure 29: Grade 7, 2007, non-<strong>First</strong> <strong>Nations</strong> <strong>and</strong> Métis<br />
Students (24)<br />
Figure 30: Grade 7, 2009, <strong>First</strong> <strong>Nations</strong> Students (25)<br />
Figure 31: Grade 7, 2009, Métis Students (25)<br />
Figure 32: Grade 7, 2009, non-<strong>First</strong> <strong>Nations</strong> <strong>and</strong> Métis<br />
Students (25)<br />
Assessment for Learning: Reading (Achievement Scores)<br />
Figure 33: Grade 10, 2007, <strong>First</strong> <strong>Nations</strong> Students (26)<br />
Figure 34: Grade 10, 2007, Métis Students (26)<br />
Figure 35: Grade 10, 2007, non-<strong>First</strong> <strong>Nations</strong> <strong>and</strong> Métis<br />
Students (26)<br />
Figure 36: Grade 10, 2007, <strong>First</strong> <strong>Nations</strong> Students (27)<br />
Figure 37: Grade 10, 2007, Métis Students (27)<br />
Figure 38: Grade 10, 2007, non-<strong>First</strong> <strong>Nations</strong> <strong>and</strong> Métis<br />
Students (27)<br />
Assessment for Learning: Reading (Performance Outcomes)<br />
Figure 39: Grade 10, 2007, <strong>First</strong> <strong>Nations</strong> Students (28)<br />
Figure 40: Grade 10, 2007, Métis Students (28)<br />
Figure 41: Grade 10, 2007, non-<strong>First</strong> <strong>Nations</strong> <strong>and</strong> Métis<br />
Students (28)<br />
Figure 42: Grade 10, 2009, <strong>First</strong> <strong>Nations</strong> Students (29)<br />
Figure 43: Grade 10, 2009, Métis Students (29)<br />
Figure 44: Grade 10, 2009, non-<strong>First</strong> <strong>Nations</strong> <strong>and</strong> Métis<br />
Students (29)<br />
Common Mathematics Assessment: Percent of Correct<br />
Answers by Ethnicity<br />
Figure 45: Grade 1 (30)<br />
Figure 46: Grade 2 (30)<br />
Figure 47: Grade 3 (30)<br />
Figure 48: Grade 4 (30)<br />
Figure 49: Grade 5 (31)<br />
Figure 50: Grade 6 (31)<br />
Figure 51: Grade 7 (31)<br />
Figure 52: Grade 8 (31)
Introduction<br />
The Ministry of Education in its document Inspiring Success: Building Toward Student Achievement set<br />
an expectation that each school division will create a <strong>First</strong> <strong>Nations</strong> <strong>and</strong> Métis Education Plan that aligns<br />
with the Continuous improvement Framework. In response to this expectation, the school division’s first<br />
step was to discover the current state of <strong>First</strong> <strong>Nations</strong> <strong>and</strong> Métis education in the school division by<br />
examining a set of disaggregated student assessment data to identify the learning strengths <strong>and</strong><br />
challenges of <strong>First</strong> <strong>Nations</strong> <strong>and</strong> Métis students.<br />
This report is the first analysis of the learning outcomes of <strong>First</strong> <strong>Nations</strong> <strong>and</strong> Métis students prepared by<br />
the school division. In subsequent reports, more data will be available <strong>and</strong> more complex analyses<br />
possible though the use of data warehouse software which will be available in the fall of 2010.<br />
This report contains four sections. The first section examines two frameworks of indicators of the<br />
success of <strong>First</strong> <strong>Nations</strong> <strong>and</strong> Métis students. One framework is the traditional analysis of student<br />
achievement using student assessment data <strong>and</strong> graduation rates. The second framework suggests a<br />
more holistic approach to measuring the success of <strong>First</strong> <strong>Nations</strong> <strong>and</strong> Métis learners.<br />
The second section describes the demographics <strong>and</strong> social conditions of <strong>First</strong> <strong>Nations</strong> <strong>and</strong> Métis people<br />
in Prince Albert. This social context outlines the many barriers facing <strong>First</strong> <strong>Nations</strong> <strong>and</strong> Métis children<br />
<strong>and</strong> youth as they attempt to succeed in the school system. As well, statistics about the number <strong>and</strong><br />
location of <strong>First</strong> <strong>Nations</strong> <strong>and</strong> Métis learners in the school division are provided.<br />
The components of the school division’s <strong>First</strong> <strong>Nations</strong> <strong>and</strong> Métis Education Plan <strong>and</strong> the initial steps<br />
toward this plan’s development are described in the third section. This report, the Board of Education’s<br />
Three Year Plan <strong>and</strong> the Letter of Intent with the Prince Albert Gr<strong>and</strong> Council are important<br />
contributions to the plan’s development.<br />
Finally, the educational outcomes of <strong>First</strong> <strong>Nations</strong> <strong>and</strong> Métis students are compared to those of non-<strong>First</strong><br />
<strong>Nations</strong> <strong>and</strong> Métis students using graduation rates <strong>and</strong> student assessment data. The results of the 2007<br />
<strong>and</strong> 2009 Reading Assessment for Learning <strong>and</strong> the 2009 school division Common Mathematics<br />
Assessment are presented with some limited commentary. The Appendix contains many graphs that<br />
illustrate the assessment data in some detail.<br />
The data indicate that graduation rates for <strong>First</strong> <strong>Nations</strong> <strong>and</strong> Métis students are improving. However, the<br />
results of student assessment data are mixed. In subsequent reports a clearer picture will emerge because<br />
more assessment data will be available, these data will span more school years <strong>and</strong> new data warehouse<br />
software will enable richer data analyses.<br />
Page 4
1<br />
<strong>First</strong> Nation <strong>and</strong> Métis Students: Two<br />
Frameworks to Measure Success<br />
The Canadian Council on Learning in their 2009 report The State of Aboriginal Learning in Canada,<br />
advocates a new framework for determining the success of <strong>First</strong> <strong>Nations</strong> <strong>and</strong> Métis learners. It proposes<br />
a Holistic Lifelong Learning Measurement Framework:<br />
“By broadening the conventional scope of inquiry to a more holistic one, this framework<br />
provides a more complete picture of Aboriginal learning. Indeed, a new narrative emerges that<br />
supersedes the all-too familiar <strong>and</strong> distressing storyline that centers on learning deficits <strong>and</strong><br />
academic shortcomings among Aboriginal youth.” p 5<br />
This holistic framework has two components. The first, Sources <strong>and</strong> Domains of Knowledge, suggests<br />
that <strong>First</strong> <strong>Nations</strong> <strong>and</strong> Métis students need to learn from <strong>and</strong> about culture, language <strong>and</strong> tradition.<br />
Further, the model recognizes that “Aboriginal learning is a highly social process that serves to nurture<br />
relationships in the family <strong>and</strong> throughout the community.” p 5 Finally, the central role that Elders play<br />
in the promotion of lifelong learning is emphasized.<br />
The second component is the Lifelong Learning Journey <strong>and</strong> it advocates that success should be<br />
measured using indicators such as access to early learning programs, high school completion rates, <strong>and</strong><br />
enrolment in post-secondary programs. Additional indicators include informal <strong>and</strong> experimental<br />
learning opportunities <strong>and</strong> access to broadb<strong>and</strong> internet services. Informal <strong>and</strong> experiential learning<br />
“helps foster a desire to learn among Aboriginal youth while helping with the acquisition of new skills.”<br />
p 6 Access to broadb<strong>and</strong> internet services is an important to facilitate lifelong learning opportunities.<br />
The holistic framework provides school divisions with some alternative indicators of student success but<br />
data are not available for many of these new indicators. Holistic indicators can not replace this school<br />
division’s current list of academic achievement indicators but rather will augment them. (Both models<br />
are illustrated in Figures 2, 3 <strong>and</strong> 4.)<br />
During the 2010-2011 school year, this school division along with the Ministry of Education, <strong>and</strong> three<br />
other school divisions, Regina Public, Northern Lights <strong>and</strong> Ile-a-la Crosse, will be working together to<br />
create a holistic assessment tool that supports <strong>First</strong> <strong>Nations</strong> <strong>and</strong> Métis students. More details about this<br />
work will be available early in the fall.<br />
The school division currently has a substantial amount of student assessment data which, as mentioned<br />
in the Introduction, will soon be available for detailed analysis. Figure 1 illustrates the school division’s<br />
student assessment data sets. This Figure, along with the information in the Academic Assessment<br />
Framework. shows that the data are not only annual but span several years. Therefore, a longitudinal<br />
analysis of the progress of individual students, groups of students or the whole student body will be<br />
available. In the future, teacher prepared elementary progress reports (Prekindergarten to Grade 8) <strong>and</strong><br />
data from the Early Development Instrument will also be available. (The EDI is an annual<br />
questionnaire measuring Kindergarten children's ‘readiness for school’ across several areas of child<br />
development.)<br />
All these assessment <strong>and</strong> demographic data can be disaggregated by ethnic group <strong>and</strong> therefore, a more<br />
<strong>and</strong> more accurate picture of the success of <strong>First</strong> <strong>Nations</strong> <strong>and</strong> Métis learners will be available.<br />
Page 5
Figure 1<br />
Student Data Sets<br />
Student Data Sets<br />
Assessment for Learning<br />
(Teacher Marked)<br />
Data<br />
Set<br />
Mathematics<br />
(Gr 5, 8 & 11)<br />
• 2006<br />
• 2007<br />
• 2009<br />
Data<br />
Set<br />
Student Enrolment,<br />
Demographics,<br />
Attendance, &<br />
Achievement<br />
Data<br />
Set<br />
2006 to 2009<br />
Various Grades<br />
<strong>and</strong> <strong>School</strong>s<br />
Electronic<br />
Report Card<br />
K to Grade 8<br />
Data<br />
Set<br />
Data<br />
Set<br />
Reading<br />
(Gr 4, 7& 10)<br />
• 2007<br />
• 2009<br />
Data<br />
Set<br />
Writing<br />
(Gr 5, 8 & 11)<br />
• 2008<br />
<strong>School</strong> <strong>Division</strong> Common<br />
Mathematics Assessment<br />
Data<br />
Set<br />
• 2006 (Gr 9)<br />
• 2007 (Gr 9)<br />
• 2008 (Gr 7, 8 & 9)<br />
• 2009 (K to Gr 9)<br />
Early Literacy Project<br />
K to Grade 3<br />
Data<br />
Set<br />
2006 to 2009<br />
Various Grades<br />
<strong>and</strong> <strong>School</strong>s<br />
Student<br />
Transportation<br />
Data<br />
Set<br />
Skopus is the product name<br />
of the school division’s<br />
data warehouse software.<br />
Academic Achievement Framework<br />
Student Academic Achievement<br />
The Board of Education has a goal to eliminate the academic gap between <strong>First</strong> <strong>Nations</strong> <strong>and</strong> Métis<br />
students <strong>and</strong> the general student population. Student academic success is measured though the analysis<br />
of student assessment data from several common provincial <strong>and</strong> school division assessments.<br />
Figure 2<br />
Domain Indicator <strong>School</strong> <strong>Division</strong> Measure<br />
Student Academic Achievement<br />
Developmental Reading<br />
Assessment<br />
Annual student assessment data from Kindergarten to<br />
Grade 8<br />
Reading Early Literacy Screen<br />
Annual student assessment data from Kindergarten to<br />
Grade 3<br />
Assessment for Learning<br />
Student assessment data: Gr 4, 7 <strong>and</strong> 10 (2007 <strong>and</strong><br />
2009)<br />
Student assessment data: Gr 5, 8 <strong>and</strong> 11 (2008 <strong>and</strong><br />
Writing Assessment for Learning<br />
2010)<br />
Higher Levels of<br />
<strong>School</strong> <strong>Division</strong> Common Annual student assessment date from Kindergarten to<br />
Literacy <strong>and</strong><br />
Math Assessment Grade 9<br />
Achievement Mathematics<br />
Student assessment data: Gr 5, 8 <strong>and</strong> 11 (2005, 2007<br />
Assessment for Learning<br />
<strong>and</strong> 2009)<br />
Teaching<br />
Annual survey results for Gr 7 students <strong>and</strong> Gr 4 <strong>and</strong> 7<br />
Treaty Education Survey<br />
Treaties<br />
teachers <strong>and</strong> their administrators.<br />
Continuous Graduation Rates<br />
Number of <strong>First</strong> <strong>Nations</strong> <strong>and</strong> Métis student graduates<br />
Improvement Persistence to Graduate Number of years to complete graduation requirements<br />
Framework Secondary Credits Average marks, course registrations, credits earned<br />
Core Indicators Cohort Group<br />
How students transitioned from one year to the next<br />
Holistic Lifelong Learning Measurement Framework<br />
Sources <strong>and</strong> Domains of Knowledge<br />
Lifelong learning for Aboriginal people is rooted in relationships with the natural world <strong>and</strong> the world of<br />
people (i.e., the self, the family, ancestors, clan, community, nation <strong>and</strong> other nations) <strong>and</strong> their<br />
Page 6
experiences with languages, spirituality, traditions <strong>and</strong> ceremonies.<br />
These complex relationships <strong>and</strong> experiences are represented in all of the Holistic Lifelong Learning<br />
Models as Sources <strong>and</strong> Domains of Knowledge, though the ways in which they are represented reflect<br />
the unique perspective of <strong>First</strong> <strong>Nations</strong>, Inuit <strong>and</strong> Métis people.<br />
(Source of text <strong>and</strong> table: Canadian Council on Learning (2009). The State of Aboriginal Learning in Canada: A Holistic<br />
Approach to Measuring Success. Pages 16 <strong>and</strong> 18)<br />
Figure 3<br />
Domain Indicator Canadian Council on Learning (CCL) Measure <strong>School</strong> <strong>Division</strong> Measure<br />
Sources <strong>and</strong> Domains of Knowledge<br />
Self insufficient data available insufficient data available No data available<br />
Family<br />
Family support Strength of ties with family members No data available<br />
Family involvement Importance of parental engagement in school<br />
World of People<br />
Elders Exposure to Elders Amount of time spent with Elders<br />
Description of Elder<br />
services; Number of Elders;<br />
Number of students served<br />
Community Community support Degree of support from others in the community No data available<br />
L<strong>and</strong><br />
Natural history insufficient data available insufficient data available No data available<br />
Traditional skills Use of traditional skills Participation in traditional hunting, fishing or trapping No data available<br />
L<strong>and</strong> use insufficient data available insufficient data available No data available<br />
Languages,<br />
Traditions <strong>and</strong><br />
Cultures<br />
Languages<br />
Traditions <strong>and</strong><br />
ceremonies<br />
Culture<br />
Language vitality<br />
Sources of support for children learning their Aboriginal<br />
language<br />
Use of Aboriginal language Degree of Aboriginal language use at home No data available<br />
Participation in cultural<br />
Description of cultural<br />
Participation of children in traditional cultural activies<br />
ceremonies<br />
activies in schools<br />
Cultural vitality<br />
Availabilty of support for children to learn their culture<br />
<strong>and</strong> history<br />
Description of cultural<br />
activies in schools<br />
Spirituality<br />
Spiritual<br />
development<br />
Practice of spiritual<br />
teachings<br />
How Métis maintain their spiritual well-being<br />
No data available<br />
The Lifelong Learning Journey<br />
Aboriginal people view learning as a lifelong process that begins at birth <strong>and</strong> progresses through<br />
childhood, youth <strong>and</strong> adulthood. This process is represented in each of the Holistic Lifelong Learning<br />
Models, <strong>and</strong> represents the full range of learning opportunities that occur across the life cycle <strong>and</strong> in a<br />
variety of settings (school, home, community, workplace <strong>and</strong> the l<strong>and</strong>). (Source of text <strong>and</strong> table: Canadian<br />
Council on Learning (2009). The State of Aboriginal Learning in Canada: A Holistic Approach to Measuring Success. Page<br />
17 <strong>and</strong> 31)<br />
Figure 4<br />
Domain Indicator Canadian Council on Learning (CCL) Measure <strong>School</strong> <strong>Division</strong> Measure<br />
The Lifelong Learning Journey (The categories of Young Adults-19 to 34 <strong>and</strong> Adults <strong>and</strong> Elders from the CCL report were not included.)<br />
Participation rates for Kids<br />
Enrolment in ECE<br />
Type of child-care arrangement used<br />
<strong>First</strong>, school-based day<br />
opportunites<br />
care, Prekindergarten<br />
Infants <strong>and</strong> Children<br />
(0 -5<br />
Early childhood<br />
education<br />
(ECE)<br />
Early learning<br />
in the home<br />
Early<br />
development<br />
milestones<br />
Availabiltiy of Aborginalspecific<br />
ECE programs<br />
Reading to children<br />
Level of school readiness<br />
Does child-care arrangement promote Aboriginal<br />
values?<br />
Proportion of children who read or were read to daily<br />
Proportion of children who hear stories daily<br />
Proportion of children who are 'not ready' for school<br />
No data available<br />
Description of PreK <strong>and</strong> K<br />
language program<br />
Description of PreK <strong>and</strong> K<br />
language program<br />
Early Development<br />
Instrument (data available in<br />
2010-2011)<br />
Youth (6 to 18)<br />
Learning in<br />
school<br />
Learning at<br />
home <strong>and</strong> in<br />
the community<br />
Dropout rate<br />
Proportion of incomplete high school learning<br />
Graduation rates; credit<br />
attainment; school<br />
attendance <strong>and</strong> transience<br />
rates<br />
<strong>School</strong> attendance Degree of absenteeism from school Attendance rates<br />
Participation in clubs or groups<br />
Membership lists<br />
Participation in extracurricular<br />
activities<br />
Participation in sports<br />
Team rosters<br />
Participation in arts or music<br />
Class lists<br />
Community involvement Youth volunteerism rates No data available<br />
Page 7
2<br />
Demographics<br />
<strong>and</strong> Social Conditions<br />
On September 30, 2009, there were 2672 <strong>First</strong> <strong>Nations</strong> <strong>and</strong> 1270 Métis students registered in schools of<br />
the <strong>Saskatchewan</strong> <strong>Rivers</strong> <strong>School</strong> <strong>Division</strong>. These students represents 44.2% of the total student<br />
population. Since 85% of the school division’s <strong>First</strong> <strong>Nations</strong> students <strong>and</strong> 71% of Métis students attend<br />
school in the City of Prince Albert, it seems appropriate to review the population profile of Aboriginal 1<br />
people living in Prince Albert.<br />
<strong>First</strong> <strong>Nations</strong> <strong>and</strong> Métis People in Prince Albert: A Summary of 2006<br />
Census Data<br />
Loder, R: 2006 Aboriginal Population Profile for Prince Albert. Statistics Canada (February 2010)<br />
Population<br />
The Aboriginal population living in the census agglomeration of Prince Albert is young <strong>and</strong><br />
growing.<br />
In 2006, a total of 141,890 Aboriginal people lived in <strong>Saskatchewan</strong>, representing 15% of<br />
the provincial population.<br />
In 2006, the census agglomeration of Prince Albert, with 13,570 Aboriginal people, had<br />
the highest concentration of Aboriginal people of any city in <strong>Saskatchewan</strong>. About one in<br />
three (34%) people in Prince Albert were Aboriginal. By comparison, Saskatoon had the<br />
largest Aboriginal population (21,535) of any city in <strong>Saskatchewan</strong>, but the Aboriginal<br />
population only represented 9% of that city’s total population.<br />
Between 2001 <strong>and</strong> 2006, the Aboriginal population in Prince Albert grew by 17%, from<br />
11,640 to 13,570 people. The <strong>First</strong> <strong>Nations</strong> population grew by 25%, while the Métis<br />
grew by 12%.<br />
Over half (56%) the Aboriginal population in Prince Albert was under the age of 25,<br />
almost double the proportion of 28% for the non-Aboriginal population.<br />
Education<br />
Aboriginal youth aged 15 to 24 in Prince Albert had lower school attendance rates than their non-<br />
Aboriginal counterparts (51% versus 59%). Aboriginal people also have a greater tendency to<br />
return to school later in life than do non-Aboriginal people.<br />
Aboriginal women in Prince Albert were slightly more likely than Aboriginal men to have<br />
completed postsecondary education. Almost half (47%) of Aboriginal women aged 25 to 64<br />
years had completed postsecondary education, compared to 45% of their male counterparts.<br />
1. Statistics Canada defines Aboriginal persons as those who reported identifying with at least one Aboriginal group, that<br />
is, North American Indian, Métis or Inuit, <strong>and</strong>/or those who reported being a Treaty Indian or a registered Indian as<br />
defined by the Indian Act of Canada, <strong>and</strong>/or those who reported they were members of an Indian b<strong>and</strong> or <strong>First</strong> Nation.<br />
Page 8
Employment<br />
The unemployment rate for the Aboriginal core working age population (aged 25 to 54) in Prince<br />
Albert was higher than that of the non-Aboriginal population (14.3% compared to 5.2%). While<br />
<strong>First</strong> <strong>Nations</strong> women were more likely to be unemployed than their male counterparts, the<br />
inverse was true in the Métis <strong>and</strong> non-Aboriginal populations.<br />
Métis men <strong>and</strong> women aged 25 to 54 had employment rates (79.8% <strong>and</strong> 76.8%, respectively) that<br />
most resembled those of their non-Aboriginal counterparts (86.2% <strong>and</strong> 83.2%, respectively).<br />
In 2000, Aboriginal people working full-time, full-year, earned 86% of what their non-<br />
Aboriginal counterparts were earning. By 2005, this percentage had increased to 87%.<br />
Income<br />
Statistics Canada uses the concept of low-income cut-off (LICO) to indicate an income threshold<br />
below which a family will likely devote a larger share of its income on the necessities of food,<br />
shelter <strong>and</strong> clothing than the average family. In 2005, in Prince Albert nearly four in 10 (38%)<br />
Aboriginal people were living under the LICO, compared to 12% of non-Aboriginal people. In<br />
addition, almost half (47%) of Aboriginal children in Prince Albert were living under the LICO,<br />
compared to 15% of non-Aboriginal children. These data are based on the before tax LICO.<br />
Transiency<br />
In 2006, four in 10 Aboriginal people in Prince Albert had lived at the same address five years<br />
ago, compared to 65% of the non-Aboriginal population. From 2001 to 2006, almost four in 10<br />
(37%) Aboriginal people had moved at least once within Prince Albert, <strong>and</strong> the rest (24%) had<br />
moved to Prince Albert from another community.<br />
Living Conditions<br />
In Prince Albert, about one in seven (14%) Aboriginal people lived in homes requiring major<br />
repairs in 2006, compared to 13% in 2001. In comparison, the share of Prince Albert’s non-<br />
Aboriginal population living in dwellings in need of major repairs was 7% in 2006 <strong>and</strong> 8% in<br />
2001. The share of Aboriginal people living in crowded homes was 11% in 2006 up from 10% in<br />
2001. The comparable rates for the non-Aboriginal population were about 1% in 2006 <strong>and</strong> in<br />
2001.<br />
<strong>First</strong> <strong>Nations</strong> <strong>and</strong> Métis Students in the <strong>School</strong> <strong>Division</strong><br />
As of September 30, 2009, 3947 students in Prekindergarten to Grade 12 students declared themselves to<br />
be of <strong>First</strong> <strong>Nations</strong>, Métis or Inuit ancestry. This number represents 44.2% of the total student<br />
population in the school division. Figure 5 provides more details:<br />
Figure 5<br />
<strong>First</strong> <strong>Nations</strong>: 2672 (29.2%)<br />
Métis: 1270 (14.2%)<br />
Inuit: 5 ( 0.1%)<br />
Total 3947 (44.2%)<br />
Figure 6 illustrates the <strong>First</strong> <strong>Nations</strong> <strong>and</strong> Métis student enrolment by school. 81% of <strong>First</strong> <strong>Nations</strong> <strong>and</strong><br />
Métis students in the school division attend school in Prince Albert <strong>and</strong> 41% attend one of the school<br />
division’s ten Community <strong>School</strong>s.<br />
Page 9
80 (27.9%)<br />
Figure 6<br />
<strong>First</strong> <strong>Nations</strong> <strong>and</strong> Métis Students:<br />
Enrolment by <strong>School</strong><br />
(These data reflect<br />
the student<br />
enrolment on<br />
September 30,<br />
2009.)<br />
32<br />
(33.0%)<br />
24 (19.2%)<br />
40 (22.6%)<br />
26<br />
(29.2%)<br />
47 (14.2%)<br />
27 (16.1%)<br />
60 (25.6%)<br />
5 (50.0%)<br />
19 (17.8%)<br />
44 (10.2%)<br />
85 (29.0%)<br />
42<br />
85% of all <strong>First</strong> <strong>Nations</strong> students <strong>and</strong> 71% (42.4%)<br />
of all Métis students attend school in the<br />
City of Prince Albert. Most <strong>First</strong> <strong>Nations</strong> students<br />
in the school division do not live on a <strong>First</strong><br />
Nation. However, 150 students (6% of <strong>First</strong><br />
<strong>Nations</strong> students in the school division) do travel<br />
to our schools from 9 different <strong>First</strong> <strong>Nations</strong>.<br />
34<br />
(39.5%)<br />
129 (65.8%)<br />
69 (18.2%)<br />
337<br />
(89.4%)<br />
310<br />
(80.9%)<br />
110<br />
(56.7%)<br />
149<br />
(68.0%)<br />
111<br />
(50.7%)<br />
142<br />
(76.8%)<br />
170<br />
(48.9%)<br />
194<br />
(80.5%) 246<br />
(75.5%)<br />
59<br />
(25.9%)<br />
149<br />
(48.2%)<br />
1113<br />
(48.7%)<br />
94<br />
(19.1%)<br />
<strong>School</strong>s in the<br />
City of Prince Albert<br />
Page 10
3<br />
<strong>First</strong> Nation <strong>and</strong> Métis Education Plan<br />
The Plan<br />
The Ministry of Education in its document Inspiring Success: Building Toward Student Achievement set<br />
an expectation that each school division will create a <strong>First</strong> <strong>Nations</strong> <strong>and</strong> Métis Education Plan that aligns<br />
with the Continuous improvement Framework. This plan will includes the following expectations:<br />
• A focus on supports <strong>and</strong> improved outcomes for <strong>First</strong> <strong>Nations</strong> <strong>and</strong> Métis learners.<br />
• Ensure all learners have knowledge of <strong>First</strong> <strong>Nations</strong> <strong>and</strong> Métis peoples’ histories,<br />
perspectives, worldviews <strong>and</strong> contributions, including m<strong>and</strong>atory treaty education,<br />
throughout the learning program.<br />
• Collect data <strong>and</strong> report on measures outlined in the Ministry’s <strong>First</strong> <strong>Nations</strong> <strong>and</strong> Métis<br />
education policy framework.<br />
• Build partnerships with <strong>First</strong> <strong>Nations</strong> <strong>and</strong> Métis peoples, where applicable, in support of<br />
shared management of the provincial education system.<br />
• Develop resources <strong>and</strong> establish supports including Elders, cultural advisors <strong>and</strong> traditional<br />
knowledge keepers, to build capacity throughout the school division to implement <strong>First</strong><br />
<strong>Nations</strong> <strong>and</strong> Métis education.<br />
In response to this expectation, the school division has developed the following plan of action:<br />
Step 1 Discover the current state of <strong>First</strong> <strong>Nations</strong> <strong>and</strong> Métis education in the school<br />
division. This work will be accomplished by a small team of employees in the<br />
Education Centre. The outcomes of this work will include:<br />
• A set of disaggregated Student Assessment Data identify the learning strengths <strong>and</strong><br />
challenges of <strong>First</strong> <strong>Nations</strong> <strong>and</strong> Métis Learners; <strong>and</strong>,<br />
This Report<br />
• An inventory of programs that currently meet the Ministry’s criteria for a <strong>First</strong><br />
<strong>Nations</strong> <strong>and</strong> Métis Education Plan.<br />
Step 2 Second an individual <strong>and</strong>/or establish a Committee from the school division to:<br />
• Review the research on best practices to eliminate the academic gap between <strong>First</strong><br />
Nation <strong>and</strong> Métis students <strong>and</strong> the general student population.<br />
• Consult with groups <strong>and</strong> agencies that represent <strong>First</strong> <strong>Nations</strong> <strong>and</strong> Métis children,<br />
youth <strong>and</strong> their families <strong>and</strong> discover their vision for <strong>First</strong> <strong>Nations</strong> <strong>and</strong> Métis<br />
education.<br />
• Meet with <strong>First</strong> <strong>Nations</strong> <strong>and</strong> Métis youth who attend schools in the division.<br />
• Meet with groups <strong>and</strong> agencies who represent <strong>First</strong> <strong>Nations</strong> <strong>and</strong> Métis children, youth<br />
<strong>and</strong> their parents:<br />
◊ <strong>First</strong> <strong>Nations</strong> officials from b<strong>and</strong>s that purchase education services from the<br />
school division;<br />
◊<br />
◊<br />
◊<br />
◊<br />
◊<br />
<strong>School</strong> Community Councils from schools with a large population of <strong>First</strong><br />
<strong>Nations</strong> <strong>and</strong> Métis students;<br />
The Prince Albert Métis Women’s Association;<br />
Prince Albert Indian <strong>and</strong> Métis Friendship Centre; SIAST Woodl<strong>and</strong> Campus<br />
Students’ Association (75% of SIAST students are of <strong>First</strong> <strong>Nations</strong> or Métis<br />
ancestry);<br />
Prince Albert Gr<strong>and</strong> Council Urban Services; <strong>and</strong>,<br />
Prince Albert Kids <strong>First</strong>.<br />
Page 11
Step 1 of this process will be completed by the end of the 2009-2010 school year. Step 2 will await the<br />
results of the partnership discussions between the school division <strong>and</strong> the Prince Albert Gr<strong>and</strong> Council<br />
The Board of Education Three Year Plan<br />
The Board of Education has developed a Three Year Plan. Four sections of this plan specifically address<br />
the <strong>First</strong> <strong>Nations</strong> <strong>and</strong> Métis education program:<br />
5.1 Continue to work to enhance relationships with <strong>First</strong> Nation <strong>and</strong> Métis communities. There is<br />
a need to open up lines of communications <strong>and</strong> cooperation on educational issues with the Prince<br />
Albert Gr<strong>and</strong> Council. Partnerships need to be established to exp<strong>and</strong> programs to:<br />
• develop schools that meet the needs of urban <strong>First</strong> Nation <strong>and</strong> Métis children <strong>and</strong> their<br />
families; <strong>and</strong>,<br />
• develop an outreach program/school that focuses on youth age 10 to 15 years who are<br />
already outside of the school system.<br />
5.2 Strengthen the Board’s relationship with the Prince Albert Gr<strong>and</strong> Council by establishing a<br />
tri-party committee (school division, Ministry, PAGC), whose m<strong>and</strong>ate will be to work together<br />
to improve the academic achievement of <strong>First</strong> Nation <strong>and</strong> Métis students.<br />
5.3 Establish a Roundtable on <strong>First</strong> Nation <strong>and</strong> Métis Education, for two purposes:<br />
• to recognize the shared responsibility among parents, community, <strong>First</strong> Nation <strong>and</strong><br />
Métis organizations, government, <strong>and</strong> the school division to ensure the success of<br />
<strong>First</strong> Nation <strong>and</strong> Métis learners; <strong>and</strong>,<br />
• to eliminate the academic gap between <strong>First</strong> Nation <strong>and</strong> Métis students <strong>and</strong> the<br />
general student population.<br />
5.7 Develop a protocol to acquire a school division elder, by utilizing the Prince Albert Gr<strong>and</strong><br />
Council elder pool.<br />
Letter of Intent with the Prince Albert Gr<strong>and</strong> Council<br />
Both the Prince Albert Gr<strong>and</strong> Council <strong>and</strong> the Board of Education of the <strong>Saskatchewan</strong> <strong>Rivers</strong> <strong>School</strong><br />
<strong>Division</strong> expressed a desire to begin discussions to create a partnership agreement.<br />
On April 28, 2009 representatives from both<br />
organizations along with officials from the Ministry of<br />
Education met to discuss a formal partnership between<br />
the Gr<strong>and</strong> Council <strong>and</strong> the school division. The Ministry<br />
of Education agreed to fund a facilitator <strong>and</strong> in the fall of<br />
2009 Rita Bouvier was engaged as the facilitator <strong>and</strong> led<br />
the process to develop a formal partnership. To date, a<br />
draft Letter of Intent has been prepared <strong>and</strong> awaits<br />
approval from both parties. A excerpt from the letter’s<br />
introduction is included on this page. To achieve the<br />
purpose of the letter, the parties agree to work address<br />
four areas of common interest:<br />
• Improving Student Outcomes;<br />
• Joint Planning for Staff Development<br />
Opportunities;<br />
• Discussing Issues of Common Interest; <strong>and</strong>,<br />
• Communication.<br />
Letter of Intent to Work Together to<br />
Improve Educational Outcomes for<br />
Students<br />
We, the undersigned, have agreed to<br />
work together to improve the<br />
educational outcomes for students who<br />
reside in member <strong>First</strong> Nation<br />
communities of the Prince Albert Gr<strong>and</strong><br />
Council <strong>and</strong> in the <strong>Saskatchewan</strong> <strong>Rivers</strong><br />
<strong>School</strong> <strong>Division</strong>. In recognition of the<br />
inherent treaty rights of each <strong>First</strong><br />
Nation community, this working<br />
relationship is intended solely to<br />
augment the education support services<br />
offered by the Prince Albert Gr<strong>and</strong><br />
Council <strong>and</strong> the <strong>Saskatchewan</strong> <strong>Rivers</strong><br />
<strong>School</strong> <strong>Division</strong>.<br />
Page 12
4<br />
The Education Outcomes of <strong>First</strong> Nation<br />
<strong>and</strong> Métis Students<br />
Graduation Rates<br />
In <strong>Saskatchewan</strong>, students require 24 secondary credits in Grades 10 to 12 to graduate. Typically, a<br />
student can earn these credits over a three year period but some students will take more than ten years to<br />
complete high school. Therefore, measuring graduation rates after only three years does not provide an<br />
accurate graduation rate. A better measure is Persistence to Complete data provided by the Ministry of<br />
Education. These data show how many years it takes students to graduate after starting Grade 10.<br />
After three years from the start of Grade 10, an average of 69% of students in this school division<br />
graduate. However, when these numbers are disaggregated by ethnicity, 80% of non-<strong>First</strong> <strong>Nations</strong> <strong>and</strong><br />
Métis students <strong>and</strong> 37% of <strong>First</strong> <strong>Nations</strong> <strong>and</strong> Métis students graduate after three years. Figure 7<br />
illustrates the average graduation rates by ethnic group from three to ten years following the start of<br />
Grade 10.<br />
100<br />
Average Graduation Rate by Ethnic Group<br />
(The number of years taken to graduate following the start of Grade 10.)<br />
Figure 7<br />
90<br />
80<br />
79.9%<br />
83%<br />
84.1%<br />
84.6%<br />
85%<br />
85.3%<br />
85.7%<br />
86%<br />
Percent<br />
70<br />
60<br />
50<br />
40<br />
69.4%<br />
73.5% 75.1% 76% 76.5% 77% 77.4% 78.2%<br />
59.7%<br />
54.5%<br />
56.3%<br />
50.5%<br />
52.2%<br />
48%<br />
44.1%<br />
30<br />
37.4%<br />
20<br />
All Students<br />
10<br />
Non <strong>First</strong> <strong>Nations</strong> <strong>and</strong> Métis Students<br />
<strong>First</strong> <strong>Nations</strong> <strong>and</strong> Métis Students<br />
0<br />
3 Years 4 Years 5 Years 6 Years 7 Years 8 Years 9 Years 10+ Years<br />
Grade 10 Start Year<br />
Data Source: Persistence to Graduate, Ministry of Education<br />
These data include students who began Grade 10 by registering in at least two credits in the <strong>Saskatchewan</strong> <strong>Rivers</strong> <strong>School</strong><br />
<strong>Division</strong>. Data from 1995-1996 to 2006-2007 were used to calculate the averages. Students illustrated in this figure<br />
graduated from a school in <strong>Saskatchewan</strong> but not necessarily in this school division.<br />
Page 13
Figure 7 illustrates that <strong>First</strong> <strong>Nations</strong> <strong>and</strong> Métis students have a higher persistence rate than other<br />
students. Following three years, an additional 22% of <strong>First</strong> <strong>Nations</strong> <strong>and</strong> Métis students complete high<br />
school. These data speak to the success of high school programs that encourage youth to return to<br />
school many years after the traditional high school completion period of three years.<br />
The Percentage <strong>and</strong> Number of <strong>First</strong> <strong>Nations</strong> <strong>and</strong> Métis<br />
Graduates in the <strong>Saskatchewan</strong> <strong>Rivers</strong> <strong>School</strong> <strong>Division</strong><br />
1999-2000 to 2008-2009<br />
Figure 8<br />
35<br />
Data Source: Student Data System, Minisrty of Education<br />
30<br />
Percentage of Total Graduates<br />
25<br />
20<br />
15<br />
10<br />
5<br />
12%<br />
(62)<br />
13%<br />
(69)<br />
10%<br />
(62)<br />
16%<br />
(87)<br />
13%<br />
(66)<br />
16%<br />
(85)<br />
25% 25%<br />
(134) (139)<br />
27%<br />
(147)<br />
29%<br />
(148)<br />
0<br />
1999-2000 2000-2001 2001-2002 2002-2003 2003-2004 2004-2005 2005-2006 2006-2007 2007-2008 2008-2009<br />
<strong>School</strong> Year<br />
Other data point to an increasing number of <strong>First</strong> <strong>Nations</strong> <strong>and</strong> Métis students who are graduating from<br />
high school in this school division. Figure 8 illustrates that over the last ten years, the number of <strong>First</strong><br />
<strong>Nations</strong> <strong>and</strong> Métis students in graduating classes in this school division has increased by 58%. In the<br />
spring of 2000, 62 <strong>First</strong> <strong>Nations</strong> <strong>and</strong> Métis students graduated from high school. This number<br />
represented 12% of the graduating class. By the spring of 2009, <strong>First</strong> <strong>Nations</strong> <strong>and</strong> Métis students made<br />
up 29% of the graduating class. This number, although encouraging, is still not representative of the<br />
total population of <strong>First</strong> <strong>Nations</strong> <strong>and</strong> Métis students for in 2008-2009 this group represented<br />
approximately 44% of the student population in the school division.<br />
Page 14
The Provincial Assessment for Learning Program (AFL)<br />
Grade 4, 7 <strong>and</strong> 10 Reading (2007 <strong>and</strong> 2009)<br />
Introduction to the Reading Assessment for Learning<br />
The Ministry of Education provides province-wide assessments of student learning for reading, writing,<br />
<strong>and</strong> mathematics. The Assessment for Learning Project gathers data about student proficiency <strong>and</strong><br />
opportunity-to-learn in the three subject areas which schools <strong>and</strong> school divisions can use to improve<br />
student learning. In the spring of 2007 <strong>and</strong> 2009 students in Grades 4, 7 <strong>and</strong> 10 participated in the<br />
provincial Reading Assessment. In the pages that follow, the 2007 <strong>and</strong> 2009 AFL Reading data is<br />
presented by reading strategy. As an introduction to reading strategies, the Ministry of Education<br />
provides the following overview.<br />
Analysis of Reading Comprehension Categorized by Reading Strategy<br />
Although reading is a complex act involving many processes simultaneously, it is possible to<br />
make inferences about some of the reading strategies students had to use as they responded to<br />
each multiple-choice item. The strategy analysis may be useful for discussion about strengths <strong>and</strong><br />
needs of students <strong>and</strong> to guide planning around future strategic reading instruction. It is important<br />
to note that large-scale assessments are limited in assessing all important reading strategies, <strong>and</strong><br />
that other forms of assessment <strong>and</strong> other sources of evidence are required for meaningful<br />
improvement planning <strong>and</strong> intervention.” (Ministry of Education, 2009)<br />
The 2007 <strong>and</strong> 2009 Reading Assessment for Learning measured the following reading strategies:<br />
• Using Cueing Systems to construct meaning (pragmatic, textual, syntactic, semantic, <strong>and</strong><br />
graphophonic), <strong>and</strong> other cues <strong>and</strong> conventions including visual clues;<br />
• Connecting to Prior Knowledge <strong>and</strong> experiences that relate text to self, text to other texts,<br />
<strong>and</strong> texts to the world;<br />
• Making Inferences/ Predictions based on textual information;<br />
• Noting Key Ideas <strong>and</strong> Finding Support;<br />
• Summarizing/ Recalling Information/ Drawing Conclusions (including organizing <strong>and</strong><br />
synthesizing the information); <strong>and</strong>,<br />
• Recognizing (<strong>and</strong> evaluating) Author's Message <strong>and</strong> Craft including distinguishing facts<br />
from opinions.<br />
(Ministry of Education, 2009)<br />
An Analysis of the Assessment Results by Ethnicity<br />
The assessment data, including both the achievement scores <strong>and</strong> performance outcomes, are displayed in<br />
graph form for each grade, year <strong>and</strong> ethnic group in the Appendix.<br />
For the purpose of comparing student results from 2007 to 2009, the Performance Outcomes using the<br />
st<strong>and</strong>ards established by the Ministry will be used. Please see the Data Note below for an explanation of<br />
st<strong>and</strong>ards.<br />
Grade 4 (2007 <strong>and</strong> 2009)<br />
In 2007 an average of 46% of <strong>First</strong> <strong>Nations</strong> students achieved at the adequate or proficient st<strong>and</strong>ard<br />
across the six reading strategies. 71% of Métis students <strong>and</strong> 85% of Non-<strong>First</strong> <strong>Nations</strong> <strong>and</strong> Métis<br />
Data Note: St<strong>and</strong>ards were set by a panel of teachers <strong>and</strong> academics with language arts <strong>and</strong> reading skill development <strong>and</strong> teaching<br />
expertise. The panel deliberated over the nature <strong>and</strong> difficulty of each assessment item, considered the learning environment <strong>and</strong> assessment<br />
context, <strong>and</strong> discussed rationale for their judgments. To help interpret how well students did in performance areas, two st<strong>and</strong>ards were set:<br />
one for adequate or higher performance, <strong>and</strong> one for proficient or higher performance. (Ministry of Education)<br />
Page 15
students achieved the adequate or proficient st<strong>and</strong>ard. The achievement gap was 39% for <strong>First</strong> <strong>Nations</strong><br />
students <strong>and</strong> 14% for Métis students. In 2009 the achievement gap closed significantly for <strong>First</strong> <strong>Nations</strong><br />
students as an average of 74% of performed at the adequate or proficient st<strong>and</strong>ard which was only 14%<br />
below the performance of Non-<strong>First</strong> <strong>Nations</strong> <strong>and</strong> Métis students.<br />
A Commentary on the Results<br />
Assessment data from the Early Literacy Project indicate that students in Kindergarten to Grade 3 have<br />
made significant gains in reading. Most of the 2009 Grade 4 students have been involved in this project<br />
for over three years. The Early Literacy Project data suggest that there should have been an<br />
improvement in AFL Reading scores in 2009. (The Early Literacy Project is described in the school<br />
division’s 2009-2010 Continuous Improvement Report on page 27.)<br />
Grade 7 (2007 <strong>and</strong> 2009)<br />
The results of the Grade 7 students are opposite from their Grade 4 counterparts in that students in all<br />
three ethnic groups achieved lower performance results in 2009 than were achieved in 2007. The<br />
following table summarizes these results.<br />
Percent Achieving at Adequate<br />
or Proficient St<strong>and</strong>ard (Average)<br />
<strong>First</strong> <strong>Nations</strong> Students 2007 67%<br />
2009 54%<br />
Métis Students 2007 81%<br />
2009 75%<br />
Non-<strong>First</strong> <strong>Nations</strong> <strong>and</strong> Métis Students 2007 89%<br />
2009 83%<br />
In 2009 the achievement gap widened for <strong>First</strong> <strong>Nations</strong> students as an average of 54% of performed at<br />
the adequate or proficient st<strong>and</strong>ard which was 29% below the performance of Non-<strong>First</strong> <strong>Nations</strong> <strong>and</strong><br />
Métis students. In 2007 this gap was 22%.<br />
A Commentary on the Results<br />
No definite explanation for these results is evident. Neither the 2007 or the 2009 students were part of<br />
the Early Literacy Project or other significant reading intervention program therefore the results of the<br />
two years should have at least been similar.<br />
In recognition of the success of the Early Literacy Program <strong>and</strong> as a response to the 2009 AFL Reading<br />
results, the school division has developed the Literacy in Action Project. This reading project is geared<br />
for students in Grades 6, 7 <strong>and</strong> 8. Teachers focus on building critical literacy skills with students so that<br />
they are able to question, analyze, <strong>and</strong> critically examine text. Teachers also learn how to differentiate<br />
instruction to meet the variety of student learning needs within the classroom. Teachers receive support<br />
from the Integrated Learning Consultant <strong>and</strong> the Technology coach.<br />
Grade 10 (2007 <strong>and</strong> 2009)<br />
The Grade 10 AFL Reading results are similar to those of the Grade 4 students in that students in 2009<br />
performed better than students in 2007. The following table summarizes these results.<br />
Percent Achieving at Adequate<br />
or Proficient St<strong>and</strong>ard (Average)<br />
<strong>First</strong> <strong>Nations</strong> Students 2007 66%<br />
2009 73%<br />
Métis Students 2007 78%<br />
2009 86%<br />
Non-<strong>First</strong> <strong>Nations</strong> <strong>and</strong> Métis Students 2007 87%<br />
2009 90%<br />
Page 16
In 2009 the achievement gap closed for <strong>First</strong> <strong>Nations</strong> students as an average of 73% of performed at the<br />
adequate or proficient st<strong>and</strong>ard which was 17% below the performance of Non-<strong>First</strong> <strong>Nations</strong> <strong>and</strong> Métis<br />
students. In 2007 this gap was 21%.<br />
A Commentary on the Results<br />
The trend illustrated by the high school AFL Reading results is encouraging. However, a more solid<br />
indication of progress awaits additional test results. The AFL Reading Assessment will be written again<br />
by Grade 10 students in 2011.<br />
The <strong>School</strong> <strong>Division</strong> Common Mathematics Assessment<br />
Grades 1 to 8 (2009)<br />
The Common Mathematics Assessment was developed by a team of teachers from the school division.<br />
The test is based upon the new <strong>Saskatchewan</strong> elementary <strong>and</strong> middle years mathematics curriculum.<br />
For most grades, 2009 was the first year students participated in this assessment <strong>and</strong> therefore the results<br />
will provide a baseline for future assessments. Assessment data from Grades 1 to 8 are presented in this<br />
report. The Grade 9 mathematics assessment was revamped in 2009 to match the str<strong>and</strong>s of the current<br />
middle years assessment.<br />
An Analysis of the Assessment Results by Ethnicity<br />
The assessment data are displayed in graph form for each grade, year <strong>and</strong> ethnic group in the Appendix.<br />
For this measure, the data do not differentiate between <strong>First</strong> <strong>Nations</strong> <strong>and</strong> Métis students.<br />
The graphs in the Appendix indicate that the performance of <strong>First</strong> <strong>Nations</strong> <strong>and</strong> Métis students is below<br />
that of non-<strong>First</strong> <strong>Nations</strong> <strong>and</strong> Métis students for every grade. However, except for Grade 1 <strong>and</strong> Grade 4,<br />
the achievement gap between <strong>First</strong> <strong>Nations</strong> <strong>and</strong> Métis students <strong>and</strong> non-<strong>First</strong> <strong>Nations</strong> <strong>and</strong> Métis students<br />
is between fourteen <strong>and</strong> seventeen percent even though the overall achievement scores vary widely<br />
amongst grades. For example the Grade 2 students as a group performed rather well on the mathematics<br />
assessment, whereas the Grade 8 students results showed the students were performing below grade<br />
level. However, the gap between <strong>First</strong> <strong>Nations</strong> <strong>and</strong> Métis students <strong>and</strong> non-<strong>First</strong> <strong>Nations</strong> <strong>and</strong> Métis<br />
students was similar.<br />
A Commentary on the Results<br />
Since the middle years classes (Grades 6 to 8) show an increasing challenge with Mathematical<br />
concepts, the Ministry of Education <strong>and</strong> the school division have implemented several programs. The<br />
first is the Mathematics Curriculum Renewal project. A few years ago the Ministry of Education<br />
released a new mathematics curriculum that is based upon the Western <strong>and</strong> Northern Canadian Protocol<br />
(WNCP) in Mathematics. Teachers are supported in the implementation of this new curriculum by an<br />
Integrated Learning Consultant <strong>and</strong> Mathematics Coaches. As well, the school division has<br />
implemented the Math Makes Sense <strong>and</strong> the <strong>First</strong> Steps in Mathematics resources. Math Makes Sense is<br />
the mathematics resource chosen to support the provincial mathematics curriculum. This resource<br />
includes print material for students <strong>and</strong> teachers, assessment tools, <strong>and</strong> e-learning resources. <strong>First</strong> Steps<br />
in Mathematics is a supplemental resource which includes diagnostic tools for teachers.<br />
It will be interesting to watch these assessment results as the new Mathematics curriculum becomes<br />
more fully implemented across the school division. We note that the school division Common<br />
Mathematics Assessment showed similar results to the provincial Mathematics Assessment for Learning<br />
for Grades 5 <strong>and</strong> 8.<br />
Page 17
Appendix<br />
Assessment for Learning: Grade 4 Reading (2007 <strong>and</strong> 2009)<br />
Achievement Scores by Reading Strategy: Analysis by Ethnicity<br />
Data Note: The numbers in each graph indicate the percentage of students at each school division benchmark.<br />
100<br />
90<br />
Figure 9: <strong>First</strong> <strong>Nations</strong> Students 2007<br />
80<br />
70<br />
60<br />
72%<br />
62% 63% 64%<br />
60%<br />
50<br />
45%<br />
40<br />
30<br />
20<br />
10<br />
11%<br />
4%<br />
13%<br />
25% 25%<br />
5%<br />
18% 19% 17%<br />
12%<br />
14% 13% 14%<br />
14%<br />
11%<br />
10%<br />
3% 4%<br />
0<br />
Using Cueing Systems<br />
Connecting to Prior<br />
Knowledge<br />
Making<br />
Inferences/Predictions,<br />
Drawing Conclusions<br />
Noting Key Ideas <strong>and</strong><br />
Finding Support<br />
Summarizing/ Recalling/<br />
Organizing Information<br />
Recognizing Author's<br />
Message <strong>and</strong> Craft<br />
100<br />
90<br />
Figure 10: Métis Students 2007<br />
80<br />
70<br />
60<br />
50<br />
40<br />
30<br />
20<br />
10<br />
43%<br />
28%<br />
19%<br />
10%<br />
49%<br />
24%<br />
14% 13%<br />
34%<br />
23% 23%<br />
20%<br />
41%<br />
8%<br />
29%<br />
22%<br />
36%<br />
38%<br />
13% 13%<br />
40%<br />
31%<br />
15% 14%<br />
0<br />
100<br />
90<br />
Using Cueing Systems<br />
Connecting to Prior<br />
Knowledge<br />
Making<br />
Inferences/Predictions,<br />
Drawing Conclusions<br />
Noting Key Ideas <strong>and</strong><br />
Finding Support<br />
Summarizing/ Recalling/<br />
Organizing Information<br />
Recognizing Author's<br />
Message <strong>and</strong> Craft<br />
Figure 11: Non-<strong>First</strong> <strong>Nations</strong> or Métis Students 2007<br />
80<br />
70<br />
60<br />
56%<br />
50<br />
40<br />
30<br />
20<br />
10<br />
40%<br />
27%<br />
16% 16%<br />
44%<br />
28%<br />
13% 15%<br />
17% 17%<br />
10%<br />
47%<br />
21%<br />
19%<br />
14%<br />
44%<br />
18%<br />
21%<br />
17%<br />
39%<br />
27%<br />
21%<br />
13%<br />
0<br />
Using Cueing Systems<br />
Connecting to Prior<br />
Knowledge<br />
Making<br />
Inferences/Predictions,<br />
Drawing Conclusions<br />
Noting Key Ideas <strong>and</strong><br />
Finding Support<br />
Summarizing/ Recalling/<br />
Organizing Information<br />
Recognizing Author's<br />
Message <strong>and</strong> Craft<br />
Page 18
<strong>School</strong> <strong>Division</strong> Benchmarks Green Zone<br />
Green Zone 80% to 100%<br />
Above Grade Level Expectation<br />
Blue Zone 65% to 79%<br />
At Grade Level Expectation<br />
Yellow Zone 56% to 64%<br />
Slightly Below Grade Level Expectation<br />
100<br />
90<br />
Red Zone 0% to 55%<br />
Below Grade Level Expectation<br />
Figure 12: <strong>First</strong> <strong>Nations</strong> Students 2009<br />
80<br />
70<br />
60<br />
50<br />
40<br />
30<br />
20<br />
10<br />
48%<br />
45%<br />
47%<br />
38%<br />
40%<br />
40%<br />
34%<br />
26%<br />
20% 23%<br />
20%<br />
22% 23%<br />
19%<br />
16%<br />
17%<br />
14%<br />
17%<br />
16% 16%<br />
16%<br />
20%<br />
13%<br />
9%<br />
0<br />
Using Cueing Systems<br />
Connecting to Prior<br />
Knowledge<br />
Making<br />
Inferences/Predictions,<br />
Drawing Conclusions<br />
Noting Key Ideas <strong>and</strong><br />
Finding Support<br />
Summarizing/ Recalling/<br />
Organizing Information<br />
Recognizing Author's<br />
Message <strong>and</strong> Craft<br />
100<br />
90<br />
80<br />
70<br />
Figure 13: Métis Students 2009<br />
64%<br />
74%<br />
60<br />
50<br />
47%<br />
46%<br />
46%<br />
40<br />
35%<br />
36%<br />
30<br />
20<br />
10<br />
17%<br />
10%<br />
26%<br />
11%<br />
6%<br />
19%<br />
22%<br />
19%<br />
25%<br />
26%<br />
16%<br />
12%<br />
7%<br />
11%<br />
10%<br />
9%<br />
7%<br />
0<br />
Using Cueing Systems<br />
Connecting to Prior<br />
Knowledge<br />
Making<br />
Inferences/Predictions,<br />
Drawing Conclusions<br />
Noting Key Ideas <strong>and</strong><br />
Finding Support<br />
Summarizing/ Recalling/<br />
Organizing Information<br />
Recognizing Author's<br />
Message <strong>and</strong> Craft<br />
100<br />
90<br />
Figure 14: Non-<strong>First</strong> <strong>Nations</strong> or Métis Students 2009<br />
80<br />
70<br />
60<br />
50<br />
40<br />
30<br />
20<br />
10<br />
69%<br />
53%<br />
48%<br />
47%<br />
37%<br />
36%<br />
29%<br />
23%<br />
18% 20%<br />
19%<br />
14% 14%<br />
15%<br />
14%<br />
14%<br />
10%<br />
9%<br />
10%<br />
11%<br />
7%<br />
6%<br />
4%<br />
72%<br />
0<br />
Using Cueing Systems<br />
Connecting to Prior<br />
Knowledge<br />
Making<br />
Inferences/Predictions,<br />
Drawing Conclusions<br />
Noting Key Ideas <strong>and</strong><br />
Finding Support<br />
Summarizing/ Recalling/<br />
Organizing Information<br />
Recognizing Author's<br />
Message <strong>and</strong> Craft<br />
Page 19
Assessment for Learning: Grade 4 Reading (2007 <strong>and</strong> 2009)<br />
Performance Outcomes by Reading Strategy: Analysis by Ethnicity<br />
Data Note: St<strong>and</strong>ards were set by a panel of teachers <strong>and</strong> academics with language arts <strong>and</strong> reading skill development <strong>and</strong> teaching<br />
expertise. The panel deliberated over the nature <strong>and</strong> difficulty of each assessment item, considered the learning environment <strong>and</strong> assessment<br />
context, <strong>and</strong> discussed rationale for their judgments. To help interpret how well students did in performance areas, two st<strong>and</strong>ards were set:<br />
one for adequate or higher performance, <strong>and</strong> one for proficient or higher performance. (Ministry of Education)<br />
100<br />
90<br />
80<br />
Adequate St<strong>and</strong>ard<br />
Proficient St<strong>and</strong>ard<br />
Figure15: <strong>First</strong> <strong>Nations</strong> Students<br />
2007<br />
70<br />
60<br />
50<br />
40<br />
30<br />
20<br />
10<br />
0<br />
23%<br />
17%<br />
38%<br />
17%<br />
26%<br />
26%<br />
28%<br />
24%<br />
23%<br />
12%<br />
19%<br />
21%<br />
Using Cueing Systems<br />
Connecting to Prior<br />
Knowledge<br />
Making<br />
Inferences/Predictions,<br />
Drawing Conclusions<br />
Noting Key Ideas <strong>and</strong><br />
Finding Support<br />
Summarizing/ Recalling/<br />
Organizing Information<br />
Recognizing Author's<br />
Message <strong>and</strong> Craft<br />
Reading Strategies<br />
100<br />
Adequate St<strong>and</strong>ard<br />
Proficient St<strong>and</strong>ard<br />
Figure 16: Métis Students<br />
2007<br />
90<br />
80<br />
70<br />
60<br />
50<br />
33%<br />
45%<br />
22%<br />
24%<br />
33%<br />
15%<br />
40<br />
30<br />
20<br />
10<br />
38% 34%<br />
57% 51%<br />
31%<br />
45%<br />
0<br />
Using Cueing Systems<br />
Connecting to Prior<br />
Knowledge<br />
Making<br />
Inferences/Predictions,<br />
Drawing Conclusions<br />
Noting Key Ideas <strong>and</strong><br />
Finding Support<br />
Summarizing/ Recalling/<br />
Organizing Information<br />
Recognizing Author's<br />
Message <strong>and</strong> Craft<br />
Reading Strategies<br />
100<br />
Adequate St<strong>and</strong>ard<br />
Proficient St<strong>and</strong>ard<br />
Figure 17: Non-<strong>First</strong> <strong>Nations</strong> or Métis Students<br />
2007<br />
90<br />
80<br />
70<br />
60<br />
28%<br />
37%<br />
17%<br />
22%<br />
41%<br />
13%<br />
50<br />
40<br />
30<br />
20<br />
56%<br />
50%<br />
73%<br />
65%<br />
41%<br />
66%<br />
10<br />
0<br />
Using Cueing Systems<br />
Connecting to Prior<br />
Knowledge<br />
Making<br />
Inferences/Predictions,<br />
Drawing Conclusions<br />
Noting Key Ideas <strong>and</strong><br />
Finding Support<br />
Summarizing/ Recalling/<br />
Organizing Information<br />
Recognizing Author's<br />
Message <strong>and</strong> Craft<br />
Reading Strategies<br />
Page 20
Data Note: The numbers in each graph indicate the percentage of students at each st<strong>and</strong>ard.<br />
100<br />
90<br />
80<br />
Adequate St<strong>and</strong>ard<br />
Proficient St<strong>and</strong>ard<br />
Figure 18: <strong>First</strong> <strong>Nations</strong> Students<br />
2009<br />
70<br />
60<br />
50<br />
40<br />
51%<br />
32%<br />
39%<br />
47%<br />
35%<br />
33%<br />
30<br />
20<br />
10<br />
26%<br />
48%<br />
21%<br />
23%<br />
43%<br />
47%<br />
0<br />
Using Cueing Systems<br />
Connecting to Prior<br />
Knowledge<br />
Making<br />
Inferences/Predictions,<br />
Drawing Conclusions<br />
Noting Key Ideas <strong>and</strong><br />
Finding Support<br />
Summarizing/ Recalling/<br />
Organizing Information<br />
Recognizing Author's<br />
Message <strong>and</strong> Craft<br />
Reading Strategies<br />
100<br />
Adequate St<strong>and</strong>ard<br />
Proficient St<strong>and</strong>ard<br />
Figure 19: Métis Students<br />
2009<br />
90<br />
80<br />
70<br />
60<br />
40%<br />
25%<br />
37%<br />
37%<br />
26%<br />
16%<br />
50<br />
40<br />
30<br />
20<br />
47%<br />
64%<br />
41%<br />
46%<br />
67%<br />
74%<br />
10<br />
0<br />
Using Cueing Systems<br />
Connecting to Prior<br />
Knowledge<br />
Making<br />
Inferences/Predictions,<br />
Drawing Conclusions<br />
Noting Key Ideas <strong>and</strong><br />
Finding Support<br />
Summarizing/<br />
Recalling/ Organizing<br />
Information<br />
Recognizing Author's<br />
Message <strong>and</strong> Craft<br />
Reading Strategy<br />
100<br />
Adequate St<strong>and</strong>ard<br />
Proficient St<strong>and</strong>ard<br />
Figure 20: Non-<strong>First</strong> <strong>Nations</strong> or Métis Students<br />
2009<br />
90<br />
80<br />
70<br />
60<br />
42%<br />
21%<br />
30%<br />
31%<br />
25%<br />
18%<br />
50<br />
40<br />
30<br />
20<br />
48%<br />
69%<br />
51%<br />
53%<br />
69%<br />
72%<br />
10<br />
0<br />
Using Cueing Systems<br />
Connecting to Prior<br />
Knowledge<br />
Making<br />
Inferences/Predictions,<br />
Drawing Conclusions<br />
Noting Key Ideas <strong>and</strong><br />
Finding Support<br />
Summarizing/ Recalling/<br />
Organizing Information<br />
Recognizing Author's<br />
Message <strong>and</strong> Craft<br />
Reading Strategy<br />
Page 21
Assessment for Learning: Grade 7 Reading (2007 <strong>and</strong> 2009)<br />
Achievement Scores by Reading Strategy: Analysis by Ethnicity<br />
Data Note: The numbers in each graph indicate the percentage of students at each school division benchmark.<br />
Figure 21: <strong>First</strong> <strong>Nations</strong> Students<br />
2007<br />
100<br />
90<br />
80<br />
70<br />
60<br />
50<br />
52%<br />
49%<br />
58%<br />
61%<br />
48%<br />
40<br />
30<br />
20<br />
10<br />
15%<br />
14%<br />
19%<br />
16%<br />
25%<br />
10%<br />
17%<br />
9%<br />
15%<br />
36%<br />
17%<br />
17%<br />
30%<br />
14%<br />
22%<br />
2%<br />
25%<br />
20%<br />
8%<br />
0<br />
Using Cueing Systems Connecting to Prior Knowledge Making Inferences/Predictions,<br />
Drawing Conclusions<br />
Noting Key Ideas <strong>and</strong> Finding<br />
Support<br />
Summarizing/ Recalling/<br />
Organizing Information<br />
Recognizing Author's Message<br />
<strong>and</strong> Craft<br />
100<br />
Figure 22: Métis Students<br />
2007<br />
90<br />
80<br />
70<br />
60<br />
53%<br />
54%<br />
50<br />
40<br />
30<br />
20<br />
10<br />
22%<br />
11%<br />
26%<br />
40%<br />
11%<br />
10%<br />
26%<br />
42%<br />
17%<br />
18%<br />
24%<br />
21%<br />
10%<br />
15%<br />
39%<br />
18%<br />
33%<br />
10%<br />
35%<br />
17%<br />
35%<br />
14%<br />
0<br />
Using Cueing Systems Connecting to Prior Knowledge Making Inferences/Predictions,<br />
Drawing Conclusions<br />
Noting Key Ideas <strong>and</strong> Finding<br />
Support<br />
Summarizing/ Recalling/<br />
Organizing Information<br />
Recognizing Author's Message<br />
<strong>and</strong> Craft<br />
Figure 23: Non-<strong>First</strong> <strong>Nations</strong> or Métis Students 2007<br />
100<br />
90<br />
80<br />
70<br />
60<br />
50<br />
40<br />
51%<br />
52%<br />
35%<br />
38%<br />
57%<br />
42%<br />
40%<br />
30<br />
20<br />
10<br />
16%<br />
15%<br />
18%<br />
4%<br />
9%<br />
23%<br />
18%<br />
21%<br />
14%<br />
12%<br />
17%<br />
28%<br />
17%<br />
13%<br />
21%<br />
13%<br />
26%<br />
0<br />
Using Cueing Systems<br />
Connecting to Prior Knowledge Making Inferences/Predictions,<br />
Drawing Conclusions<br />
Noting Key Ideas <strong>and</strong> Finding<br />
Support<br />
Summarizing/ Recalling/<br />
Organizing Information<br />
Recognizing Author's Message<br />
<strong>and</strong> Craft<br />
Page 22
100<br />
Figure 24: <strong>First</strong> <strong>Nations</strong> Students<br />
<strong>School</strong> <strong>Division</strong> Benchmarks Green Zone<br />
Green Zone 80% to 100%<br />
Above Grade Level Expectation<br />
Blue Zone 65% to 79%<br />
At Grade Level Expectation<br />
Yellow Zone 56% to 64%<br />
Slightly Below Grade Level Expectation<br />
Red Zone 0% to 55%<br />
Below Grade Level Expectation<br />
2009<br />
90<br />
83%<br />
80<br />
70<br />
72%<br />
66%<br />
60<br />
50<br />
54%<br />
57%<br />
51%<br />
40<br />
30<br />
20<br />
10<br />
0<br />
22%<br />
12%<br />
18% 19%<br />
18%<br />
16%<br />
16%<br />
13% 11%<br />
10%<br />
8%<br />
7%<br />
8%<br />
4%<br />
13%<br />
11%<br />
0%<br />
Using Cueing Systems<br />
Connecting to Prior Knowledge Making Inferences/Predictions,<br />
Drawing Conclusions<br />
Noting Key Ideas <strong>and</strong> Finding<br />
Support<br />
Summarizing/ Recalling/<br />
Organizing Information<br />
9%<br />
Recognizing Author's Message<br />
<strong>and</strong> Craft<br />
100<br />
Figure 25: Métis Students 2009<br />
90<br />
80<br />
70<br />
68%<br />
60<br />
50<br />
40<br />
30<br />
20<br />
10<br />
28%<br />
14%<br />
21%<br />
38%<br />
40%<br />
20%<br />
10%<br />
30%<br />
53%<br />
21%<br />
14%<br />
13%<br />
15%<br />
13%<br />
5%<br />
36%<br />
24%<br />
21%<br />
20%<br />
48%<br />
14%<br />
10%<br />
28%<br />
0<br />
Using Cueing Systems<br />
Connecting to Prior Knowledge Making Inferences/Predictions,<br />
Drawing Conclusions<br />
Noting Key Ideas <strong>and</strong> Finding<br />
Support<br />
Summarizing/ Recalling/<br />
Organizing Information<br />
Recognizing Author's Message<br />
<strong>and</strong> Craft<br />
Figure 26: Non-<strong>First</strong> <strong>Nations</strong> Reading or Métis Strategies Students 2009<br />
100<br />
90<br />
80<br />
70<br />
60<br />
50<br />
48%<br />
46%<br />
50%<br />
40<br />
30<br />
20<br />
10<br />
23%<br />
12%<br />
17%<br />
21%<br />
13%<br />
21%<br />
33%<br />
20%<br />
21%<br />
26%<br />
14%<br />
28%<br />
7%<br />
24%<br />
19%<br />
21%<br />
36%<br />
30%<br />
17%<br />
18%<br />
36%<br />
0<br />
Using Cueing Systems<br />
Connecting to Prior Knowledge Making Inferences/Predictions,<br />
Drawing Conclusions<br />
Noting Key Ideas <strong>and</strong> Finding<br />
Support<br />
Summarizing/ Recalling/<br />
Organizing Information<br />
Recognizing Author's Message<br />
<strong>and</strong> Craft<br />
Page 23
Assessment for Learning: Grade 7 Reading (2007 <strong>and</strong> 2009)<br />
Performance Outcomes by Reading Strategy: Analysis by Ethnicity<br />
Data Note: St<strong>and</strong>ards were set by a panel of teachers <strong>and</strong> academics with language arts <strong>and</strong> reading skill development <strong>and</strong> teaching<br />
expertise. The panel deliberated over the nature <strong>and</strong> difficulty of each assessment item, considered the learning environment <strong>and</strong> assessment<br />
context, <strong>and</strong> discussed rationale for their judgments. To help interpret how well students did in performance areas, two st<strong>and</strong>ards were set:<br />
one for adequate or higher performance, <strong>and</strong> one for proficient or higher performance. (Ministry of Education)<br />
Percentage of Grade 7 Students Achieving Adequate or Proficient St<strong>and</strong>ards<br />
100<br />
90<br />
80<br />
Adequate St<strong>and</strong>ard<br />
Proficient St<strong>and</strong>ard<br />
Figure 27: <strong>First</strong> <strong>Nations</strong> Students<br />
2007<br />
70<br />
60<br />
50<br />
40<br />
30<br />
35%<br />
53%<br />
37%<br />
46%<br />
14%<br />
58%<br />
20<br />
10<br />
33%<br />
31%<br />
25%<br />
30%<br />
25%<br />
16%<br />
0<br />
Using Cueing Systems<br />
Connecting to Prior<br />
Knowledge<br />
Making<br />
Inferences/Predictions,<br />
Drawing Conclusions<br />
Noting Key Ideas <strong>and</strong><br />
Finding Support<br />
Summarizing/ Recalling/<br />
Organizing Information<br />
Recognizing Author's<br />
Message <strong>and</strong> Craft<br />
100<br />
90<br />
Adequate St<strong>and</strong>ard<br />
Proficient St<strong>and</strong>ard<br />
Reading Strategies<br />
Figure 28: Métis Students<br />
2007<br />
80<br />
70<br />
21%<br />
26%<br />
32%<br />
60<br />
50<br />
33%<br />
18%<br />
58%<br />
40<br />
30<br />
20<br />
10<br />
67%<br />
63%<br />
42%<br />
54%<br />
43%<br />
26%<br />
0<br />
Using Cueing Systems<br />
Connecting to Prior<br />
Knowledge<br />
Making<br />
Inferences/Predictions,<br />
Drawing Conclusions<br />
Noting Key Ideas <strong>and</strong><br />
Finding Support<br />
Summarizing/ Recalling/<br />
Organizing Information<br />
Recognizing Author's<br />
Message <strong>and</strong> Craft<br />
100<br />
90<br />
80<br />
70<br />
60<br />
Adequate St<strong>and</strong>ard<br />
Proficient St<strong>and</strong>ard<br />
24%<br />
28%<br />
29%<br />
Reading Strategies<br />
36%<br />
Figure 29: Non-<strong>First</strong> <strong>Nations</strong> or Métis Students<br />
17%<br />
46%<br />
2007<br />
50<br />
40<br />
30<br />
20<br />
69%<br />
68%<br />
59%<br />
57%<br />
55%<br />
47%<br />
10<br />
0<br />
Using Cueing Systems<br />
Connecting to Prior<br />
Knowledge<br />
Making<br />
Inferences/Predictions,<br />
Drawing Conclusions<br />
Noting Key Ideas <strong>and</strong><br />
Finding Support<br />
Summarizing/ Recalling/<br />
Organizing Information<br />
Recognizing Author's<br />
Message <strong>and</strong> Craft<br />
Page 24<br />
Reading Strategies
Data Note: The numbers in each graph indicate the percentage of students at each st<strong>and</strong>ard.<br />
100<br />
90<br />
Adequate St<strong>and</strong>ard<br />
Proficient St<strong>and</strong>ard<br />
Figure 30: <strong>First</strong> <strong>Nations</strong> Students<br />
2009<br />
80<br />
70<br />
60<br />
50<br />
40<br />
30<br />
20<br />
10<br />
0<br />
26%<br />
34%<br />
34%<br />
8%<br />
33%<br />
16%<br />
41%<br />
7%<br />
35%<br />
31%<br />
36%<br />
20%<br />
Using Cueing Systems<br />
Connecting to Prior<br />
Knowledge<br />
Making<br />
Inferences/Predictions,<br />
Drawing Conclusions<br />
Noting Key Ideas <strong>and</strong><br />
Finding Support<br />
Summarizing/ Recalling/<br />
Organizing Information<br />
Recognizing Author's<br />
Message <strong>and</strong> Craft<br />
100<br />
90<br />
Adequate St<strong>and</strong>ard<br />
Proficient St<strong>and</strong>ard<br />
Reading Strategies<br />
Figure 31: Métis Students<br />
2009<br />
80<br />
70<br />
60<br />
50<br />
40<br />
25%<br />
30%<br />
52%<br />
54%<br />
47%<br />
34%<br />
30<br />
59%<br />
20<br />
10<br />
30%<br />
26%<br />
17%<br />
40%<br />
38%<br />
0<br />
Using Cueing Systems<br />
Connecting to Prior<br />
Knowledge<br />
Making<br />
Inferences/Predictions,<br />
Drawing Conclusions<br />
Noting Key Ideas <strong>and</strong><br />
Finding Support<br />
Summarizing/ Recalling/<br />
Organizing Information<br />
Recognizing Author's<br />
Message <strong>and</strong> Craft<br />
Reading Strategies<br />
100<br />
90<br />
Adequate St<strong>and</strong>ard<br />
Proficient St<strong>and</strong>ard<br />
Figure 32: Non-<strong>First</strong> <strong>Nations</strong> or Métis Students<br />
2009<br />
80<br />
70<br />
60<br />
50<br />
20%<br />
34%<br />
37%<br />
41%<br />
29%<br />
32%<br />
40<br />
30<br />
20<br />
64%<br />
46%<br />
47%<br />
36%<br />
57%<br />
54%<br />
10<br />
0<br />
Using Cueing Systems<br />
Connecting to Prior<br />
Knowledge<br />
Making<br />
Inferences/Predictions,<br />
Drawing Conclusions<br />
Noting Key Ideas <strong>and</strong><br />
Finding Support<br />
Summarizing/ Recalling/<br />
Organizing Information<br />
Recognizing Author's<br />
Message <strong>and</strong> Craft<br />
Reading Strategies<br />
Page 25
Assessment for Learning: Grade 10 Reading (2007 <strong>and</strong> 2009)<br />
Achievement Scores by Reading Strategy: Analysis by Ethnicity<br />
Data Note: The numbers in each graph indicate the percentage of students at each school division benchmark.<br />
100<br />
90<br />
80<br />
Figure 33: <strong>First</strong> <strong>Nations</strong> Students<br />
91%<br />
2007<br />
70<br />
60<br />
50<br />
40<br />
30<br />
20<br />
10<br />
0<br />
51%<br />
21% 21%<br />
15<br />
Using Cueing Systems<br />
32%<br />
23%<br />
42%<br />
12<br />
Connecting to Prior<br />
Knowledge<br />
11%<br />
5%<br />
3<br />
Making<br />
Inferences/Predictions,<br />
Drawing Conclusions<br />
63%<br />
18%<br />
1%3<br />
Noting Key Ideas <strong>and</strong><br />
Finding Support<br />
65%<br />
19%<br />
15 15<br />
1%0<br />
Summarizing/ Recalling/<br />
Organizing Information<br />
59%<br />
25% 24%<br />
2<br />
Recognizing Author's<br />
Message <strong>and</strong> Craft<br />
100<br />
90<br />
Figure 34: Métis Students 2007<br />
80<br />
70<br />
60<br />
53%<br />
50<br />
40<br />
30<br />
20<br />
10<br />
0<br />
36%<br />
26%<br />
15%<br />
12%<br />
Using Cueing Systems<br />
23%<br />
17%<br />
34%<br />
15%<br />
Connecting to Prior<br />
Knowledge<br />
13%<br />
8%<br />
15%<br />
Making<br />
Inferences/Predictions,<br />
Drawing Conclusions<br />
40%<br />
10%<br />
19% 20%<br />
Noting Key Ideas <strong>and</strong><br />
Finding Support<br />
37%<br />
9%<br />
17%<br />
26%<br />
Summarizing/ Recalling/<br />
Organizing Information<br />
39%<br />
20%<br />
29%<br />
1%<br />
Recognizing Author's<br />
Message <strong>and</strong> Craft<br />
100<br />
90<br />
Figure 35: Non-<strong>First</strong> <strong>Nations</strong> or Métis Students 2007<br />
80<br />
70<br />
60<br />
50<br />
40<br />
30<br />
20<br />
10<br />
42%<br />
25%<br />
17% 16%<br />
18%<br />
12%<br />
47%<br />
23%<br />
43%<br />
25%<br />
18%<br />
14%<br />
31%<br />
22%<br />
15%<br />
31%<br />
25%<br />
16% 15%<br />
44%<br />
39%<br />
32%<br />
27%<br />
3%<br />
0<br />
Using Cueing Systems<br />
Connecting to Prior<br />
Knowledge<br />
Making<br />
Inferences/Predictions,<br />
Drawing Conclusions<br />
Noting Key Ideas <strong>and</strong><br />
Finding Support<br />
Summarizing/ Recalling/<br />
Organizing Information<br />
Recognizing Author's<br />
Message <strong>and</strong> Craft<br />
Page 26
100<br />
90<br />
80<br />
Figure 36: <strong>First</strong> <strong>Nations</strong> Students<br />
<strong>School</strong> <strong>Division</strong> Benchmarks Green Zone<br />
Green Zone 80% to 100%<br />
Above Grade Level Expectation<br />
Blue Zone 65% to 79%<br />
At Grade Level Expectation<br />
Yellow Zone 56% to 64%<br />
Slightly Below Grade Level Expectation<br />
Red Zone 0% to 55%<br />
Below Grade Level Expectation<br />
2009<br />
70<br />
60<br />
53%<br />
57%<br />
50<br />
40<br />
30<br />
20<br />
10<br />
35% 33%<br />
21%<br />
11%<br />
31% 31%<br />
21%<br />
17%<br />
29%<br />
14%<br />
5%<br />
39%<br />
25% 25%<br />
12%<br />
42%<br />
25%<br />
19%<br />
14%<br />
18% 16%<br />
9%<br />
0<br />
Using Cueing Systems<br />
Connecting to Prior<br />
Knowledge<br />
Making<br />
Inferences/Predictions,<br />
Drawing Conclusions<br />
Noting Key Ideas <strong>and</strong><br />
Finding Support<br />
Summarizing/ Recalling/<br />
Organizing Information<br />
Recognizing Author's<br />
Message <strong>and</strong> Craft<br />
100<br />
90<br />
80<br />
Figure 37: Métis Students 2009<br />
70<br />
60<br />
50<br />
40<br />
30<br />
20<br />
10<br />
38%<br />
34%<br />
18%<br />
10%<br />
22%<br />
17%<br />
12%<br />
49%<br />
41%<br />
25% 24%<br />
10%<br />
18% 20%<br />
16%<br />
46%<br />
14% 15%<br />
46%<br />
25%<br />
27%<br />
24%<br />
15%<br />
34%<br />
0<br />
Using Cueing Systems<br />
Connecting to Prior<br />
Knowledge<br />
Making<br />
Inferences/Predictions,<br />
Drawing Conclusions<br />
Noting Key Ideas <strong>and</strong><br />
Finding Support<br />
Summarizing/ Recalling/<br />
Organizing Information<br />
Recognizing Author's<br />
Message <strong>and</strong> Craft<br />
100<br />
Figure 38: Non-<strong>First</strong> <strong>Nations</strong> or Métis Students 2009<br />
90<br />
80<br />
70<br />
60<br />
50<br />
40<br />
30<br />
20<br />
10<br />
12%<br />
9%<br />
32%<br />
47%<br />
59%<br />
16%<br />
13% 12%<br />
32%<br />
29%<br />
19% 21%<br />
54%<br />
19%<br />
15%<br />
11%<br />
43%<br />
38%<br />
10% 10%<br />
36%<br />
22%<br />
20% 22%<br />
0<br />
Using Cueing Systems<br />
Connecting to Prior<br />
Knowledge<br />
Making<br />
Inferences/Predictions,<br />
Drawing Conclusions<br />
Noting Key Ideas <strong>and</strong><br />
Finding Support<br />
Summarizing/ Recalling/<br />
Organizing Information<br />
Recognizing Author's<br />
Message <strong>and</strong> Craft<br />
Page 27
Assessment for Learning: Grade 10 Reading (2007 <strong>and</strong> 2009)<br />
Performance Outcomes by Reading Strategy: Analysis by Ethnicity<br />
Data Note: St<strong>and</strong>ards were set by a panel of teachers <strong>and</strong> academics with language arts <strong>and</strong> reading skill development <strong>and</strong> teaching<br />
expertise. The panel deliberated over the nature <strong>and</strong> difficulty of each assessment item, considered the learning environment <strong>and</strong> assessment<br />
context, <strong>and</strong> discussed rationale for their judgments. To help interpret how well students did in performance areas, two st<strong>and</strong>ards were set:<br />
one for adequate or higher performance, <strong>and</strong> one for proficient or higher performance. (Ministry of Education)<br />
100<br />
90<br />
Adequate St<strong>and</strong>ard<br />
Proficient St<strong>and</strong>ard<br />
Figure 39: <strong>First</strong> <strong>Nations</strong> Students<br />
2007<br />
80<br />
70<br />
60<br />
50<br />
40<br />
31%<br />
21%<br />
32%<br />
36%<br />
41%<br />
30<br />
20<br />
10<br />
35%<br />
50%<br />
22%<br />
17%<br />
43%<br />
41%<br />
24%<br />
0<br />
Using Cueing Systems<br />
Connecting to Prior<br />
Knowledge<br />
Making<br />
Inferences/Predictions,<br />
Drawing Conclusions<br />
Noting Key Ideas <strong>and</strong><br />
Finding Support<br />
Summarizing/ Recalling/<br />
Organizing Information<br />
Recognizing Author's<br />
Message <strong>and</strong> Craft<br />
100<br />
90<br />
Adequate St<strong>and</strong>ard<br />
Proficient St<strong>and</strong>ard<br />
Reading Strategies<br />
Figure 40: Métis Students<br />
2007<br />
80<br />
70<br />
25%<br />
26%<br />
28%<br />
26%<br />
60<br />
50<br />
16%<br />
45%<br />
40<br />
30<br />
20<br />
57%<br />
55%<br />
40%<br />
55%<br />
58%<br />
34%<br />
10<br />
0<br />
Using Cueing Systems<br />
Connecting to Prior<br />
Knowledge<br />
Making<br />
Inferences/Predictions,<br />
Drawing Conclusions<br />
Noting Key Ideas <strong>and</strong><br />
Finding Support<br />
Summarizing/ Recalling/<br />
Organizing Information<br />
Recognizing Author's<br />
Message <strong>and</strong> Craft<br />
100<br />
90<br />
80<br />
Adequate St<strong>and</strong>ard<br />
Proficient St<strong>and</strong>ard<br />
24%<br />
17%<br />
Reading Strategies<br />
24%<br />
Figure 41: Non-<strong>First</strong> <strong>Nations</strong> or Métis Students<br />
17%<br />
2007<br />
70<br />
60<br />
12%<br />
46%<br />
50<br />
40<br />
30<br />
20<br />
67%<br />
71%<br />
57%<br />
69%<br />
75%<br />
42%<br />
10<br />
0<br />
Using Cueing Systems<br />
Connecting to Prior<br />
Knowledge<br />
Making<br />
Inferences/Predictions,<br />
Drawing Conclusions<br />
Noting Key Ideas <strong>and</strong><br />
Finding Support<br />
Summarizing/ Recalling/<br />
Organizing Information<br />
Recognizing Author's<br />
Message <strong>and</strong> Craft<br />
Reading Strategies<br />
Page 28
Data Note: The numbers in each graph indicate the percentage of students at each st<strong>and</strong>ard.<br />
100<br />
90<br />
80<br />
Adequate St<strong>and</strong>ard<br />
Proficient St<strong>and</strong>ard<br />
Figure 42: <strong>First</strong> <strong>Nations</strong> Students<br />
2009<br />
70<br />
60<br />
50<br />
40<br />
42 21<br />
57<br />
39<br />
19<br />
41<br />
30<br />
20<br />
10<br />
0<br />
100<br />
90<br />
35<br />
Using Cueing Systems<br />
Adequate St<strong>and</strong>ard<br />
Proficient St<strong>and</strong>ard<br />
47<br />
Connecting to Prior<br />
Knowledge<br />
19<br />
Making<br />
Inferences/Predictions,<br />
Drawing Conclusions<br />
Percentage of Grade 10 Students Achieving Adequate or Proficient St<strong>and</strong>ards<br />
Reading Strategies<br />
36<br />
Noting Key Ideas <strong>and</strong><br />
Finding Support<br />
57<br />
Summarizing/ Recalling/<br />
Organizing Information<br />
25<br />
Recognizing Author's<br />
Message <strong>and</strong> Craft<br />
Figure 43: Métis Students<br />
2009<br />
80<br />
70<br />
60<br />
50<br />
43%<br />
12%<br />
46%<br />
29%<br />
15%<br />
34%<br />
40<br />
30<br />
20<br />
10<br />
47%<br />
71%<br />
34%<br />
62%<br />
71%<br />
49%<br />
0<br />
Using Cueing Systems<br />
Connecting to Prior<br />
Knowledge<br />
Making<br />
Inferences/Predictions,<br />
Drawing Conclusions<br />
Noting Key Ideas <strong>and</strong><br />
Finding Support<br />
Summarizing/ Recalling/<br />
Organizing Information<br />
Recognizing Author's<br />
Message <strong>and</strong> Craft<br />
100<br />
90<br />
80<br />
70<br />
60<br />
Adequate St<strong>and</strong>ard<br />
Proficient St<strong>and</strong>ard<br />
27%<br />
12%<br />
48%<br />
Reading Strategies<br />
19%<br />
Figure 44: Non-<strong>First</strong> <strong>Nations</strong> or Métis Students<br />
10%<br />
32%<br />
2009<br />
50<br />
40<br />
30<br />
20<br />
65%<br />
75%<br />
40%<br />
74%<br />
80%<br />
58%<br />
10<br />
0<br />
Using Cueing Systems<br />
Connecting to Prior<br />
Knowledge<br />
Making<br />
Inferences/Predictions,<br />
Drawing Conclusions<br />
Noting Key Ideas <strong>and</strong><br />
Finding Support<br />
Summarizing/ Recalling/<br />
Organizing Information<br />
Recognizing Author's<br />
Message <strong>and</strong> Craft<br />
Reading Strategies<br />
Page 29
Common Mathematics Assessment: 2008-2009<br />
Percent of Correct Answers: Analysis by Ethnicity<br />
Data Note: 2008-2009 was the first year the Common Mathematics Assessment was administered to students. The numbers in each graph<br />
indicate the percentage of correct answers for each mathematic str<strong>and</strong>.<br />
Figure 45: Common Mathematics Assessment (2008-2009): Grade 1<br />
<strong>First</strong> <strong>Nations</strong> <strong>and</strong> Métis Students<br />
Non <strong>First</strong> <strong>Nations</strong> <strong>and</strong> Métis Students<br />
Percent of Correct Answers<br />
100<br />
90<br />
80<br />
70<br />
60<br />
50<br />
40<br />
30<br />
20<br />
61%<br />
70%<br />
62%<br />
69%<br />
77%<br />
Percent of Correct Answers<br />
100<br />
90<br />
80<br />
70<br />
60<br />
50<br />
40<br />
30<br />
20<br />
71%<br />
83%<br />
81%<br />
88%<br />
90%<br />
10<br />
10<br />
0<br />
0<br />
Numbers<br />
Patterns <strong>and</strong><br />
Relations<br />
Oral Numbers<br />
Oral Patterns<br />
<strong>and</strong> Relations<br />
Oral Shape <strong>and</strong><br />
Space<br />
Numbers<br />
Patterns <strong>and</strong><br />
Relations<br />
Oral Numbers<br />
Oral Patterns<br />
<strong>and</strong> Relations<br />
Oral Shape <strong>and</strong><br />
Space<br />
Figure 46: Common Mathematics Assessment (2008-2009): Grade 2<br />
Percent of Correct Answers<br />
100<br />
90<br />
80<br />
70<br />
60<br />
50<br />
40<br />
30<br />
20<br />
63%<br />
<strong>First</strong> <strong>Nations</strong> <strong>and</strong> Métis Students<br />
83%<br />
78%<br />
77%<br />
59%<br />
58%<br />
62%<br />
Percent of Correct Answers<br />
100<br />
90<br />
80<br />
70<br />
60<br />
50<br />
40<br />
30<br />
20<br />
Non <strong>First</strong> <strong>Nations</strong> <strong>and</strong> Métis Students<br />
91% 91%<br />
94%<br />
80%<br />
73% 71%<br />
78%<br />
10<br />
10<br />
0<br />
Numbers<br />
Patterns <strong>and</strong><br />
Relations<br />
Shape <strong>and</strong><br />
Space<br />
Statistics<br />
<strong>and</strong><br />
Probability<br />
Oral<br />
Numbers<br />
Oral Oral Shape<br />
Patterns <strong>and</strong> <strong>and</strong> Space<br />
Relations<br />
Percent of Correct Answers<br />
100<br />
90<br />
80<br />
70<br />
60<br />
50<br />
40<br />
30<br />
20<br />
10<br />
Figure 47: Common Mathematics Assessment (2008-2009): Grade 3<br />
<strong>First</strong> <strong>Nations</strong> <strong>and</strong> Métis Students<br />
51%<br />
51% 52%<br />
44%<br />
Percent of Correct Answers<br />
100<br />
90<br />
80<br />
70<br />
60<br />
50<br />
40<br />
30<br />
20<br />
10<br />
Non <strong>First</strong> <strong>Nations</strong> <strong>and</strong> Métis Students<br />
67%<br />
64%<br />
57%<br />
74%<br />
0<br />
0<br />
Numbers<br />
Patterns <strong>and</strong><br />
Relations<br />
Shape <strong>and</strong> Space<br />
Statistics <strong>and</strong><br />
Probability<br />
Numbers<br />
Patterns <strong>and</strong><br />
Relations<br />
Shape <strong>and</strong> Space<br />
Statistics <strong>and</strong><br />
Probability<br />
100<br />
90<br />
Figure 48: Common Mathematics Assessment (2008-2009): Grade 4<br />
<strong>First</strong> <strong>Nations</strong> <strong>and</strong> Métis Students<br />
100<br />
90<br />
Non <strong>First</strong> <strong>Nations</strong> <strong>and</strong> Métis Students<br />
Percent of Correct Answers<br />
80<br />
70<br />
60<br />
50<br />
40<br />
30<br />
20<br />
52%<br />
49%<br />
50%<br />
42%<br />
Percent of Correct Answers<br />
80<br />
70<br />
60<br />
50<br />
40<br />
30<br />
20<br />
70%<br />
67%<br />
69%<br />
67%<br />
10<br />
10<br />
0<br />
0<br />
Numbers<br />
Patterns <strong>and</strong><br />
Relations<br />
Shape <strong>and</strong> Space<br />
Statistics <strong>and</strong><br />
Probability<br />
Numbers<br />
Patterns <strong>and</strong><br />
Relations<br />
Shape <strong>and</strong> Space<br />
Statistics <strong>and</strong><br />
Probability<br />
Page 30
Percent of Correct Answers<br />
100<br />
90<br />
80<br />
70<br />
60<br />
50<br />
40<br />
30<br />
20<br />
10<br />
Figure 49: Common Mathematics Assessment (2008-2009): Grade 5<br />
<strong>First</strong> <strong>Nations</strong> <strong>and</strong> Métis Students<br />
58% 56%<br />
50%<br />
43%<br />
Percent of Correct Answers<br />
100<br />
90<br />
80<br />
70<br />
60<br />
50<br />
40<br />
30<br />
20<br />
10<br />
Non <strong>First</strong> <strong>Nations</strong> <strong>and</strong> Métis Students<br />
71% 71%<br />
59%<br />
65%<br />
0<br />
0<br />
Numbers<br />
Patterns <strong>and</strong><br />
Relations<br />
Shape <strong>and</strong> Space<br />
Statistics <strong>and</strong><br />
Probability<br />
Numbers<br />
Patterns <strong>and</strong><br />
Relations<br />
Shape <strong>and</strong> Space<br />
Statistics <strong>and</strong><br />
Probability<br />
100<br />
90<br />
Figure 50: Common Mathematics Assessment (2008-2009): Grade 6<br />
<strong>First</strong> <strong>Nations</strong> <strong>and</strong> Métis Students<br />
100<br />
90<br />
Non <strong>First</strong> <strong>Nations</strong> <strong>and</strong> Métis Students<br />
Percent of Correct Answers<br />
80<br />
70<br />
60<br />
50<br />
40<br />
30<br />
20<br />
42%<br />
40%<br />
39%<br />
35%<br />
Percent of Correct Answers<br />
80<br />
70<br />
60<br />
50<br />
40<br />
30<br />
20<br />
60%<br />
60%<br />
55%<br />
50%<br />
10<br />
10<br />
0<br />
0<br />
Numbers<br />
Patterns <strong>and</strong><br />
Relations<br />
Shape <strong>and</strong> Space<br />
Statistics <strong>and</strong><br />
Probability<br />
Numbers<br />
Patterns <strong>and</strong><br />
Relations<br />
Shape <strong>and</strong> Space<br />
Statistics <strong>and</strong><br />
Probability<br />
100<br />
90<br />
Figure 51: Common Mathematics Assessment (2008-2009): Grade 7<br />
<strong>First</strong> <strong>Nations</strong> <strong>and</strong> Métis Students<br />
100<br />
90<br />
Non <strong>First</strong> <strong>Nations</strong> <strong>and</strong> Métis Students<br />
Percent of Correct Answers<br />
80<br />
70<br />
60<br />
50<br />
40<br />
30<br />
20<br />
47%<br />
46%<br />
37%<br />
42%<br />
42%<br />
Percent of Correct Answers<br />
80<br />
70<br />
60<br />
50<br />
40<br />
30<br />
20<br />
61%<br />
62%<br />
51%<br />
62%<br />
62%<br />
10<br />
10<br />
0<br />
100<br />
90<br />
Numbers<br />
Patterns <strong>and</strong><br />
Relations<br />
Shape <strong>and</strong><br />
Space<br />
Statistics <strong>and</strong><br />
Probability<br />
No Calculator<br />
0<br />
Numbers<br />
Patterns <strong>and</strong><br />
Relations<br />
Shape <strong>and</strong><br />
Space<br />
Figure 52: Common Mathematics Assessment (2008-2009): Grade 8<br />
<strong>First</strong> <strong>Nations</strong> <strong>and</strong> Métis Students<br />
100<br />
90<br />
Statistics <strong>and</strong><br />
Probability<br />
Non <strong>First</strong> <strong>Nations</strong> <strong>and</strong> Métis Students<br />
No Calculator<br />
Percent of Correct Answers<br />
80<br />
70<br />
60<br />
50<br />
40<br />
30<br />
20<br />
39%<br />
36%<br />
39%<br />
30%<br />
50%<br />
Percent of Correct Answers<br />
80<br />
70<br />
60<br />
50<br />
40<br />
30<br />
20<br />
54 53 55<br />
49<br />
63<br />
10<br />
10<br />
0<br />
0<br />
Numbers<br />
Patterns <strong>and</strong><br />
Relations<br />
Shape <strong>and</strong><br />
Space<br />
Statistics <strong>and</strong><br />
Probability<br />
No Calculator<br />
Numbers<br />
Patterns <strong>and</strong><br />
Relations<br />
Shape <strong>and</strong><br />
Space<br />
Statistics <strong>and</strong><br />
Probability<br />
No Calculator<br />
<strong>School</strong> <strong>Division</strong> Benchmarks<br />
Green Zone 80% to 100%<br />
Above Grade Level Expectation<br />
Blue Zone 65% to 79%<br />
At Grade Level Expectation<br />
Yellow Zone 56% to 64%<br />
Slightly Below Grade Level Expectation<br />
Red Zone 0% to 55%<br />
Below Grade Level Expectation<br />
Page 31