New Listings Inventory Monthly Market Detail - June 2014 Single Family Homes Bay County Association of REALTORS® This report describes member activity for the association and is not confined to any specific geographic area. New Listings by Initial Listing Price The number of properties put onto the market during the month Economists' note: In a recovering market, we expect that new listings will eventually rise as sellers raise their estimations of value. But this increase will take place only after the market has turned up, so New Listings are a lagging indicator of the health of the market. Also be aware of properties which have been withdrawn from the market and then relisted. These are not really New Listings. 80 70 60 50 40 30 20 10 0 Less than $50,000 June 2013 June 2014 $50,000 - $99,999 $100,000 - $149,999 $150,000 - $199,999 $200,000 - $249,999 $250,000 - $299,999 Initial Listing Price New Listings Percent Change Year-over-Year Less than $50,000 16 33.3% $50,000 - $99,999 45 21.6% $100,000 - $149,999 60 30.4% $150,000 - $199,999 71 31.5% $200,000 - $249,999 49 19.5% $250,000 - $299,999 61 103.3% $300,000 - $399,999 34 21.4% $400,000 - $599,999 22 37.5% $600,000 - $999,999 6 -53.8% $1,000,000 or more 7 16.7% $300,000 - $399,999 $400,000 - $599,999 $600,000 - $999,999 $1,000,000 or more 80 70 60 50 40 30 20 10 0 Inventory by Current Listing Price The number of property listings active at the end of the month Economists' note: There are a number of ways to calculate Inventory, so these numbers may not match up to others you see in your market. We calculate Inventory by counting the number of active listings on the last day of the month, and hold this number to compare with the same month the following year. 300 250 200 150 100 50 0 Less than $50,000 June 2013 June 2014 $50,000 - $99,999 $100,000 - $149,999 $150,000 - $199,999 $200,000 - $249,999 $250,000 - $299,999 Current Listing Price Inventory Percent Change Year-over-Year Less than $50,000 61 32.6% $50,000 - $99,999 181 0.6% $100,000 - $149,999 223 8.3% $150,000 - $199,999 250 12.6% $200,000 - $249,999 196 12.6% $250,000 - $299,999 187 14.7% $300,000 - $399,999 189 14.5% $400,000 - $599,999 121 37.5% $600,000 - $999,999 94 16.0% $1,000,000 or more 78 59.2% $300,000 - $399,999 $400,000 - $599,999 $600,000 - $999,999 $1,000,000 or more 300 250 200 150 100 50 0 Produced by Florida REALTORS® with data provided by Florida's multiple listing services. Statistics for each month compiled from MLS feeds on the 15th day of the following month. Data released on Tuesday, July 22, 2014. Next data release is Thursday, August 21, 2014.
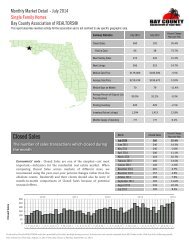
<strong>Closed</strong> <strong>Sales</strong> Median Sale Price Monthly Distressed Market - June 2014 Single Family Homes Bay County Association of REALTORS® This report describes member activity for the association and is not confined to any specific geographic area. June 2014 June 2013 Percent Change Year-over-Year Traditional <strong>Closed</strong> <strong>Sales</strong> Median Sale Price 191 152 25.7% $185,000 $178,700 3.5% Foreclosure/REO <strong>Closed</strong> <strong>Sales</strong> Median Sale Price 44 40 10.0% $88,500 $133,000 -33.5% Short Sale <strong>Closed</strong> <strong>Sales</strong> Median Sale Price 5 18 -72.2% $174,000 $166,000 4.8% 100% 90% 80% 70% 60% 50% 40% 30% 20% 10% 0% $250,000 2010 2011 2012 2013 Traditional Foreclosure/REO Short Sale J F M A M J J A S O N D J F M A M J J A S O N D J F M A M J J A S O N D J F M A M J J A S O N D J F M A M J $200,000 $150,000 $100,000 $50,000 $0 J F M A M J J A S O N D J F M A M J J A S O N D J F M A M J J A S O N D J F M A M J J A S O N D J F M A M J 2010 2011 2012 2013 Produced by Florida REALTORS® with data provided by Florida's multiple listing services. Statistics for each month compiled from MLS feeds on the 15th day of the following month. Data released on Tuesday, July 22, 2014. Next data release is Thursday, August 21, 2014.