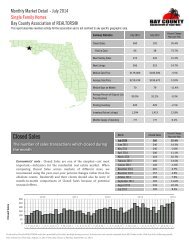
Closed Sales

Create successful ePaper yourself
Turn your PDF publications into a flip-book with our unique Google optimized e-Paper software.
Pending <strong>Sales</strong><br />
New Listings<br />
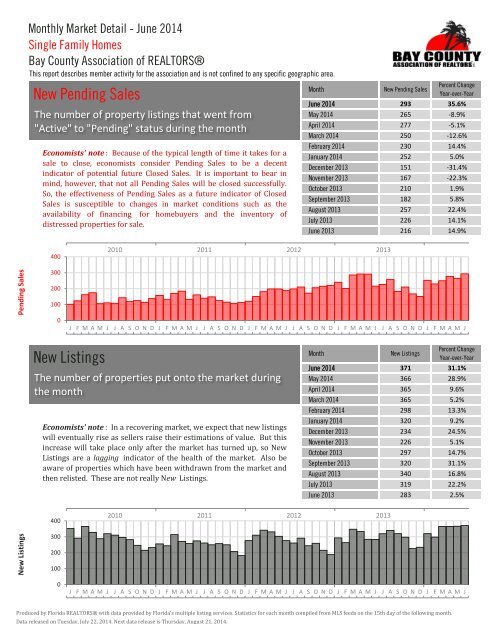
Monthly Market Detail - June 2014<br />
Single Family Homes<br />
Bay County Association of REALTORS®<br />
This report describes member activity for the association and is not confined to any specific geographic area.<br />
New Pending <strong>Sales</strong><br />
The number of property listings that went from<br />
"Active" to "Pending" status during the month<br />
Economists' note : Because of the typical length of time it takes for a<br />
sale to close, economists consider Pending <strong>Sales</strong> to be a decent<br />
indicator of potential future <strong>Closed</strong> <strong>Sales</strong>. It is important to bear in<br />
mind, however, that not all Pending <strong>Sales</strong> will be closed successfully.<br />
So, the effectiveness of Pending <strong>Sales</strong> as a future indicator of <strong>Closed</strong><br />
<strong>Sales</strong> is susceptible to changes in market conditions such as the<br />
availability of financing for homebuyers and the inventory of<br />
distressed properties for sale.<br />
Month<br />
June 2014<br />
May 2014<br />
April 2014<br />
March 2014<br />
250<br />
February 2014 230<br />
January 2014<br />
December 2013<br />
November 2013<br />
October 2013<br />
September 2013<br />
August 2013<br />
July 2013<br />
June 2013<br />
New Pending <strong>Sales</strong><br />
293<br />
265<br />
277<br />
252<br />
151<br />
167<br />
210<br />
182<br />
257<br />
226<br />
216<br />
Percent Change<br />
Year-over-Year<br />
35.6%<br />
-8.9%<br />
-5.1%<br />
-12.6%<br />
14.4%<br />
5.0%<br />
-31.4%<br />
-22.3%<br />
1.9%<br />
5.8%<br />
22.4%<br />
14.1%<br />
14.9%<br />
400<br />
2010 2011 2012 2013<br />
300<br />
200<br />
100<br />
0<br />
J F M A M J J A S O N D J F M A M J J A S O N D J F M A M J J A S O N D J F M A M J J A S O N D J F M A M J<br />
New Listings<br />
The number of properties put onto the market during<br />
the month<br />
Economists' note : In a recovering market, we expect that new listings<br />
will eventually rise as sellers raise their estimations of value. But this<br />
increase will take place only after the market has turned up, so New<br />
Listings are a lagging indicator of the health of the market. Also be<br />
aware of properties which have been withdrawn from the market and<br />
then relisted. These are not really New Listings.<br />
Month<br />
June 2014<br />
May 2014<br />
April 2014<br />
March 2014<br />
February 2014<br />
January 2014<br />
December 2013<br />
November 2013<br />
October 2013<br />
September 2013<br />
August 2013<br />
July 2013<br />
June 2013<br />
New Listings<br />
371<br />
366<br />
365<br />
365<br />
298<br />
320<br />
234<br />
226<br />
297<br />
320<br />
340<br />
319<br />
283<br />
Percent Change<br />
Year-over-Year<br />
31.1%<br />
28.9%<br />
9.6%<br />
5.2%<br />
13.3%<br />
9.2%<br />
24.5%<br />
5.1%<br />
14.7%<br />
31.1%<br />
16.8%<br />
22.2%<br />
2.5%<br />
400<br />
2010 2011 2012 2013<br />
300<br />
200<br />
100<br />
0<br />
J F M A M J J A S O N D J F M A M J J A S O N D J F M A M J J A S O N D J F M A M J J A S O N D J F M A M J<br />
Produced by Florida REALTORS® with data provided by Florida's multiple listing services. Statistics for each month compiled from MLS feeds on the 15th day of the following month.<br />
Data released on Tuesday, July 22, 2014. Next data release is Thursday, August 21, 2014.