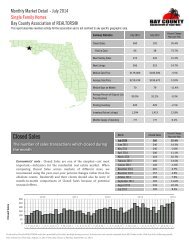
Closed Sales

You also want an ePaper? Increase the reach of your titles
YUMPU automatically turns print PDFs into web optimized ePapers that Google loves.
Median Days on<br />
Market<br />
Avg. Pct. of Orig.<br />
List Price<br />
Received<br />
Monthly Market Detail - June 2014<br />
Manufactured Homes<br />
Bay County Association of REALTORS®<br />
This report describes member activity for the association and is not confined to any specific geographic area.<br />
Median Days on Market<br />
The median number of days that properties sold during<br />
the month were on the market<br />
Economists' note : Median Days on Market is the amount of time the<br />
"middle" property selling this month was on the market. That is, 50%<br />
of homes selling this month took less time to sell, and 50% of homes<br />
took more time to sell. We use the median rather than the average<br />
because the median is not particularly sensitive to sales of homes that<br />
took an unusually large amount of time to sell relative to the vast<br />
majority of homes in the market.<br />
Month<br />
Median Days on<br />
Market<br />
Percent Change<br />
Year-over-Year<br />
June 2014 88 6.0%<br />
May 2014 94 88.0%<br />
April 2014 95 18.8%<br />
March 2014 86 -34.8%<br />
February 2014 48 -27.3%<br />
January 2014 103 66.1%<br />
December 2013 108 22.7%<br />
November 2013 60 -54.2%<br />
October 2013 86 -4.4%<br />
September 2013 110 31.0%<br />
August 2013 135 51.7%<br />
July 2013 75 -21.9%<br />
June 2013 83 -7.8%<br />
300<br />
250<br />
200<br />
150<br />
100<br />
50<br />
0<br />
2010 2011 2012 2013<br />
J F M A M J J A S O N D J F M A M J J A S O N D J F M A M J J A S O N D J F M A M J J A S O N D J F M A M J<br />
Average Percent of Original List Price Received<br />
The average of the sale price (as a percentage of the original list<br />
price) across all properties selling during the month<br />
Economists' note : The Average Percent of Original List Price Received<br />
is an indicator of market conditions, in that in a recovering market, the<br />
measure rises as buyers realize that the market may be moving away<br />
from them and they need to match the selling price (or better it) in<br />
order to get a contract on the house. This is usually the last measure to<br />
indicate a market that has shifted from down to up, and is another<br />
lagging indicator.<br />
Month<br />
Avg. Pct. of Orig. List<br />
Price Received<br />
Percent Change<br />
Year-over-Year<br />
June 2014 84.1% 1.1%<br />
May 2014 81.4% -0.9%<br />
April 2014 82.4% -4.7%<br />
March 2014 84.5% 10.5%<br />
February 2014 92.2% 5.5%<br />
January 2014 81.5% -1.8%<br />
December 2013 81.7% -0.2%<br />
November 2013 80.6% 6.6%<br />
October 2013 83.7% 2.7%<br />
September 2013 75.9% -5.6%<br />
August 2013 85.1% 0.6%<br />
July 2013 84.2% 0.4%<br />
June 2013 83.2% -3.9%<br />
95%<br />
90%<br />
85%<br />
80%<br />
75%<br />
70%<br />
65%<br />
2010 2011 2012 2013<br />
J F M A M J J A S O N D J F M A M J J A S O N D J F M A M J J A S O N D J F M A M J J A S O N D J F M A M J<br />
Produced by Florida REALTORS® with data provided by Florida's multiple listing services. Statistics for each month compiled from MLS feeds on the 15th day of the following month.<br />
Data released on Tuesday, July 22, 2014. Next data release is Thursday, August 21, 2014.