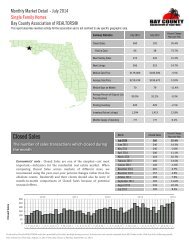
Closed Sales

Create successful ePaper yourself
Turn your PDF publications into a flip-book with our unique Google optimized e-Paper software.
<strong>Closed</strong> <strong>Sales</strong><br />
Monthly Market Detail - June 2014<br />
Manufactured Homes<br />
Bay County Association of REALTORS®<br />
This report describes member activity for the association and is not confined to any specific geographic area.<br />
Summary Statistics<br />
June 2014<br />
June 2013<br />
Percent Change<br />
Year-over-Year<br />
<strong>Closed</strong> <strong>Sales</strong><br />
Paid in Cash<br />
21 17 23.5%<br />
13 11 18.2%<br />
New Pending <strong>Sales</strong><br />
26<br />
27 -3.7%<br />
New Listings<br />
Median Sale Price<br />
29 31 -6.5%<br />
$60,000 $52,000 15.4%<br />
Average Sale Price<br />
$71,695<br />
$63,582 12.8%<br />
Median Days on Market<br />
88 83 6.0%<br />
Average Percent of Original List<br />
Price Received<br />
84.1%<br />
83.2%<br />
1.1%<br />
Pending Inventory<br />
Inventory (Active Listings)<br />
32<br />
202<br />
30 6.7%<br />
214 -5.6%<br />
Months Supply of Inventory 11.6<br />
14.6 -20.5%<br />
<strong>Closed</strong> <strong>Sales</strong><br />
The number of sales transactions which closed during<br />
the month<br />
Economists' note : <strong>Closed</strong> <strong>Sales</strong> are one of the simplest—yet most<br />
important—indicators for the residential real estate market. When<br />
comparing <strong>Closed</strong> <strong>Sales</strong> across markets of different sizes, we<br />
recommend using the year-over-year percent changes rather than the<br />
absolute counts. Realtors® and their clients should also be wary of<br />
month-to-month comparisons of <strong>Closed</strong> <strong>Sales</strong> because of potential<br />
seasonal effects.<br />
Month<br />
<strong>Closed</strong> <strong>Sales</strong><br />
Percent Change<br />
Year-over-Year<br />
June 2014<br />
21<br />
23.5%<br />
May 2014 29 26.1%<br />
April 2014 14<br />
40.0%<br />
March 2014<br />
February 2014<br />
January 2014<br />
December 2013<br />
November 2013<br />
October 2013<br />
21<br />
14<br />
11<br />
20<br />
16<br />
15<br />
200.0%<br />
16.7%<br />
-26.7%<br />
11.1%<br />
45.5%<br />
-16.7%<br />
September 2013 15<br />
7.1%<br />
August 2013<br />
July 2013<br />
12<br />
21<br />
-20.0%<br />
31.3%<br />
June 2013 17<br />
-22.7%<br />
40<br />
2010 2011 2012 2013<br />
30<br />
20<br />
10<br />
0<br />
J F M A M J J A S O N D J F M A M J J A S O N D J F M A M J J A S O N D J F M A M J J A S O N D J F M A M J<br />
Produced by Florida REALTORS® with data provided by Florida's multiple listing services. Statistics for each month compiled from MLS feeds on the 15th day of the following month.<br />
Data released on Tuesday, July 22, 2014. Next data release is Thursday, August 21, 2014.