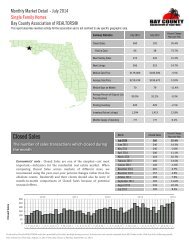
Closed Sales

You also want an ePaper? Increase the reach of your titles
YUMPU automatically turns print PDFs into web optimized ePapers that Google loves.
New Listings<br />
Inventory<br />
Monthly Market Detail - June 2014<br />
Townhouses and Condos<br />
Bay County Association of REALTORS®<br />
This report describes member activity for the association and is not confined to any specific geographic area.<br />
New Listings by Initial Listing Price<br />
The number of properties put onto the market during<br />
the month<br />
Economists' note: In a recovering market, we expect that new listings<br />
will eventually rise as sellers raise their estimations of value. But this<br />
increase will take place only after the market has turned up, so New<br />
Listings are a lagging indicator of the health of the market. Also be<br />
aware of properties which have been withdrawn from the market and<br />
then relisted. These are not really New Listings.<br />
45<br />
40<br />
35<br />
30<br />
25<br />
20<br />
15<br />
10<br />
5<br />
0<br />
Less than<br />
$50,000<br />
June 2013 June 2014<br />
$50,000 -<br />
$99,999<br />
$100,000 -<br />
$149,999<br />
$150,000 -<br />
$199,999<br />
$200,000 -<br />
$249,999<br />
$250,000 -<br />
$299,999<br />
Initial Listing Price<br />
New Listings<br />
Percent Change<br />
Year-over-Year<br />
Less than $50,000 5 66.7%<br />
$50,000 - $99,999 23 -4.2%<br />
$100,000 - $149,999 33 0.0%<br />
$150,000 - $199,999 40 42.9%<br />
$200,000 - $249,999 26 4.0%<br />
$250,000 - $299,999 23 -8.0%<br />
$300,000 - $399,999 30 66.7%<br />
$400,000 - $599,999 19 137.5%<br />
$600,000 - $999,999 3 200.0%<br />
$1,000,000 or more 1 N/A<br />
$300,000 -<br />
$399,999<br />
$400,000 -<br />
$599,999<br />
$600,000 -<br />
$999,999<br />
$1,000,000 or<br />
more<br />
45<br />
40<br />
35<br />
30<br />
25<br />
20<br />
15<br />
10<br />
5<br />
0<br />
Inventory by Current Listing Price<br />
The number of property listings active at the end of<br />
the month<br />
Economists' note: There are a number of ways to calculate Inventory,<br />
so these numbers may not match up to others you see in your market.<br />
We calculate Inventory by counting the number of active listings on the<br />
last day of the month, and hold this number to compare with the same<br />
month the following year.<br />
200<br />
150<br />
June 2013 June 2014<br />
Current Listing Price<br />
Inventory<br />
Percent Change<br />
Year-over-Year<br />
Less than $50,000 16 60.0%<br />
$50,000 - $99,999 102 -11.3%<br />
$100,000 - $149,999 158 6.0%<br />
$150,000 - $199,999 180 12.5%<br />
$200,000 - $249,999 129 18.3%<br />
$250,000 - $299,999 122 16.2%<br />
$300,000 - $399,999 189 37.0%<br />
$400,000 - $599,999 94 3.3%<br />
$600,000 - $999,999 26 -7.1%<br />
$1,000,000 or more 3 0.0%<br />
200<br />
150<br />
100<br />
100<br />
50<br />
50<br />
0<br />
Less than<br />
$50,000<br />
$50,000 -<br />
$99,999<br />
$100,000 -<br />
$149,999<br />
$150,000 -<br />
$199,999<br />
$200,000 -<br />
$249,999<br />
$250,000 -<br />
$299,999<br />
$300,000 -<br />
$399,999<br />
$400,000 -<br />
$599,999<br />
$600,000 -<br />
$999,999<br />
$1,000,000 or<br />
more<br />
0<br />
Produced by Florida REALTORS® with data provided by Florida's multiple listing services. Statistics for each month compiled from MLS feeds on the 15th day of the following month.<br />
Data released on Tuesday, July 22, 2014. Next data release is Thursday, August 21, 2014.