SRC Users' Meeting - Synchrotron Radiation Center - University of ...
SRC Users' Meeting - Synchrotron Radiation Center - University of ...
SRC Users' Meeting - Synchrotron Radiation Center - University of ...

Create successful ePaper yourself
Turn your PDF publications into a flip-book with our unique Google optimized e-Paper software.
the even layer thicknesses N = 6 and 8 in the same energy range. These peaks represent quantum<br />
well states formed by confinement <strong>of</strong> the Pb p-band electrons by the Si band gap. No such<br />
quantum well states exist for N = 6 and 8, as will be explained below.<br />
The appearance <strong>of</strong> intense peaks for odd N only has to do with the specific band structure<br />
<strong>of</strong> Pb and the Si band gap. From data taken over a wide thickness range, it is concluded that the<br />
Fermi level <strong>of</strong> the Pb is at 0.5 eV above the Si valence band edge. Electrons in the Pb film with<br />
binding energies within 0.5 eV <strong>of</strong> the Fermi level are thus confined by the Si band gap, giving<br />
rise to sharp and intense quantum well peaks. Electrons at higher binding energies are not<br />
confined. Nevertheless, partial reflection at the Pb-Si boundary can give rise to resonances which<br />
appear in photoemission as weak and broad peaks [3]. One such weak resonance peak at a<br />
binding energy <strong>of</strong> 0.63 eV can be seen in the three-dimensional plot <strong>of</strong> Fig. 1 at N = 8. Further<br />
evidence for the confinement edge is seen in the line scan <strong>of</strong> the peak at N = 5 in Fig. 1. This<br />
peak, with a binding energy very close to the confinement edge, is asymmetric. Its higherbinding-energy<br />
side is substantially broader because this portion <strong>of</strong> the spectral weight lies<br />
outside the confinement range. From the confinement range <strong>of</strong> 0.5 eV and the known Si band<br />
gap <strong>of</strong> 1.2 eV, a Schottky barrier height <strong>of</strong> 0.7 eV is deduced for our n-type Si substrate. This is<br />
consistent with a recent reported value <strong>of</strong> 0.72 0.02 eV based on electrical measurements [4].<br />
The binding energies <strong>of</strong> quantum well states are determined by the Bohr-Sommerfeld<br />
quantization rule [2, 3, 5]:<br />
2kNt<br />
s<br />
i<br />
2n<br />
, (1)<br />
6 where k is the wave vector, t is the monolayer<br />
0<br />
thickness, <br />
s<br />
is the phase shift at the surface, i<br />
is<br />
5<br />
the phase shift at the interface, and n is a quantum<br />
1<br />
number. For a given N and integer quantum<br />
4 numbers, this equation determines the allowed k<br />
values, which in turn determine the binding energies<br />
2<br />
3 <strong>of</strong> the quantum well states through the band<br />
dispersion relation E(k). For Pb(111), the relevant<br />
3<br />
2 band is the p valence band with a known dispersion<br />
that extends from 4.2 eV below the Fermi level to<br />
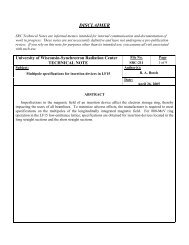
Binding Energy (eV)<br />
4 n = 0<br />
0 2 4 6 8 10 12<br />
Thickness N (ML)<br />
Figure 2: Binding energies <strong>of</strong> quantum<br />
well states (circles connected by lines)<br />
deduced from a fit to the experimental<br />
results (crosses). The band structure <strong>of</strong><br />
Pb and the phase shifts enter the model<br />
calculation. The only fitting parameter<br />
is an unknown constant <strong>of</strong>fset in the<br />
interface phase shift. The quantum<br />
number n for each branch is indicated.<br />
1<br />
8.0 eV above the Fermi level [5]. The surface phase<br />
shift <br />
s<br />
as a function <strong>of</strong> energy has been computed<br />
by a first-principles method [5], and this is used in<br />
the present analysis. The interface phase shift i<br />
is<br />
given by<br />
<br />
<br />
1<br />
E E <br />
L<br />
Re<br />
cos<br />
2<br />
1<br />
<br />
0<br />
, (2)<br />
EU<br />
EL<br />
<br />
where Re refers to the real part, E is the energy, EL<br />
is the lower edge <strong>of</strong> the Si band gap, E<br />
U<br />
is the upper<br />
edge, and 0<br />
is a constant [6, 7]. It is easy to verify<br />
that <br />
i<br />
changes by across the Si band gap. The<br />
only unknown quantity in Eq. (1) is the constant <br />
0<br />
.<br />
This is treated as a fitting parameter in a fit <strong>of</strong> the