2010 Corporate Capabilities - Spectroscopy
2010 Corporate Capabilities - Spectroscopy
2010 Corporate Capabilities - Spectroscopy

You also want an ePaper? Increase the reach of your titles
YUMPU automatically turns print PDFs into web optimized ePapers that Google loves.
Volume 24 Number 12 SPECTROSCOPY CORPORATE CAPABILITIES ISSUE December 2009<br />
December 2009 Volume 24 Number 12<br />
www.spectroscopyonline.com<br />
<strong>2010</strong> <strong>Corporate</strong><br />
<strong>Capabilities</strong><br />
Get More Value from<br />
Your Spectrometer<br />
Group Theory and<br />
Symmetry, Part I<br />
®
te<br />
4 <strong>Spectroscopy</strong> 24(12) December 2009 www.spectroscopyonline.com<br />
®<br />
®<br />
PUBLISHING & SALES<br />
485 Route One South, Building F, First Floor<br />
Iselin, NJ 08830<br />
(732) 596-0276, Fax: (732) 596-0003<br />
Michael J. Tessalone<br />
Science Group Publisher, mtessalone@advanstar.com<br />
Edward Fantuzzi<br />
Publisher, efantuzzi@advanstar.com<br />
Stephanie Shaffer<br />
East Coast Sales Manager, sshaffer@advanstar.com<br />
(508) 481-5885<br />
EDITORIAL<br />
David Walsh<br />
Editor-in-Chief, david.walsh@advanstar.com<br />
Stephen A. Brown<br />
Group Technical Editor, sbrown@advanstar.com<br />
Dan Ward<br />
Art Director, dward@advanstar.com<br />
MARKETING<br />
Anne Young<br />
Marketing Manager, ayoung@advanstar.com<br />
MARKET DEVELOPMENT<br />
Tamara Phillips<br />
Direct List Rentals, tphillips@advanstar.com<br />
Sandy Sailes-Colbert<br />
Reprints, scolbert@advanstar.com<br />
Maureen Cannon<br />
Permissions, mcannon@advanstar.com<br />
PRODUCTION AND AUDIENCE DEVELOPMENT<br />
Lisa Johnson<br />
Production Director, ljohnson@advanstar.com<br />
Rhonda Rychlak<br />
Production Manager, rrychlak@advanstar.com<br />
Peggy Olson<br />
Audience Development Manager, polson@advanstar.com<br />
Gail Mantay<br />
Audience Development Assistant Manager, gmantay@advanstar.com<br />
MANUSCRIPTS: To discuss possible article topics or obtain manuscript preparation<br />
guidelines, contact The Editor at: (732) 596-0276, e-mail: spectroscopyedit@advanstar.<br />
com. Publishers assume no responsibility for safety of artwork, photographs, or manuscripts.<br />
Every caution is taken to ensure accuracy, but publishers cannot accept responsibility for the<br />
information supplied herein or for any opinion expressed.<br />
SUBSCRIPTIONS: For subscription information: <strong>Spectroscopy</strong>, P.O. Box 6196, Duluth, MN<br />
55806-6196; (866) 529-2922, 8 a.m. to 4:30 p.m. CST. Outside the U.S., (866) 529-2922.<br />
Delivery of <strong>Spectroscopy</strong> outside the U.S. is 3–14 days after printing. Single-copy price:<br />
U.S., $10.00 + $7.00 postage and handling ($17.00 total); Canada and Mexico, $12.00 + $7.00<br />
postage and handling ($19.00 total); Other international, $15.00 + $7.00 postage and handling<br />
($22.00 total).<br />
CHANGE OF ADDRESS: Notices should be sent promptly; provide old mailing label as well<br />
as new address; include ZIP or postal code. Allow 4–6 weeks for change.<br />
RETURN ALL UNDELIVERABLE CANADIAN ADDRESSES TO: Circulation Dept. or<br />
DPGM, 7496 Bath Road #2, Mississauga ON L4T 1L2, Canada.<br />
BACK ISSUES, MICROFILM, MICROFICHE: (800) 598-6008.<br />
REPRINTS: Reprints of all articles in this issue and past issues are available<br />
(500 minimum). Contact Sandy Sailes-Colbert, Reprint Marketing Advisor, (440) 891-2761<br />
or (800) 225-4569 ext. 2761; e-mail: scolbert@advanstar.com<br />
DIRECT LIST RENTAL: Contact Tamara Phillips, (440) 891-2773; e-mail: tphillips@<br />
advanstar.com<br />
INTERNATIONAL LICENSING: Maureen Cannon, (440) 891-2742,<br />
fax: (440) 891-2650; e-mail: mcannon@advanstar.com.<br />
<strong>Spectroscopy</strong> does not verify any claims or other information appearing in any of the<br />
advertisements contained in the publication, and cannot take any responsibility for any<br />
losses or other damages incurred by readers in reliance on such content.<br />
<strong>Spectroscopy</strong> welcomes unsolicited articles, manuscripts, photographs, illustrations and<br />
other materials but cannot be held responsible for their safekeeping or return.<br />
Advanstar Communications provides certain customer contact data (such as customers’<br />
names, addresses, phone numbers, and e-mail addresses) to third parties who wish to<br />
promote relevant products, services and other opportunities that may be of interest to you.<br />
If you do not want Advanstar Communications to make your contact information available to<br />
third parties for marketing purposes, simply call toll-free (866) 529-2922 between the hours<br />
of 7:30 a.m. and 5 p.m. CST, and a customer service representative will assist you in removing<br />
your name from Advanstar’s lists. Outside the United States, please phone (866) 529-2922.<br />
50% Recycled Paper<br />
Joseph Loggia<br />
President, Chief Executive Officer<br />
Ted Alpert<br />
Executive Vice President, Finance & Chief Financial Officer<br />
Eric I. Lisman<br />
Executive Vice President, <strong>Corporate</strong> Development<br />
Tony Calanca<br />
Executive Vice President, Exhibitions<br />
Chris DeMoulin<br />
Executive Vice President, Fashion Group<br />
Danny Phillips<br />
Executive Vice President, Powersports, Veterinary & Dental Group<br />
Georgiann DeCenzo<br />
Executive Vice President, Market Development, Europe & Licensing Group<br />
Steve Morris<br />
Executive Vice President, Life Sciences Group<br />
Francis Heid<br />
Vice President, Media Operations<br />
J Vaughn<br />
Vice President, Information Technology<br />
Mike Alic<br />
Vice President, Electronic Media Group<br />
Nancy Nugent<br />
Vice President, Human Resources<br />
Ward D. Hewins<br />
Vice President, General Counsel<br />
David C. Esola<br />
Vice-President, General Manager<br />
s10-20% Post Consumer Wa<br />
©2009 Advanstar Communications Inc. All rights reserved. No part of this<br />
publication may be reproduced or transmitted in any form or by any means,<br />
electronic or mechanical, including by photocopy, recording, or information storage<br />
and retrieval without permission in writing from the publisher. Authorization to<br />
photocopy items for internal/educational or personal use, or the internal/educational or personal<br />
use of specific clients, is granted by Advanstar Communications Inc. for libraries and other users<br />
registered with the Copyright Clearance Center, 222 Rosewood Dr., Danvers, MA 01923, 978-750-<br />
8400, fax 978-646-8700. For uses beyond those listed above, please direct your written request<br />
to Permission Dept. fax 440-891-2650 or email: mcannon@advanstar.com.<br />
Advanstar Communications Inc. (www.advanstar.com) is a leading worldwide media company<br />
providing integrated marketing solutions for the Fashion, Life Sciences and Powersports<br />
industries. Advanstar serves business professionals and consumers in these industries with its<br />
portfolio of 91 events, 67 publications and directories, 150 electronic publications and Web<br />
sites, as well as educational and direct marketing products and services. Market leading brands<br />
and a commitment to delivering innovative, quality products and services enables Advanstar<br />
to “Connect Our Customers With Theirs.” Advanstar has approximately 1000 employees and<br />
currently operates from multiple offices in North America and Europe.<br />
All color separations, proofs, and film produced by Advanstar’s Scanning and<br />
Digital Prepress Departments.
®<br />
6 <strong>Spectroscopy</strong> 24(12) December 2009 www.spectroscopyonline.com<br />
Contents<br />
Volume 24 Number 12<br />
DECember 2009<br />
December 2009<br />
Volume 24 Number 12<br />
December 2009 Volume 24 Number 12<br />
www.spectroscopyonline.com<br />
<strong>2010</strong> <strong>Corporate</strong><br />
<strong>Capabilities</strong><br />
Get More Value from<br />
Your Spectrometer<br />
Group Theory and<br />
Symmetry, Part I<br />
Cover image courtesy of<br />
Robin MacDougall/Getty Images.<br />
®<br />
Columns<br />
THE BASELINE<br />
Group Theory and Symmetry, Part I: Symmetry Elements<br />
Group theory is the field of mathematics that includes, among other things, the treatment<br />
of symmetry. Well, it turns out that molecules have symmetry, so group theoretical<br />
principles can be applied to molecules. Because spectroscopy uses light to probe the<br />
properties of molecules, it might not be surprising that group theory has some application<br />
to spectroscopy. Here, we start a multipart discussion of symmetry and group theory.<br />
David W. Ball<br />
Are You Getting Value From Your Spectrometer?<br />
Getting the best business value from a spectrometer requires knowledge of the instrument<br />
and its operating abilities, any attachments, the sample including sampling procedure and<br />
presentation, and the software. All of these elements must be pulled together by a skilled<br />
and knowledgeable spectroscopist. Unfortunately, this is not always the case in many<br />
organizations.<br />
R.D. McDowall<br />
FOCUS ON QUALITY<br />
63<br />
67<br />
DEPARTMENTS<br />
From the Editor 10<br />
News Spectrum 11<br />
Articles<br />
2009 Editorial Index 73<br />
<strong>Spectroscopy</strong> presents its annual index of authors and articles as a resource for readers and<br />
researchers.<br />
www.spectroscopyonline.com<br />
● Article Archive<br />
● Calendar of Events<br />
● Information for Authors<br />
● Useful Links<br />
● Application Notes<br />
● Subscribe/Renew Information<br />
... and more!<br />
<strong>Spectroscopy</strong> (ISSN 0887-6703 [print], ISSN 1939-1900 [digital]) is published monthly by Advanstar Communications, Inc.,<br />
131 West First Street, Duluth, MN 55802-2065. <strong>Spectroscopy</strong> is distributed free of charge to users and specifiers of spectroscopic<br />
equipment in the United States. <strong>Spectroscopy</strong> is available on a paid subscription basis to nonqualified readers<br />
at the rate of: U.S. and possessions: 1 year (12 issues), $74.95; 2 years (24 issues), $134.50. Canada/Mexico: 1 year, $95; 2 years,<br />
$150. International: 1 year (12 issues), $140; 2 years (24 issues), $250. Periodicals postage paid at Duluth, MN 55806 and at<br />
additional mailing offices. POSTMASTER: Send address changes to <strong>Spectroscopy</strong>, P.O. Box 6196, Duluth, MN 55806-6196.<br />
Canadian GST number: R-124213133RT001, Publications Mail Agreement Number 40017597. Printed in the U.S.A.<br />
This Month in Wavelength:<br />
FT-IR/NIR<br />
Watch your e-mail inbox for the latest<br />
issue, or follow the link at<br />
www.spectroscopyonline.com to sign up to<br />
start receiving Wavelength.
8 <strong>Spectroscopy</strong> 24(12) December 2009<br />
www.spectroscopyonline.com<br />
December 2009 Volume 24 Number 12<br />
<strong>2010</strong> <strong>Corporate</strong> <strong>Capabilities</strong><br />
12 ABB Analytical<br />
14 Amptek, Inc.<br />
16 Applied Photophysics<br />
18 Andor Technology plc<br />
19 Avantes, Inc.<br />
20 B&W Tek, Inc.<br />
22 BaySpec, Inc.<br />
23 Bruker Corporation<br />
24 EDAX, Inc.<br />
26 CVI Melles Griot<br />
27 Fiberguide Industries, Inc.<br />
28 FOSS NIRSystems, Inc.<br />
29 Glass Expansion<br />
30 Harrick Scientific Products, Inc.<br />
31 Hitachi High Technologies America<br />
32 HORIBA Scientific<br />
33 OptiGrate Corp.<br />
34 International Centre for Diffraction<br />
Data (ICDD)<br />
36 IDEX Health & Science<br />
38 Inorganic Ventures<br />
40 KLASTECH Karpushko Laser<br />
Technologies<br />
42 Moxtek, Inc.<br />
44 Newport Corporation<br />
45 Nippon Instruments North<br />
America<br />
46 Ocean Optics, Inc.<br />
48 PANalytical<br />
50 Parker Hannifin Corporation<br />
51 PerkinElmer<br />
52 PHOTONIS USA<br />
54 PIKE Technologies<br />
55 Smiths Detection Scientific<br />
83 <strong>Spectroscopy</strong><br />
56 Shimadzu Scientific Instruments<br />
58 Specac, Inc.<br />
59 Spellman High-Voltage<br />
Electronics<br />
60 SPEX CertiPrep, Inc.<br />
61 Thermo Fisher Scientific<br />
62 WITec GmbH
www.spectroscopyonline.com December 2009 <strong>Spectroscopy</strong> 24(12) 9<br />
Editorial Advisory Board<br />
Ramon M. Barnes University of Massachusetts<br />
Paul N. Bourassa Lifeblood<br />
Chris W. Brown University of Rhode Island<br />
Kenneth L. Busch Wyvern Associates<br />
Ashok L. Cholli University of Massachusetts at Lowell<br />
David M. Coleman Wayne State University<br />
Patricia B. Coleman Ford Motor Company<br />
Bruce Hudson Syracuse University<br />
Kathryn S. Kalasinsky Armed Forces Institute of Pathology<br />
David Lankin University of Illinois at Chicago, College of Pharmacy<br />
Barbara S. Larsen DuPont Central Research and Development<br />
Ian R. Lewis Kaiser Optical Systems<br />
Jeffrey Hirsch ThermoFisher Scientific<br />
Howard Mark Mark Electronics<br />
R.D. McDowall McDowall Consulting<br />
Linda Baine McGown Rensselaer Polytechnic Institute<br />
Robert G. Messerschmidt Rare Light, Inc.<br />
Nancy Miller-Ihli M–I Research<br />
Francis M. Mirabella Jr. Equistar Technology Center<br />
John Monti Shimadzu Scientific Instruments<br />
Thomas M. Niemczyk University of New Mexico<br />
Anthony J. Nip CambridgeSoft Corp.<br />
John W. Olesik The Ohio State University<br />
Richard J. Saykally University of California, Berkeley<br />
Basil I. Swanson Los Alamos National Laboratory<br />
Jerome Workman Jr. Luminous Medical, Inc.<br />
Contributing Editors:<br />
Fran Adar Horiba Jobin Yvon<br />
David W. Ball Cleveland State University<br />
Kenneth L. Busch National Science Foundation<br />
John Coates Coates Consulting<br />
Howard Mark Mark Electronics<br />
Volker Thomsen Consultant<br />
Jerome Workman Jr. Luminous Medical, Inc.<br />
Process Analysis Advisory Panel:<br />
James M. Brown Exxon Research and Engineering Company<br />
Bruce Buchanan Sensors-2-Information<br />
Lloyd W. Burgess CPAC, University of Washington<br />
James Rydzak Glaxo SmithKline<br />
Robert E. Sherman CIRCOR Instrumentation Technologies<br />
John Steichen DuPont Central Research and Development<br />
D. Warren Vidrine Vidrine Consulting<br />
European Regional Editors:<br />
John M. Chalmers VSConsulting, United Kingdom<br />
David A.C. Compton Industrial Chemicals Ltd.<br />
<strong>Spectroscopy</strong>’s Editorial Advisory Board is a group of distinguished individuals<br />
assembled to help the publication fulfill its editorial mission to promote the effective<br />
use of spectroscopic technology as a practical research and measurement tool.<br />
With recognized expertise in a wide range of technique and application areas, board<br />
members perform a range of functions, such as reviewing manuscripts, suggesting<br />
authors and topics for coverage, and providing the editor with general direction and<br />
feedback. We are indebted to these scientists for their contributions to the publication<br />
and to the spectroscopy community as a whole.
10 <strong>Spectroscopy</strong> 24(12) December 2009 www.spectroscopyonline.com<br />
From the Editor<br />
Looking Forward with Optimism<br />
It has certainly been a long 12 months. With the economic recession, the housing crisis,<br />
and high unemployment dominating the news and impacting the spectroscopy marketplace<br />
in 2009, it is easy to see why many readers will not be sorry to see the end of 2009,<br />
and why they will be all too happy to welcome in <strong>2010</strong>.<br />
However, if the holidays are a time for looking forward with optimism, then it must also be<br />
said that even in these difficult economic times, there is ample reason to feel hopeful. A recent<br />
market analysis from Strategic Directions International points to high single-digit growth in<br />
all market segments in <strong>2010</strong>, with atomic spectroscopy, molecular spectroscopy, and mass spectrometry<br />
all predicted to grow in the coming year (see pp. 10–16 of <strong>Spectroscopy</strong>’s “Buyers’ Guide<br />
and Industry Trends,” August 2009). And with a modest yet steady rally brewing on Wall Street<br />
over the past few months and an improving housing market, there are indeed reasons to look<br />
forward to <strong>2010</strong>.<br />
Here at <strong>Spectroscopy</strong>, one thing we are looking forward to is bringing readers another year of<br />
practical technical advice and information to help them in their labs every day. For make no<br />
mistake, it is the everyday work being done on the frontlines of materials analysis and analytical<br />
chemistry in general that will help bring about the economic recovery we are all putting on our<br />
wish lists this holiday season.<br />
Finally, on behalf of all of us at <strong>Spectroscopy</strong>, I would like to take this opportunity to wish all<br />
of our readers and their families Happy Holidays and a Happy New Year. I think we can agree<br />
that all of life’s problems and challenges pale in comparison to the joy of celebrating the holidays<br />
with family and friends.<br />
David Walsh<br />
Editor-in-Chief<br />
David.Walsh@advanstar.com
www.spectroscopyonline.com<br />
News Spectrum<br />
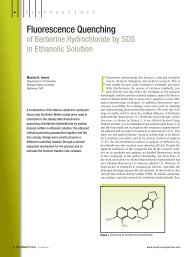
Research<br />
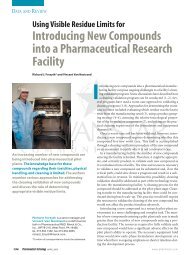
Researchers at several different locations of the National<br />
Institute of Health (Bethesda, Maryland) have<br />
combined to perform a neuroimaging study of brain<br />
development in healthy, normally developing children<br />
from birth to young adulthood. The latest data released<br />
by the group include longitudinal imaging and clinical/<br />
behavioral data for children ages seven days to four years<br />
old.<br />
Here, MRI scan data are accompanied by corresponding<br />
data from physical neurological examinations, behavioral<br />
ratings, neuropsychological testing, structured psychiatric<br />
interviews, and hormonal measures from urine and saliva<br />
samples. This is the first release to include data from a<br />
technique called MR spectroscopy, a type of MRI scan that<br />
measures the levels of certain by-products of metabolism<br />
that can be used to gauge the health of brain tissues.<br />
It is hoped that raw data sharing such as this will help to<br />
optimize the burgeoning knowledge of conditions such as<br />
autism, among others. Accordingly, databases are being<br />
created in certain rapidly growing fields. Judith Rumsey,<br />
National Institute of Mental Health, explained: “These<br />
data-sharing efforts reflect a new approach to science.<br />
The database can be used to chart normal developmental<br />
trajectories in order to identify deviations in milestones<br />
associated with disease.”<br />
December 2009 <strong>Spectroscopy</strong> 24(12) 11<br />
Scientists with the Foundation for Scientific and<br />
Industrial Research (Trondheim, Norway) have<br />
developed a solution to sorting waste for recycling based<br />
upon infrared spectroscopy. Using halogen lamps as light<br />
sources, an instrument has been developed that can<br />
distinguish between plastic-coated cardboard, ordinary<br />
cardboard, and different kinds of plastics by small<br />
variations in the color of the reflected infrared light. In<br />
the selected range of infrared wavelengths, objects have<br />
different reflection properties than for ordinary visible<br />
light.<br />
Industry<br />
HORIBA (Edison, New Jersey) has received an order<br />
from the United States National Aeronautics and<br />
Space Administration (NASA, Washington, DC) to<br />
supply water quality sensors to be used in their medical<br />
intravenous (IV) fluid production device.<br />
IV fluid is essential for medical treatment and surgical<br />
procedures, and must be available at the International<br />
Space Station (ISS) for future long-duration exploration<br />
missions. It is impossible to deliver enough fresh IV fluid<br />
from the earth to the ISS. Therefore, NASA is developing<br />
an IVGEN (Intra Venous GENeration) system, which<br />
reuses the feedstock water in ISS to a purity level of<br />
pharmaceutical standards.<br />
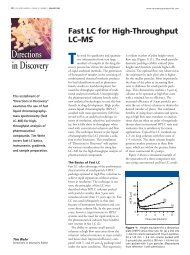
Market Profile: Process FT-NIR<br />
Mass Fourier spectrometry transform–near (MS) infrared is a broadly (FT-NIR) used analytical spectroscopy<br />
technique is one of a that number is often molecular combined spectroscopy with some form techniques<br />
that are already to provide used a for second online dimension process analysis of<br />
of<br />
chromatography<br />
separation. across a number However, of industries, vendors recently but are still have seeing begun significant<br />
growth ion in mobility demand. separation FT-NIR technology (IMS) into has high-<br />
a<br />
incorporating<br />
end number LC–MS of inherent instruments, advantages thus providing for online analysis. additional<br />
level The combination of ion separation. of the FT<br />
analysis method and the<br />
NIR spectrum combine to<br />
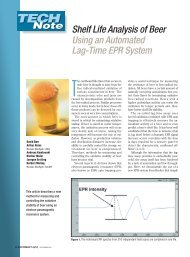
Other (8%)<br />
make FT-NIR a very useful<br />
online analytical tool.<br />
Biofuels (7%)<br />
Pharmaceuticals (17%)<br />
The use of the FT technique<br />
allows for instantaneous<br />
analysis of the entire<br />
spectrum of a broadband<br />
light source, rather than<br />
Chemicals (21%)<br />
having to scan across the<br />
spectrum of interest or use<br />
only a single point of the<br />
electromagnetic spectrum<br />
for analysis. This is ideal for providing detailed analytical<br />
information of continuously flowing or changing<br />
processes. Although not as sensitive as mid-IR<br />
Process FT-NIR demand by industry in 2009.<br />
spectroscopy, NIR spectroscopy allows for deeper penetration<br />
of the sample, and is better for bulk materials.<br />
Online FT-NIR is used most heavily in refineries and<br />
general chemical facilities due to its strength in the<br />
analysis of petrochemical compounds. A rapidly growing<br />
niche is in the development of alternative<br />
biofuels. The global market<br />
for process FT-NIR is well<br />
over $20 million annually,<br />
and is expected to see midto-high<br />
single-digit growth.<br />
Petroleum (47%)<br />
The foregoing data was based<br />
upon SDi’s Market Analysis<br />
& Perspectives (MAP)<br />
report program. For more<br />
information, contact Stuart<br />
Press, Senior Consultant,<br />
Strategic Directions<br />
International, Inc., 6242<br />
Westchester Parkway, Suite<br />
100, Los Angeles, CA 90045, (310) 641-4982, fax:<br />
(310) 641-8851, www.strategic-directions.com.
12 SPECTROSCOPY CORPORATE CAPABILITIES DECEMBER 2009<br />
ABB Analytical<br />
www.spectroscopyonline.com<br />
ABB Analytical<br />
585 boul. Charest E.<br />
suite 300<br />
Quebec, QC<br />
G1K 9H4<br />
Canada<br />
TELEPHONE<br />
(418) 877-2944<br />
FAX<br />
(418) 877-2834<br />
E-MAIL<br />
ftir@ca.abb.com<br />
WEB SITE<br />
www.abb.com/analytical<br />
NUMBER OF EMPLOYEES<br />
200<br />
YEAR FOUNDED<br />
1973<br />
Company Description<br />
Founded in 1973 as Bomem Inc., the Analytical Business<br />
Unit of ABB enables scientists around the world to perform<br />
through excellence in infrared spectroscopy. ABB is a market<br />
leader in Fourier Transform Infrared (FT-IR and FT-NIR) in<br />
terms of reliability and reproducibility. ABB Analytical designs,<br />
manufactures, and markets high-performance, affordable<br />
spectrometers as well as turnkey analytical solutions and<br />
spectroradiometers for remote sensing. ABB Analytical capabilities<br />
encompass one of the largest portfolios in the world<br />
for laboratory, at-line, and process FT-IR analyzers. They perform<br />
real-time analysis of the chemical composition and/or<br />
physical properties of a process sample stream.<br />
Chief Spectroscopic Techniques Supported<br />
⦁<br />
⦁<br />
⦁<br />
⦁<br />
⦁<br />
FT-IR<br />
FT-NIR<br />
Spectroradiometry and Remote Sensing<br />
Dedicated team of engineers offering simple and<br />
dependable solutions with reliable instruments<br />
Local point of contact for field service and technical<br />
support in most countries around the world with<br />
inventories for parts on all continents<br />
Markets Served<br />
⦁<br />
⦁<br />
⦁<br />
⦁<br />
Laboratory and Academic<br />
Life Sciences<br />
Pharmaceutical<br />
Fine Chemicals, Specialty Chemicals, and Commodity<br />
Chemicals<br />
⦁<br />
⦁<br />
⦁<br />
⦁<br />
⦁<br />
Refining and Petrochemicals<br />
Metallurgical<br />
Semiconductor<br />
Original Equipment Manufacturer (OEM)<br />
Remote Sensing and Aerospace<br />
Major Products/Services<br />
ABB’s advanced solutions combine<br />
analyzers, advanced process control, data<br />
management, and process and application<br />
knowledge to improve the operational<br />
performance, productivity, capacity, and<br />
safety of industrial processes for customers.<br />
For all laboratory or process needs, ABB<br />
can be your partner and single-source<br />
provider of simple, low-cost, high performance,<br />
general-purpose FT-IR and FT-NIR<br />
spectrometers. The company also markets<br />
analyzers for hydrogen and inclusion<br />
measurement in liquid aluminum.<br />
Facility<br />
Our manufacturing facility located in<br />
Quebec City, Canada, employs more than<br />
200 people, including R&D, manufacturing,<br />
marketing, sales, and administrative<br />
groups. The ABB Group of companies<br />
operates in around 100 countries and<br />
employs about 120,000 people.
14 SPECTROSCOPY CORPORATE CAPABILITIES DECEMBER 2009 www.spectroscopyonline.com<br />
Amptek, Inc.<br />
instrument is ideal for both the laboratory<br />
and OEM industries.<br />
Completing Amptek’s XRF portable<br />
solutions for exact measurements are the<br />
new, USB-controlled Mini-X X-ray tube and<br />
the XRF-FP Quantitative Analysis Software.<br />
Please visit our web site for complete<br />
specifications.<br />
Amptek, Inc.<br />
14 DeAngelo Drive<br />
Bedford, MA 01730<br />
TELEPHONE<br />
(781) 275-2242<br />
FAX<br />
(781) 275-3470<br />
E-MAIL<br />
sales@amptek.com<br />
WEB SITE<br />
www.amptek.com<br />
NUMBER OF EMPLOYEES<br />
29<br />
YEAR FOUNDED<br />
1977<br />
Company Description<br />
Amptek, Inc. is a recognized world leader in the design and<br />
manufacture of state-of-the-art X-ray and gamma ray detectors,<br />
preamplifiers, instrumentation and components for<br />
portable instruments, laboratories, satellites, and analytical<br />
purposes. These products provide the user with high performance<br />
and high reliability together with small size and low<br />
power.<br />
Chief Spectroscopic Techniques Supported<br />
⦁<br />
⦁<br />
⦁<br />
⦁<br />
⦁<br />
X-ray fluorescence (EDXRF)<br />
Direct spectral measurements<br />
SEM<br />
PIXE<br />
TXRF<br />
Markets Served<br />
Amptek serves wherever X-ray detection is used; for example,<br />
hand-held and table-top XRF analyzers produced by OEMs;<br />
research facilities in universities, commercial enterprises and<br />
the military; nuclear medicine; space; museums; environmental<br />
monitoring; and geological analysis of soils and minerals.<br />
Major Products/Services<br />
Models XR-100CR and XR-100SDD are high-performance<br />
X-ray detector systems using a thermoelectric cooler and no<br />
liquid nitrogen, featuring a wide range of detection areas and<br />
efficiency and resolution of 129 eV FWHM. Power and shaping<br />
are provided by the PX4 Digital Pulse Processor. The<br />
XR-100 successfully analyzed the rocks and soil on Mars.<br />
The X-123 is a complete X-ray detector system in one small<br />
box that fits in your hand. The X-123 incorporates either the<br />
Amptek Si-Pin Diode Detector or Silicon Drift detector (SDD);<br />
Charge Sensitive Preamplifier; the Amptek DP5 Digital Pulse<br />
Processor and MCA; and the Amptek PC5 Power Supply. This<br />
small, low power, easy to operate, high-performance<br />
Applications<br />
⦁<br />
⦁<br />
⦁<br />
⦁<br />
⦁<br />
⦁<br />
⦁<br />
⦁<br />
⦁<br />
⦁<br />
⦁<br />
⦁<br />
⦁<br />
⦁<br />
⦁<br />
⦁<br />
⦁<br />
⦁<br />
⦁<br />
⦁<br />
⦁<br />
⦁<br />
⦁<br />
X-Ray Fluorescence<br />
Process Control<br />
OEM Instrumentation<br />
RoHS/WEEE Compliance Testing<br />
Nondestructive Analysis with XRF<br />
Restricted Metals Detection<br />
Environmental Monitoring<br />
Medical and Nuclear Electronics<br />
Heavy Metals in Plastics<br />
Lead Detectors<br />
Toxic Dump Site Monitoring<br />
Semiconductor Processing<br />
Nuclear Safeguards Verification<br />
Plastic & Metal Separation<br />
Coal & Mining Operations<br />
Sulfur in Oil and Coal Detection<br />
Smoke Stack Analysis<br />
Plating Thickness<br />
Oil Logging<br />
Electro-Optical Systems<br />
Research Experiments & Teaching<br />
Art and Archaeology<br />
Jewelry Analysis
16 SPECTROSCOPY CORPORATE CAPABILITIES DECEMBER 2009 www.spectroscopyonline.com<br />
Applied Photophysics<br />
Applied Photophysics<br />
203–205 Kingston Road<br />
Leatherhead<br />
Surrey KT22 7PB<br />
United Kingdom<br />
TELEPHONE<br />
UK +44 (0)1372 386537<br />
Toll-Free (from USA only)<br />
1-800 543 4130<br />
E-MAIL<br />
Sales Department:<br />
sales@photophysics.com<br />
Technical Support:<br />
techsup@photophysics.com<br />
WEB SITE<br />
www.photophysics.com<br />
YEAR FOUNDED<br />
1971<br />
Company Description<br />
Applied Photophysics is a world-leading manufacturer and<br />
supplier of precision spectrometers to researchers working in<br />
pharmaceutical, biotechnology, and academic environments.<br />
Our instruments are used to determine structural, thermodynamic,<br />
and kinetics properties of a wide range of samples in<br />
solution. Established in 1971, Applied Photophysics has an<br />
enviable reputation for outstanding performance and<br />
innovative technology.<br />
Chief Spectroscopic Techniques Supported<br />
⦁<br />
⦁<br />
⦁<br />
Circular dichroism (CD) spectroscopy<br />
Stopped-flow spectroscopy<br />
Laser-flash photolysis spectroscopy<br />
Markets Served<br />
Applied Photophysics offers precision spectrometers to academic<br />
and industrial markets. The Chirascan spectrometers<br />
are now the CD instruments of choice in pharmaceutical and<br />
biotechnology markets for use in drug development, formulation<br />
testing, biocomparability studies, and quality control. The<br />
SX20 and LKS.60 spectrometers are established leaders for<br />
stopped-flow and laser-flash research in the academic market,<br />
addressing applications in protein structure, folding, and conformation,<br />
together with biomolecular reaction kinetics and<br />
the study of chemical reaction mechanisms.<br />
Major Products/Services<br />
Chirascan and Chirascan-plus circular dichroism<br />
spectrometers (CD)<br />
Outstanding sensitivity, novel detection techniques, and powerful<br />
software combine to establish these instruments as the<br />
world’s most advanced CD spectrometers.<br />
SX20 stopped-flow spectrometer<br />
The SX20 is the market-leading stoppedflow<br />
reaction analyzer capable of measuring<br />
fast reactions with a minimum of<br />
material.<br />
LKS.60 nanosecond laser-flash<br />
photolysis spectrometer<br />
The LKS.60 offers unmatched sensitivity<br />
for single and multiwavelength kinetics of<br />
very short-lived species, such as free radicals<br />
and excited-state species.<br />
RX.2000 rapid mixing stopped-flow<br />
unit<br />
Adds stopped-flow rapid reaction kinetics<br />
to any UV-visible spectrometer or<br />
fluorometer.<br />
Pro-Data software<br />
Stopped-flow and circular dichroism spectrometers<br />
incorporate common software<br />
enabling cross-platform compatibility.<br />
Accessories<br />
With all products, a wide range of accessories<br />
is available to expand the system as<br />
research interests evolve.<br />
Customer Support<br />
Support is provided for the lifetime of the<br />
product and every instrument comes with<br />
a warranty of at least 12 months that can<br />
be easily extended. A world-class service<br />
team is on hand for support and applications<br />
advice.<br />
Facilities<br />
Headquartered close to London, UK. See<br />
www.photophysics.com/agents.php for<br />
worldwide distribution network.
18 SPECTROSCOPY CORPORATE CAPABILITIES DECEMBER 2009 www.spectroscopyonline.com<br />
Andor Technology plc<br />
semiconductors), chemical analysis, and<br />
astronomy, as well as industrial applications<br />
such as food and safety, process<br />
control, drug screening, forensic, environment/water<br />
monitoring, and solar panel<br />
inspection.<br />
Andor Technology plc<br />
7 Millennium Way<br />
Springvale Business Park<br />
Belfast BT12 7AL,<br />
United Kingdom<br />
TELEPHONE<br />
International Free Phone:<br />
+ 800 9027 0899<br />
UK: + 44 (0)28 9023 7126<br />
US: (800) 296-1579<br />
FAX<br />
+ 44 (0)28 9031 0792<br />
E-MAIL<br />
marketing@andor.com<br />
WEB SITE<br />
www.andor.com<br />
NUMBER OF EMPLOYEES<br />
USA: 25<br />
Elsewhere: 189<br />
YEAR FOUNDED<br />
1989<br />
Company Description<br />
Andor Technology plc (Andor) is a world leading manufacturer<br />
of high performance modular spectroscopy detection<br />
solutions. Based around best-in-class, research grade CCDs,<br />
exclusive Electron Multiplying CCDs, and Intensified CCD detectors,<br />
as well as seamlessly configurable spectrometers and<br />
dedicated spectroscopy software, Andor’s robust detection<br />
solutions offer a unique combination of sensitivity, speed, and<br />
ease-of-use. Andor’s core technology Ultravac, combines<br />
thermo-electric cooling and vacuum sealing, guaranteeing<br />
sustained detector performance year after year. Andor is also<br />
involved in numerous collaborations with academic<br />
institutions worldwide.<br />
Chief Spectroscopic Techniques Supported<br />
⦁<br />
⦁<br />
⦁<br />
⦁<br />
⦁<br />
⦁<br />
⦁<br />
⦁<br />
⦁<br />
⦁<br />
UV-VIS-NIR Optical Emission <strong>Spectroscopy</strong><br />
Raman (Pulsed, Resonance, SERS, SORS, CARS, TERS, TR 3 )<br />
Fluorescence / Photoluminescence<br />
Plasma studies<br />
Laser Induced Breakdown <strong>Spectroscopy</strong> (LIBS)<br />
Micro-<strong>Spectroscopy</strong><br />
Absorption/Transmission/Reflection (ATR)<br />
Hyper-spectral Imaging<br />
Light Detection and Ranging (LIDAR)<br />
X-Ray Diffraction and Fluorescence (XRD/XRF)<br />
Markets Served<br />
In the analytical and life sciences markets Andor products<br />
are particularly suited to fundamental research in the field of<br />
biology, nanotechnology, material characterization (polymers,<br />
Major Products/Services<br />
Andor’s spectroscopy range features a<br />
high performance CCD platform (Newton)<br />
with exclusive dedicated <strong>Spectroscopy</strong><br />
EMCCD for rapid, light-starved applications.<br />
Andor’s most popular CCD/InGaAs<br />
platform is the iDUS, for all general<br />
<strong>Spectroscopy</strong> applications, alongside the<br />
market leading ICCD camera, iStar, for ns<br />
gated applications. The Shamrock family<br />
is Andor’s versatile spectrometer platform,<br />
with USB connectivity and seamless<br />
configuration with a wide range of accessories,<br />
including fiber optics bundles, and<br />
interface to microscopes. Solis software<br />
boasts a dedicated interface, integrating<br />
data acquisition and cameras/spectrometers<br />
simultaneous control. Andor’s X-Ray<br />
detector range features a wide range of<br />
Direct/Indirect detection options on the<br />
Newton and iKon platform.
www.spectroscopyonline.com<br />
Avantes, Inc.<br />
DECEMBER 2009 SPECTROSCOPY CORPORATE CAPABILITIES 19<br />
Avantes, Inc.<br />
9769 W 119th Ave, Suite 4<br />
Broomfield, CO 80021<br />
TELEPHONE<br />
(303) 410-8668<br />
FAX<br />
(303) 410-8669<br />
E-MAIL<br />
infoUSA@avantes.com<br />
NUMBER OF EMPLOYEES<br />
40<br />
YEAR FOUNDED<br />
1993<br />
Company Description<br />
Avantes is a leading innovator<br />
in the development and<br />
application of miniature<br />
spectrometers. Avantes<br />
continues to develop and introduce<br />
new instruments for<br />
Fiber Optic <strong>Spectroscopy</strong> to<br />
meet our customer’s application<br />
needs. Avantes instruments<br />
and accessories are<br />
also deployed into a variety<br />
of OEM applications in a variety<br />
of industries in markets throughout the world. With more<br />
than 15 years of experience in Fiber Optic <strong>Spectroscopy</strong> and<br />
thousands of instruments in the field, Avantes is eager to help<br />
our customers find their Solutions in <strong>Spectroscopy</strong>®.<br />
Chief Spectroscopic Techniques Supported<br />
⦁<br />
⦁<br />
⦁<br />
⦁<br />
⦁<br />
⦁<br />
⦁<br />
⦁<br />
⦁<br />
⦁<br />
⦁<br />
UV–VIS/NIR <strong>Spectroscopy</strong><br />
Process Control<br />
Raman <strong>Spectroscopy</strong><br />
Absorbance/Transmittance/Reflectance<br />
Laser-Induced Breakdown <strong>Spectroscopy</strong><br />
CIE Color <strong>Spectroscopy</strong><br />
Portable Spectrophotometers<br />
Fluorescence <strong>Spectroscopy</strong><br />
Custom Applications<br />
Irradiance<br />
OEM Application Development<br />
Markets Served<br />
Avantes works with customers in a variety of markets, including<br />
chemical, biomedical, aerospace, semiconductor, gemological,<br />
paper, pharmaceutical, and food processing technology.<br />
Additionally, Avantes works with research organizations<br />
and universities, aiding in developing research and teaching<br />
opportunities. Our OEM program is designed to work with our<br />
customers to identify needs and customize an Avantes’ spectroscopy<br />
solution based our customer’s needs and Avantes<br />
technical know experience. Avantes’ continued growth is<br />
based upon a commitment to providing exceptional technology<br />
and superb customer satisfaction.<br />
Major Products/Services<br />
⦁<br />
Low-cost, high-resolution, miniature fiber optic spectrometers:<br />
System solutions and OEM instruments for<br />
applications from 185 nm to 2,500 nm. Detector choices:<br />
PDA, CMOS, CCD, back-thinned CCD, and InGaAs. Optical<br />
⦁<br />
⦁<br />
⦁<br />
benches with focal lengths of 45, 50 or<br />
75 mm and a revolutionary new straylight<br />
reduction optimized optical bench<br />
(ULS). Other features: 14 and 16 bit<br />
A/D converters, TE cooling, multi-channel<br />
instrument configurations enabling<br />
simultaneous signal acquisition, USB2<br />
communication, support for multiple instruments<br />
from a single computer, and<br />
14 programmable digital I/O ports.<br />
Standard Application Solutions: Raman<br />
<strong>Spectroscopy</strong>, Gemology, Oxygen Sensing,<br />
Chemometric Analysis, Thin-Film<br />
Measurement, Color, Fluorescence, Laser-Induced<br />
Breakdown <strong>Spectroscopy</strong>,<br />
Irradiance and LED measurements, and<br />
Process Control.<br />
Light Sources: Tungsten-halogen, Deuterium,<br />
LED, Xenon, Calibration sources<br />
for wavelength and irradiance.<br />
<strong>Spectroscopy</strong> Accessories: Fiber optic<br />
cables and probes, integrating spheres,<br />
cuvette holders, flow cells, collimating<br />
lenses, cosine correctors, vacuum feedthroughs,<br />
fiber optic multiplexer.<br />
Facilities<br />
Avantes engineering manufacturing, sales,<br />
and service headquarters is in the Netherlands.<br />
The company also operates direct<br />
offices in China and North America. In addition,<br />
Avantes has a growing worldwide<br />
distribution network of more than 35<br />
qualified distributors to meet our customers’<br />
needs worldwide.
20 SPECTROSCOPY CORPORATE CAPABILITIES DECEMBER 2009<br />
B&W Tek, Inc.<br />
www.spectroscopyonline.com<br />
⦁<br />
⦁<br />
⦁<br />
⦁<br />
⦁<br />
⦁<br />
Portable Raman and<br />
fluorescence instruments<br />
Process Raman, UV, visible,<br />
and NIR analyzers<br />
Broadband superluminescent<br />
light sources<br />
High power turn-key<br />
diode laser systems<br />
Low noise lasers, DPSS lasers,<br />
diode lasers, and fiber lasers<br />
Confocal Microscope<br />
Facilities<br />
Three facilities in the US and three<br />
facilities in international locations.<br />
Company Description<br />
B&W Tek is an advanced instrumentation company producing<br />
optical spectroscopy and laser instruments for biomedical,<br />
physical, chemical, and research communities. With a strong<br />
vertical integration capability, B&W Tek also provides custom<br />
product development, design, and manufacturing.<br />
B&W Tek, Inc.<br />
19 Shea Way<br />
Newark, DE 19713<br />
TELEPHONE<br />
(302) 368-7824<br />
FAX<br />
(302) 368-7830<br />
E-MAIL<br />
info@bwtek.com<br />
WEB SITE<br />
www.bwtek.com<br />
NUMBER OF EMPLOYEES<br />
USA: 100<br />
Elsewhere: 100<br />
YEAR FOUNDED<br />
1997<br />
Chief Spectroscopic Techniques Supported<br />
⦁<br />
⦁<br />
⦁<br />
⦁<br />
⦁<br />
⦁<br />
UV<br />
Visible<br />
NIR<br />
Raman<br />
Laser<br />
Microscopy<br />
Markets Served<br />
B&W Tek’s OED and OEM services provide innovative solutions<br />
for the design, development, and quality manufacturing<br />
to the most demanding requirements for analytical, industrial,<br />
medical, biophotonic, and diagnostic applications. Markets<br />
include industries, universities, research labs, oil and refining<br />
facilities, paper production, optical products manufacturers,<br />
drug and agricultural, health care, process analysis, gemological<br />
R&D, etc.<br />
Major Products/Services<br />
⦁<br />
⦁<br />
⦁<br />
⦁<br />
Customized design and development services<br />
Customized photonic instrumentation manufacturing<br />
End User and OEM spectrometer and laser products<br />
UV/Visible and NIR array spectrophotometer systems
22 SPECTROSCOPY CORPORATE CAPABILITIES DECEMBER 2009 www.spectroscopyonline.com<br />
BaySpec, Inc.<br />
Markets Served<br />
⦁<br />
⦁<br />
⦁<br />
⦁<br />
⦁<br />
⦁<br />
⦁<br />
⦁<br />
⦁<br />
Biomedical<br />
Pharmaceuticals<br />
Chemical<br />
Food<br />
Semiconductor<br />
Industrial controls<br />
Homeland security<br />
Fiber sensing<br />
Optical telecommunications<br />
Major Products/Services<br />
⦁<br />
⦁<br />
⦁<br />
⦁<br />
⦁<br />
UV-VIS-NIR spectrographs and spectrometers<br />
Handheld/Portable/Benchtop Raman<br />
Instruments<br />
Narrowband and Wideband Light<br />
Sources<br />
Fiber Optic Probes<br />
Fiber Optic Accessories<br />
BaySpec, Inc.<br />
101 Hammond Avenue<br />
Fremont, CA 94539<br />
TELEPHONE<br />
(510) 661-2008<br />
FAX<br />
(510) 661-2009<br />
E-MAIL<br />
sales@bayspec.com<br />
WEB SITE<br />
www.bayspec.com<br />
NUMBER OF EMPLOYEES<br />
USA: 50-100<br />
YEAR FOUNDED<br />
1999<br />
Company Description<br />
BaySpec, Inc., founded in 1999 with 100% manufacturing in<br />
the USA (Fremont, California), is a vertically integrated spectral<br />
sensing company. The company designs, manufactures,<br />
and markets advanced spectral instruments, from UV-VIS-NIR<br />
spectrometers to handheld and portable NIR and Raman<br />
analyzers for a diverse customer base around the world.<br />
The telecommunication market “boom and bust” has produced<br />
an array of components and technologies, which collectively<br />
for the first time in instrumentation history, realized<br />
the dream of a low-cost yet highly accurate spectral device.<br />
Out of the ashes comes new growth. Stemming from Bay-<br />
Spec’s revolutionary Volume Phase Gratings (VPG(®)) -based<br />
telecom modules, customers in optical test & measurement,<br />
fiber sensing, UV-VIS-NIR and Raman spectroscopy, are benefiting<br />
and building innovative systems to meet the world’s<br />
most current optical system challenges.<br />
While our customer base already spans from the traditional<br />
areas of optical telecommunication and NIR spectroscopy,<br />
we are changing and revolutionizing the way of Raman, Fluorescence,<br />
absorption/reflection, handheld, and OCT spectroscopic<br />
instruments are applied.<br />
Chief Spectroscopic Techniques Supported<br />
⦁<br />
⦁<br />
UV-VIS-NIR specroscopy<br />
Raman spectroscopy<br />
Facilities<br />
22,000 sq ft facility in Fremont, California<br />
(Silicon Valley).
www.spectroscopyonline.com<br />
Bruker Corporation<br />
DECEMBER 2009 SPECTROSCOPY CORPORATE CAPABILITIES 23<br />
Bruker Corporation<br />
40 Manning Road<br />
Billerica, MA 01821<br />
TELEPHONE<br />
(978) 663-3660<br />
FAX<br />
(978) 667-5993<br />
E-MAIL<br />
info@bruker.com<br />
WEB SITE<br />
www.bruker.com<br />
Company Description<br />
Right from the beginning, which is now fifty years ago, Bruker<br />
has been driven by a single idea: to provide the best technological<br />
solution for each analytical task. Today, more than<br />
4000 employees worldwide are working on this permanent<br />
challenge at over 90 locations on all continents. Bruker<br />
systems cover a broad spectrum of applications in all fields<br />
of research and development and are used in all industrial<br />
production processes for the purpose of ensuring quality and<br />
process reliability.<br />
Bruker continues to build upon its extensive range of products<br />
and solutions, its broad base of installed systems and<br />
a strong reputation amongst its customers. Indeed, as our<br />
customers would expect, Bruker as one of the world’s leading<br />
analytical instrumentation companies, continues to develop<br />
state-of-the-art technologies and innovative solutions for<br />
today’s analytical questions.<br />
Chief Spectroscopic Techniques<br />
Supported<br />
⦁<br />
⦁<br />
⦁<br />
⦁<br />
⦁<br />
⦁<br />
⦁<br />
⦁<br />
⦁<br />
⦁<br />
⦁<br />
⦁<br />
⦁<br />
⦁<br />
⦁<br />
⦁<br />
⦁<br />
⦁<br />
⦁<br />
⦁<br />
⦁<br />
⦁<br />
Atomic Force Microscopy<br />
Combustion Analysis<br />
EPR <strong>Spectroscopy</strong><br />
Fourier Transform Infrared <strong>Spectroscopy</strong><br />
and Microscopy (FT-IR)<br />
Fourier Transform Mass Spectrometry<br />
(FT-MS)<br />
Fourier Transform Near Infrared<br />
<strong>Spectroscopy</strong> (FT-NIR)<br />
Handheld X-ray (XRF) Spectrometers<br />
Ion Mobility Spectrometry<br />
Ion Trap Mass Spectrometry<br />
Low Resolution Benchtop<br />
NMR Analyzers<br />
Magnetic Resonance Imaging (MRI)<br />
MALDI-TOF (/TOF) Mass Spectrometry<br />
Mass Spectrometry (LC-MS)<br />
NMR <strong>Spectroscopy</strong><br />
Optical Emission <strong>Spectroscopy</strong><br />
(Spark-OES)<br />
Portable Mass Spectrometers (GC–MS)<br />
Raman <strong>Spectroscopy</strong> and Microscopy<br />
Terahertz <strong>Spectroscopy</strong> and Imaging<br />
X-ray Crystallography<br />
X-ray Diffraction (XRD)<br />
X-ray Fluorescence (XRF)<br />
X-ray Microanalysis (EDS, EBSD)
24 SPECTROSCOPY CORPORATE CAPABILITIES DECEMBER 2009 www.spectroscopyonline.com<br />
EDAX, Inc.<br />
academic, and industrial R&D laboratories,<br />
ROHS/WEEE, renewable energy, pharmaceuticals,<br />
mining, security, forensics,<br />
catalysts, petrochemicals, metallurgy, and<br />
manufacturing operations.<br />
EDAX, Inc.<br />
91 McKee Drive<br />
Mahwah, NJ 07430<br />
TELEPHONE<br />
(201) 529-4880<br />
FAX<br />
(201) 529-3156<br />
E-MAIL<br />
info.edax@ametek.com<br />
WEB SITE<br />
www.edax.com<br />
YEAR FOUNDED<br />
1962<br />
Company Description<br />
EDAX Inc is an ISO-9001 certified manufacturer with over 45<br />
years of experience building instrumentation for the elemental<br />
and structural analysis of materials. EDAX’s founding technology<br />
was the detection and measurement of fluorescent<br />
X-rays for qualitative and quantitative elemental analysis — for<br />
example, elemental analysis on electron beam microscopes.<br />
Since that time, EDAX has sought to expand our product offering<br />
through new technologies and complementary techniques<br />
to provide our customers with the latest analytical instrumentation<br />
available. EDAX continues to be the world leader in the<br />
X-ray microanalysis market while providing new products for<br />
micro X-ray fluorescence and electron backscatter diffraction.<br />
Chief Spectroscopic Techniques Supported<br />
⦁<br />
⦁<br />
⦁<br />
⦁<br />
Energy Dispersive <strong>Spectroscopy</strong><br />
Energy Dispersive X-ray Fluorescence<br />
Electron Back Scatter Diffraction<br />
Wavelength Dispersive <strong>Spectroscopy</strong><br />
Markets Served<br />
EDAX instrumentation for elemental and structural analysis is<br />
found in a broad spectrum of industrial, academic, and<br />
government applications from the field or warehouse to the<br />
most advanced research & development laboratory. Typical<br />
markets served include semiconductor and microelectronics,<br />
Major Products/Services<br />
⦁<br />
⦁<br />
⦁<br />
⦁<br />
⦁<br />
Energy Dispersive X-ray Fluorescence:<br />
EDAX manufactures micro XRF<br />
analyzers for the laboratory.<br />
Electron BackScatter Diffraction:<br />
EDAX supplies instrumentation for<br />
materials structural analysis on SEM<br />
electron-beam microscopes.<br />
Energy Dispersive <strong>Spectroscopy</strong>:<br />
EDAX provides a full range of EDS<br />
products for elemental analysis on SEM<br />
and TEM electron-beam microscopes.<br />
Wavelength Dispersive <strong>Spectroscopy</strong>:<br />
EDAX offers parallel beam WDS<br />
products for elemental analysis on<br />
SEM electron-beam microscopes.<br />
Fluorescent X-ray Detectors: EDAX supplies<br />
Si(Li) Detectors and Silicon Drift<br />
Detectors, which are capable of<br />
handling count rates of over<br />
1,000,000 cps and parallel beam<br />
wavelength dispersive spectrometers.<br />
Facilities<br />
EDAX headquarters is located in Mahwah,<br />
New Jersey, housing sales, technical<br />
support and manufacturing operations.<br />
EDAX is committed to providing the best<br />
possible support for our customers worldwide<br />
with sales, service, and applications<br />
support offices located in Japan, China,<br />
Singapore, The Netherlands, Germany, UK,<br />
and the United States.
26 SPECTROSCOPY CORPORATE CAPABILITIES DECEMBER 2009 www.spectroscopyonline.com<br />
CVI Melles Griot<br />
CVI Melles Griot<br />
Lasers<br />
2051 Palomar Airport Road, 200<br />
Carlsbad, CA 92011<br />
TELEPHONE<br />
(760) 438-2131<br />
E-MAIL<br />
lasers@cvimellesgriot.com<br />
CVI Melles Griot<br />
Optics & Assemblies:<br />
200 Dorado Place SE<br />
Albuquerque, NM 87123<br />
TELEPHONE<br />
(505) 296-9541<br />
E-MAIL<br />
optics@cvimellesgriot.com<br />
WEB SITE<br />
www.cvimellesgriot.com<br />
ASIA<br />
+81 3 3407-3614<br />
EUROPE<br />
+31 316 333 041<br />
Company Description<br />
CVI Melles Griot is a leading global<br />
supplier of OEM and fast turn catalog<br />
photonics products including lasers at<br />
over 38 wavelengths, optics, coatings<br />
covering the deep ultraviolet to the<br />
infrared, opto-mechanics, and positioning<br />
equipment. The company’s unique<br />
breadth of manufacturing and design<br />
expertise in electronics, lasers, optics, coatings, and thermal<br />
management is evident in everything from simple components<br />
to precision integrated electro-optic assemblies.<br />
Chief Spectroscopic Techniques Supported<br />
⦁<br />
⦁<br />
⦁<br />
⦁<br />
⦁<br />
⦁<br />
⦁<br />
⦁<br />
⦁<br />
⦁<br />
⦁<br />
⦁<br />
⦁<br />
<strong>Spectroscopy</strong>; Microscopy<br />
Capillary electrophoresis<br />
Biotech/Medical<br />
Laser-induced fluorescence<br />
Pharmaceutical<br />
Particle characterization<br />
Semiconductor<br />
Non-contact inspection<br />
Industrial<br />
Interferometry<br />
Environmental<br />
Velocimetry<br />
Government/Military<br />
Markets Served<br />
⦁<br />
⦁<br />
⦁<br />
⦁<br />
⦁<br />
Design, development, and manufacturing on 3 continents<br />
Lasers, optics, thin films, mechanics, drive electronics<br />
Over 39 years of volume production<br />
Over 2.9 million lasers and 120 million optics shipped<br />
www.spectroscopyonline.com DECEMBER 2009 SPECTROSCOPY CORPORATE CAPABILITIES 27<br />
Fiberguide Industries, Inc.<br />
Major Products/Services<br />
⦁<br />
⦁<br />
⦁<br />
⦁<br />
⦁<br />
⦁<br />
⦁<br />
⦁<br />
⦁<br />
⦁<br />
Optical Fibers<br />
Multimode: 50 μm ~ 2000 μm Core<br />
(Silica and Hard Clad)<br />
Single Mode: 633 nm and 1550 nm<br />
Polyimide, Nylon, Tefzel, Acrylate, Hard<br />
Clad Buffers<br />
Sterilizeable: ETO, Steam, E-beam,<br />
Gamma<br />
All Material Certified to USP Class VI<br />
Biocompatibility<br />
All Materials RoHS Compliant<br />
Custom Bundles and Assemblies<br />
High Power Laser Delivery<br />
Collimators and Focus Guides<br />
Fiberguide Industries, Inc.<br />
1 Bay Street<br />
Stirling, NJ 07980<br />
TELEPHONE<br />
(908) 647-6601<br />
FAX<br />
(908) 647-8464<br />
E-MAIL<br />
info@fiberguide.com<br />
WEB SITE<br />
www.fiberguide.com<br />
NUMBER OF EMPLOYEES<br />
67<br />
YEAR FOUNDED<br />
1977<br />
Company Description<br />
Support OEM’s worldwide in taking concepts and ideas to<br />
market with line of multimode, single mode, and graded<br />
index optical fibers from UV-IR, and temperature ranges from<br />
−269 ∘C to 700 ∘C. Design/engineer assemblies using not<br />
only our own pure silica core/silica clad, silica core/plastic<br />
clad fibers, but borosilicate glass fiber, ESKA plastic optical<br />
fiber, fluoride fiber, chalcogenide fiber, erbium-doped fiber,<br />
and polarization maintaining fiber as well, with widest range<br />
of custom and standard endfittings/connectors and outer<br />
jackets to tailor a product to technical and economic requisites.<br />
Design/manufacture of ultra precision high density 2D<br />
arrays, V-Groove arrays designed for optical switches, WDM/<br />
DWDM, and arrayed active devices; and reflection/backscattering<br />
probes for measuring specular or diffuse reflection from<br />
a surface. FDA registered as a Contract Manufacturer.<br />
Chief Spectroscopic Techniques Supported<br />
All optical fiber–based assemblies for Mass Spectrometry,<br />
ICP-MS, Infrared, FT-IR, UV-VIS, Raman, NMR, X-ray, and<br />
Fluorescence.<br />
Markets Served<br />
Lifes Sciences, <strong>Spectroscopy</strong>/Instrumentation, Laser, Defense/<br />
Military, Semiconductor/Wafer Processing, Industrial, and<br />
Academic.<br />
Facilities<br />
⦁<br />
⦁<br />
⦁<br />
⦁<br />
⦁<br />
⦁<br />
NJ — 10,000 square feet with fiber<br />
draw capacity up to 150 km fiber/day.<br />
ID — 28,000 square feet vertically integrated<br />
engineering and manufacturing.<br />
FDA QSR Registered<br />
ISO9001:2008 compliant<br />
Class 10,000 assembly areas<br />
OEM cables and assemblies
28 SPECTROSCOPY CORPORATE CAPABILITIES DECEMBER 2009 www.spectroscopyonline.com<br />
FOSS NIRSystems, Inc.<br />
⦁<br />
⦁<br />
Reaction monitoring<br />
Endpoint determination.<br />
FOSS NIRSystems, Inc.<br />
7703 Montpelier Road<br />
Laurel, MD 20723<br />
TELEPHONE<br />
(301) 680-9600<br />
FAX<br />
(301) 236-0134<br />
E-MAIL<br />
info@foss-nirsystems.com<br />
WEB SITE<br />
www.foss-nirsystems.com<br />
NUMBER OF EMPLOYEES<br />
USA: 100<br />
Elsewhere: 1200<br />
YEAR FOUNDED<br />
1956<br />
Company Description<br />
FOSS NIRSystems, Inc. is a unit of FOSS A/S and the world’s<br />
leading supplier of laboratory, at-line, and process nearinfrared<br />
(NIR) solutions. FOSS NIRSystems has more than<br />
40 years of industry experience and over 18,000 successful<br />
installations worldwide. As a strategic partner to the world’s<br />
major pharmaceutical, chemical, and petrochemical companies,<br />
FOSS is committed to providing the most accurate and<br />
precise rapid test and measurement products to meet our<br />
customer’s needs.<br />
FOSS’ global distribution and support network ensure<br />
consistent product and application knowledge and superior<br />
customer technical support and training in over 65 countries<br />
worldwide. Our customers are provided with the most integrated<br />
and tested solutions including hardware, software,<br />
method development, and documentation. Following the<br />
Good Automated Manufactured Practice (GAMP), FOSS<br />
created Vision to cover both the software and hardware<br />
compliance elements of 21 CFR Part 11.<br />
Chief Spectroscopic Techniques Supported<br />
⦁<br />
Near-Infrared <strong>Spectroscopy</strong> (NIR)<br />
Markets Served<br />
We provide laboratory, at-line, and process near-infrared (NIR)<br />
solutions for use in the pharmaceutical, chemical, petrochemical,<br />
and related industries. Applications include:<br />
⦁<br />
⦁<br />
⦁<br />
⦁<br />
Raw material inspection<br />
Inspection of solids, powders and liquids<br />
Content uniformity of solid dosage forms<br />
Blending, mixing, granulation, and drying processes<br />
Major Products/Services<br />
As a Process Analytical Technology (PAT)<br />
tool, the XDS NIR Analyzer is the next<br />
generation of dedicated NIR technology<br />
for analyzing solid and liquid chemical<br />
and pharmaceutical formulations. The<br />
patented design of XDS NIR offers superior<br />
analytical performance with increased sensitivity<br />
and precise instrument matching to<br />
enhance method development, minimize<br />
implementation time and ensure seamless<br />
method transferability. XDS NIR analyzers<br />
can be used throughout your manufacturing<br />
processes – from raw material<br />
inspection and in-process testing to final<br />
product release. XDS NIR analyzers feature<br />
hot-swappable sample modules for easeof-use<br />
and sampling flexibility that can<br />
be used in both the laboratory and plant<br />
environments. Process XDS NIR analyzers<br />
are available in single and multiple point<br />
configurations, meeting most electrical<br />
area classifications. XDS NIR brings new<br />
levels of reliability, versatility, and efficiency<br />
to your applications. With XDS<br />
NIR from FOSS, you can reduce operating<br />
overhead, improve the consistency and<br />
quality of your products and optimize your<br />
manufacturing operations – XDS is the<br />
best solution for your cost effective and efficient<br />
analytical requirements.<br />
Facilities<br />
FOSS has manufacturing facilities in Sweden,<br />
Denmark, and the U.S.
www.spectroscopyonline.com<br />
Glass Expansion<br />
DECEMBER 2009 SPECTROSCOPY CORPORATE CAPABILITIES 29<br />
Glass Expansion<br />
4 Barlows Landing Road<br />
Unit #2A<br />
Pocasset, MA 02559<br />
TELEPHONE<br />
(508) 563-1800<br />
(800) 208-0097<br />
FAX<br />
(508) 563-1802<br />
E-MAIL<br />
enquiries@geicp.com<br />
WEB SITE<br />
www.geicp.com<br />
YEAR FOUNDED<br />
1985<br />
Company Description<br />
Glass Expansion has been manufacturing sample introduction<br />
components for ICP emission and mass spectrometers since<br />
the early 1980s. Today we support both new and old instruments<br />
for 16 different manufacturers, representing sample<br />
introduction systems for over 50 different ICP-AES and ICP-MS<br />
models. Glass Expansion has developed unique and proprietary<br />
manufacturing methods, which have resulted in the<br />
production of components of high mechanical strength and<br />
micron-level dimensional accuracy to satisfy the narrowest of<br />
analytical specifications, each and every time. Our products<br />
are recognized worldwide for their excellent precision,<br />
cost-effectiveness, and reproducibility of results.<br />
Chief Spectroscopic Techniques Supported<br />
⦁<br />
⦁<br />
ICP-AES<br />
ICP-MS<br />
Markets Served<br />
Glass Expansion’s products are used widely in private and<br />
government analytical laboratories within agricultural, environmental,<br />
food, forensic, geological, metallurgical, petrochemical,<br />
and pharmaceutical industries. We support leading<br />
ICP models including Thermo Fisher, PerkinElmer, Varian,<br />
Agilent, SPECTRO Ametek, and Horiba J-Y. Whether you need<br />
just a nebulizer, a complete sample introduction system, or<br />
the answer for a tricky sample, we have the innovative, highquality<br />
products and applications expertise to assist.<br />
Major Products/Services<br />
Nebulizers<br />
⦁<br />
⦁<br />
⦁<br />
⦁<br />
⦁<br />
⦁<br />
⦁<br />
SeaSpray — High Dissolved Solids<br />
Nebulizer<br />
MicroMist — Low Uptake Nebulizer for<br />
all ICPs<br />
Conikal — An Industry Standard<br />
Slurry — For Slurries and Suspensions<br />
PolyCon — Routine High-Precision HF<br />
Analyses<br />
OpalMist — Ideal for Geochemistry and<br />
Semiconductor Industry<br />
VeeSpray — Handles High Particle and<br />
TDS Loads Best.<br />
Spray Chambers<br />
⦁<br />
⦁<br />
⦁<br />
⦁<br />
Tracey Cyclonic — An Industry Standard<br />
Twister Cyclonic — Reduces Solvent<br />
Load<br />
Cinnabar Cyclonic — Low-Volume Spray<br />
IsoMist programmable temperature<br />
spray chamber<br />
Torches<br />
⦁<br />
⦁<br />
⦁<br />
Fully Demountable D-Torches<br />
Semi-Demountable Torches<br />
Fixed Quartz Torches<br />
RF Coils<br />
Replacement RF Coils with optional silver<br />
or gold coating.<br />
Accesories<br />
⦁<br />
⦁<br />
⦁<br />
Niagara Plus – Enhanced productivity<br />
accessory<br />
Capricorn – Argon humidifier<br />
TruFlo – sample uptake monitor<br />
Facilities<br />
Today, Glass Expansion has two global<br />
offices located in Australia and the United<br />
States. Between our two offices and<br />
network of distributors, we service every<br />
region of the globe, 24 hours a day. This<br />
ensures you receive a rapid response and<br />
timely order deliveries each and every<br />
time.
30 SPECTROSCOPY CORPORATE CAPABILITIES DECEMBER 2009 www.spectroscopyonline.com<br />
Harrick Scientific Products, Inc.<br />
Harrick Scientific<br />
Products, Inc.<br />
141 Tompkins Ave,<br />
2nd Floor<br />
Pleasantville, NY 10570<br />
TELEPHONE<br />
(800) 248-3847<br />
FAX<br />
(914) 747-7209<br />
E-MAIL<br />
info@harricksci.com<br />
WEB SITE<br />
www.harricksci.com<br />
NUMBER OF EMPLOYEES<br />
21<br />
YEAR FOUNDED<br />
1969<br />
Company Description<br />
Harrick Scientific Products specializes in designing and<br />
manufacturing instruments for optical spectroscopy. Since<br />
being established in 1969, Harrick Scientific has advanced<br />
the frontiers of optical spectroscopy through its innovations<br />
in all spectroscopic techniques. The founder of the company,<br />
Dr. N.J. Harrick, pioneered ATR (attenuated total reflection)<br />
spectroscopy and became the principal developer of this<br />
technique. Harrick Scientific offers a complete selection of<br />
sampling accessories, including both standard and custom<br />
designs, as well as an extensive line of optical elements.<br />
Chief Spectroscopic Techniques Supported<br />
⦁<br />
⦁<br />
⦁<br />
⦁<br />
⦁<br />
Transmission<br />
Specular reflection<br />
Diffuse reflection<br />
ATR<br />
Fiberoptics<br />
Markets Served<br />
Harrick Scientific serves analytical markets worldwide.<br />
Harrick’s customers typically are from research or quality<br />
control laboratories of industrial, governmental, research, and<br />
academic institutions throughout the world. Industries served<br />
include chemical, electronic, pharmaceutical, forensics, and<br />
biomedical.<br />
Major Products/Services<br />
Harrick Scientific offers the most complete<br />
line of spectroscopy sampling products,<br />
including:<br />
⦁<br />
⦁<br />
⦁<br />
⦁<br />
⦁<br />
⦁<br />
⦁<br />
⦁<br />
⦁<br />
Video Meridian — a diamond micro ATR<br />
accessory with built-in camera<br />
MVP Pro Star — an affordable<br />
monolithic diamond ATR accessory<br />
Praying Mantis — a diffuse reflectance<br />
accessory available with environmental<br />
chambers/reaction cells<br />
Seagull — a variable angle specular<br />
reflection and ATR accessory<br />
VariGATR — a variable angle grazing<br />
angle ATR accessory for monolayers on<br />
Gold and Silicon substrates<br />
FiberMate 2 — an interface between<br />
spectrometers and fiberoptic applications<br />
MultiLoop, Omni-Diff, and<br />
Omni-Spec — fiberoptic probes for ATR,<br />
diffuse reflection, and specular<br />
reflection<br />
A variety of liquid and gas transmission<br />
cells<br />
Custom design development<br />
Facilities<br />
Harrick Scientific Products is located 30<br />
miles north of New York City in Pleasantville,<br />
New York. Our products are also<br />
available through FT-IR and UV/Vis spectrometer<br />
manufacturers, as well as distributors<br />
in the United States and throughout<br />
the world.
www.spectroscopyonline.com<br />
DECEMBER 2009 SPECTROSCOPY CORPORATE CAPABILITIES 31<br />
Hitachi High Technologies America<br />
Markets Served<br />
Hitachi offers a wide variety of high-quality<br />
UV-Vis/NIR and Fluorescence spectroscopy<br />
systems designed for various applications<br />
from simple, routine analyses to leading<br />
edge research-grade experiments.<br />
Hitachi High<br />
Technologies America<br />
5100 Franklin Drive<br />
Pleasanton, CA 94588<br />
TELEPHONE<br />
(800) 548-9001<br />
FAX<br />
(925) 218-2900<br />
E-MAIL<br />
Sales-LS@hitachi-hta.com<br />
WEB SITE<br />
http://www.hitachi-hta.com/<br />
LShome<br />
NUMBER OF EMPLOYEES<br />
450<br />
YEAR FOUNDED<br />
1979<br />
Company Description<br />
Hitachi High Technologies America, Inc. (HTA), located in<br />
Schaumburg, Illinois, is the North American Division headquarters<br />
for Hitachi High Technologies Corporation (Tokyo,<br />
Japan). Hitachi has a distinguished 40 year history of providing<br />
a very broad range of high-quality analytical equipment<br />
and services in North America. HTA comprises many divisions,<br />
including the Life Sciences Division located in Pleasanton,<br />
California. HTA’s Life Sciences Division markets, sells, and services<br />
LC–MS, UV-Vis/Fluorescence spectroscopy, liquid chromatography,<br />
and amino acid analysis instrumentation. HTA’s<br />
activities include application development, customer support<br />
and service, product development, application, training, sales,<br />
and marketing.<br />
Chief Spectroscopic Techniques Supported<br />
⦁<br />
⦁<br />
⦁<br />
⦁<br />
⦁<br />
⦁<br />
⦁<br />
UV <strong>Spectroscopy</strong><br />
Fluorescence <strong>Spectroscopy</strong><br />
Liquid chromatography – mass spectrometry<br />
Ultra high-speed liquid chromatography<br />
High performance liquid chromatography<br />
Dedicated amino acid analysis<br />
Diffraction gratings<br />
Major Products/Services<br />
The state-of-the-art spectrofluorometer,<br />
the Model F-7000, has set a new standard<br />
in performance with ultra-high sensitivity<br />
(S/N: 800) and high-speed scanning<br />
(60,000 nm/min).<br />
The Model U-3900 double-beam singlemonochromator<br />
system and the Model<br />
U-3900H double-beam double-monochromator<br />
system are high-performance,<br />
comprehensive, research-grade solutions<br />
for a variety of applications.<br />
Hitachi’s new LachromUltra is a flexible<br />
new Ultra High-Speed Liquid Chromatograph,<br />
delivering ultra-fast analysis, higher<br />
resolution, increased sensitivity and the<br />
flexibility to run both conventional and ultra-high<br />
resolution LC analyses on a single<br />
system. LaChromUltra is the practical next<br />
generation LC solution that meets the<br />
needs and budget of analytical<br />
laboratories.<br />
The Hitachi LaChrom Elite HPLC System<br />
and the L-8900 Amino Acid Analyzer continue<br />
to set the standard for performance<br />
and reliability, demonstrating unparalleled<br />
analytical sensitivity.<br />
Facilities<br />
Pleasanton, California, is the headquarters<br />
for the Life Sciences Division and includes<br />
R&D, sales, marketing, service, and customer<br />
support. HTA also offers extensive<br />
field sales, service, and support capabilities<br />
throughout the US, Canada, and Mexico.
32 SPECTROSCOPY CORPORATE CAPABILITIES DECEMBER 2009 www.spectroscopyonline.com<br />
HORIBA Scientific<br />
⦁<br />
⦁<br />
⦁<br />
⦁<br />
⦁<br />
⦁<br />
⦁<br />
⦁<br />
Forensic Science<br />
Life Sciences<br />
Medical<br />
Metals, Plastics, Polymers, etc.<br />
Optoelectronics<br />
Petroleum<br />
Pharmaceuticals<br />
Semiconductors<br />
HORIBA Scientific<br />
3880 Park Avenue<br />
Edison, NJ 08820<br />
TELEPHONE<br />
(732) 494-8660<br />
FAX<br />
(732) 494-5125<br />
E-MAIL<br />
info.sci@horiba.com<br />
WEB SITE<br />
www.horiba.com/scientific<br />
NUMBER OF EMPLOYEES<br />
USA: 600<br />
Elsewhere: 5000<br />
YEAR FOUNDED<br />
1819<br />
Company Description<br />
HORIBA Scientific is a leading manufacturer of innovative<br />
spectroscopic systems and components, and we are committed<br />
to serving our customers with superior products and<br />
technical support in optical spectroscopy.<br />
HORIBA Scientific is part of the HORIBA Group, which employs<br />
5000 people worldwide, with annual sales in excess of<br />
$1.5 billion. HORIBA Jobin Yvon, Sofie, Dilor, Spex®, and IBH<br />
are some of our well-known and respected brand names.<br />
Chief Spectroscopic Techniques Supported<br />
⦁<br />
⦁<br />
⦁<br />
⦁<br />
⦁<br />
⦁<br />
⦁<br />
Molecular Fluorescence <strong>Spectroscopy</strong><br />
Optical <strong>Spectroscopy</strong><br />
Raman <strong>Spectroscopy</strong> and Microscopy<br />
Ellipsometry and Thin-Film Analysis<br />
Atomic Emission <strong>Spectroscopy</strong><br />
Fluorescence<br />
Forensic Science<br />
Markets Served<br />
⦁<br />
⦁<br />
⦁<br />
Academia<br />
Coatings<br />
Environmental<br />
Major Products/Services<br />
⦁<br />
⦁<br />
⦁<br />
⦁<br />
⦁<br />
⦁<br />
⦁<br />
⦁<br />
⦁<br />
⦁<br />
⦁<br />
⦁<br />
⦁<br />
⦁<br />
⦁<br />
⦁<br />
⦁<br />
⦁<br />
⦁<br />
<strong>Spectroscopy</strong> and Analysis<br />
Elemental Analyzers<br />
Ellipsometers<br />
End-Point Detectors<br />
Fluorescence<br />
Gratings<br />
ICP & GD Spectrometers<br />
Lifetime Fluorescence<br />
Microscopy<br />
OEM Components<br />
Particle-Size Analyzers<br />
Process Control<br />
Raman & FT-IR<br />
Spectrographs<br />
Spectrometers and CCDs<br />
VUV equipment<br />
X-Ray Fluorescence<br />
Surface Plasmon Resonance Imaging<br />
(SPRi)<br />
Particle-Size Systems<br />
Facilities<br />
HORIBA Scientific manufactures quality<br />
instruments in Edison, New Jersey, as well<br />
as France and Japan.<br />
Sales, service, and applications facilities<br />
are located around the world. We are an<br />
ISO 9001:2008-certified company.
www.spectroscopyonline.com<br />
OptiGrate Corp.<br />
DECEMBER 2009 SPECTROSCOPY CORPORATE CAPABILITIES 33<br />
OptiGrate Corp.<br />
3267 Progress Drive<br />
Orlando, FL 32826<br />
TELEPHONE<br />
(407) 381-4115<br />
FAX<br />
(407) 384-5995<br />
E-MAIL<br />
info@optigrate.com<br />
WEB SITE<br />
www.OptiGrate.com<br />
NUMBER OF EMPLOYEES<br />
20<br />
YEAR FOUNDED<br />
1999<br />
Company Description<br />
OptiGrate Corp. designs and manufactures ultra narrow band<br />
optical filters based on volume Bragg grating (VBG) technologies<br />
in proprietary photosensitive glass. Filters with bandwidth<br />
as low as 30 pm are formed by holographic techniques in the<br />
bulk of glass material and demonstrate superior optical quality,<br />
outstanding durability, and high optical damage threshold.<br />
OptiGrate is a pioneer and world leader in VBG technologies<br />
and, for over 10 years, OptiGrate has delivered custom build<br />
and volume orders of holographic optical elements (HOE) to<br />
government contractors, industrial manufacturers, and key<br />
academic players. OptiGrate has an exclusive license to a full<br />
portfolio of unique VBG-based products deployed in various<br />
industries.<br />
Markets Served<br />
OptiGrate supplied ultra narrow band filters to hundreds of<br />
customers on 5 continents. The filters are used in a wide<br />
range of applications in optoelectronic, analytical, defense,<br />
and semiconductor industries. Major markets include:<br />
⦁<br />
⦁<br />
⦁<br />
⦁<br />
⦁<br />
⦁<br />
⦁<br />
Raman spectroscopy and microscopy<br />
Semiconductor, solid state, and fiber lasers<br />
Hyperspectral and Raman imaging<br />
Photonics applications in defense sector<br />
Ultrafast laser systems<br />
Optical recording and storage<br />
Medical diagnostics and treatment<br />
Major Products/Services<br />
⦁<br />
Notch Filters — laser line rejection filters with bandwidth<br />
less than 10 cm -1<br />
⦁<br />
⦁<br />
⦁<br />
⦁<br />
⦁<br />
Bandpass Filters — laser side-mode<br />
suppression filters with bandwidth less<br />
than 10 cm -1<br />
Laser resonator mode selection filter for<br />
spectral narrowing and thermal stabilization<br />
of lasers<br />
Deflectors — transmitting volume Bragg<br />
grating for angular filtering and deflection<br />
of laser light<br />
Chirped volume Bragg grating for ultrashort<br />
laser pulse stretching and<br />
compression<br />
Spectral Beam Combiner — angular<br />
and spectral filters for high-power laser<br />
spectral beam combining<br />
Facilities<br />
OptiGrate designs, develops, and makes<br />
all products in Orlando, Florida. The volume<br />
Bragg grating filters are manufactured<br />
in a unique, vertically integrated facility<br />
that includes photosensitive glass production<br />
facility, holographic facility, and laser<br />
development facility. OptiGrate’s internal<br />
capability to develop, fine-tune, and mass<br />
produce photosensitive glass, the core of<br />
VBG technology, provides better process<br />
control and stability and also enables<br />
fabrication of filters with record characteristics.
34 SPECTROSCOPY CORPORATE CAPABILITIES DECEMBER 2009 www.spectroscopyonline.com<br />
International Centre for Diffraction Data<br />
International Centre for<br />
Diffratcion Data<br />
12 Campus Boulevard<br />
Newton Square, PA 19073<br />
TELEPHONE<br />
(610) 325-9814<br />
(866) 378- 9331<br />
FAX<br />
(610) 325-9823<br />
E-MAIL<br />
info@icdd.com<br />
WEB SITE<br />
www.icdd.com<br />
YEAR FOUNDED<br />
1941<br />
Company Description<br />
ICDD, a not-for-profit corporation, is dedicated to the collecting,<br />
editing, and publishing of the Powder Diffraction File<br />
(PDF ® ). Our mission is to be the world center for quality diffraction<br />
data meeting the needs of the technical community.<br />
We promote the application of materials characterization<br />
methods by sponsoring the Denver X-ray Conference; its proceedings,<br />
Advances in X-ray Analysis, and the journal, Powder<br />
Diffraction. ICDD and its members conduct workshops and<br />
clinics on materials characterization at our headquarters in<br />
Newton Square, Pennsylvania and at X-ray analysis workshops<br />
around the world.<br />
Chief Spectroscopic Techniques Supported<br />
⦁<br />
⦁<br />
⦁<br />
X-ray Diffraction<br />
Electron Diffraction<br />
Electron Backscatter Diffraction<br />
Markets Served<br />
The Powder Diffraction File is designed for materials identification<br />
and characterization. ICDD databases are used worldwide<br />
by scientists in academia, government, and industry who<br />
are actively engaged in the field of X-ray powder diffraction<br />
and related disciplines.<br />
Major Products/Services<br />
Release 2009 of the Powder Diffraction File contains over<br />
662,000 unique material data sets. Each data set contains<br />
diffraction, crystallographic, and bibliographic data, as well as<br />
experimental, instrument, and sampling conditions and select<br />
physical properties in common standardized<br />
format. The PDF’s large size and comprehensive<br />
material coverage is achieved<br />
through ICDD’s historial sources of powder<br />
diffraction data, ICDD’s Grant-in-Aid<br />
Program, contributions, and bibliographic<br />
searches, as well as collaborations with<br />
international crystallographic database<br />
organizations. The database is designed<br />
and produced in several different formats<br />
(PDF-4+, PDF-2, PDF-4/Minerals, and<br />
PDF-4/Organics) in order to serve different<br />
groups of users.<br />
PDF-4+ 2009 is our advanced database<br />
with comprehensive material coverage<br />
for inorganic materials. The database is a<br />
powerful tool for phase identification using<br />
physical, chemical, and crystallographic<br />
data. It contains numerous features, such<br />
as 291,440 data sets, digitized patterns,<br />
molecular graphics, and atomic parameters.<br />
Many new features have been incorporated<br />
into the PDF-4+ to enhance the<br />
ability to do quantitative analysis by any<br />
of three methods: Rietveld Analysis, Reference<br />
Intensity Ratio (RIR) method, or Total<br />
Pattern Analysis. PDF-4+ also features<br />
electron diffraction simulations based on<br />
atomic structure and electron diffraction<br />
scattering factors on >260,000 data sets.<br />
The simulations include electron diffraction<br />
powder pattern, spot pattern, and<br />
electron diffration backscatter pattern.
36 SPECTROSCOPY CORPORATE CAPABILITIES DECEMBER 2009 www.spectroscopyonline.com<br />
IDEX Health & Science<br />
Major Products/Services<br />
⦁<br />
⦁<br />
⦁<br />
⦁<br />
⦁<br />
⦁<br />
⦁<br />
⦁<br />
⦁<br />
Precision fluidic research, development,<br />
and engineering<br />
Integrated fluidic subassemblies<br />
Liquid handling systems<br />
Low volume, high precision pumps,<br />
including positive displacement, peristaltic,<br />
piston and gear technologies<br />
Shear valves<br />
Debubbler and degassing systems<br />
Manifolds and precision machined<br />
plastic components<br />
Custom tubing and assemblies<br />
Connections and flow control products<br />
IDEX Health & Science<br />
619 Oak Street<br />
Oak Harbor, WA 98277<br />
TELEPHONE<br />
(866) 339-4653<br />
FAX<br />
(360) 682-4151<br />
E-MAIL<br />
HealthandScience@idexcorp.com<br />
WEB SITE<br />
www.idex-hs.com<br />
Company Description<br />
IDEX Health & Science designs, develops, and manufactures<br />
liquid subassemblies and precision components for a wide<br />
range of applications requiring precise control and measurement.<br />
We specialize in component integration that results in<br />
innovative and optimized OEM fluidic systems. IDEX Health<br />
& Science is the synthesis of leading component and technology<br />
suppliers to the analytical instrument, diagnostics,<br />
biotechnology, industrial, and semiconductor markets. Our<br />
brands include Eastern Plastics, Innovadyne, Ismatec, Isolation<br />
Technologies, Rheodyne, Sapphire Engineering, Systec, and<br />
Upchurch Scientific.<br />
Chief Spectroscopic Techniques Supported<br />
⦁<br />
⦁<br />
⦁<br />
⦁<br />
⦁<br />
UV/Visible<br />
Infrared (including FT-IR & NIRS)<br />
Fluorescence<br />
Mass <strong>Spectroscopy</strong><br />
Laser (including Raman)<br />
Markets Served<br />
⦁<br />
⦁<br />
⦁<br />
⦁<br />
⦁<br />
⦁<br />
⦁<br />
Analytical Instrumentation<br />
Biotech<br />
In Vitro Diagnostics<br />
Medical Device<br />
Medical Equipment<br />
Industrial<br />
Semiconductor<br />
Facilities<br />
Manufacturing facilities in North America<br />
and Asia. Class 1,000, 10,000, and<br />
100,000 Clean Rooms.<br />
.
38 SPECTROSCOPY CORPORATE CAPABILITIES DECEMBER 2009 www.spectroscopyonline.com<br />
Inorganic Ventures<br />
Development, Textile, Transportation, and<br />
Wastewater Treatment, to name a few.<br />
Inorganic Ventures<br />
300 Technology Drive<br />
Christiansburg, VA 24073<br />
TELEPHONE<br />
(800) 669-6799 (US &<br />
Canada)<br />
(540) 585-3030<br />
FAX<br />
(540) 585-3012<br />
E-MAIL<br />
info@inorganicventures.com<br />
WEB SITE<br />
inorganicventures.com<br />
YEAR FOUNDED<br />
1985<br />
Company Description<br />
Inorganic Ventures is the only standard manufacturer to specialize<br />
in the formulation of custom inorganic solutions. We<br />
excel in providing service and support tailored to your specific<br />
needs. In short, we flex to your specs.<br />
Our specialization in custom blending means that we can<br />
create precise standards faster than other manufacturers. Over<br />
99% of our custom blends ship within five business days or<br />
less. In addition to customization, we offer a wide selection<br />
of stock inorganic standards. Contact us to receive our new<br />
catalog.<br />
For nearly a decade, Inorganic Ventures has been registered<br />
to ISO Guide 34, ISO/IEC 17025 and ISO 9001:2000 by<br />
A2LA and QMI.<br />
Chief Spectroscopic Techniques Supported<br />
⦁<br />
⦁<br />
⦁<br />
⦁<br />
⦁<br />
⦁<br />
ICP-OES/AES<br />
ICP-MS<br />
IC<br />
AA<br />
GFAA<br />
DCP<br />
Markets Served<br />
We provide custom and conventional certified reference materials<br />
for dozens of markets, including Aeronautical, Agricultural,<br />
Automotive, Chemical, Colleges and Universities, Construction,<br />
Cosmetic, Energy, Environmental, Food Industries,<br />
Government Agencies, Medical, Metallurgical, Military, Mining,<br />
Nuclear, Petroleum, Pharmaceutical, Plastics, Research and<br />
Major Products/Services<br />
Our specialists customize and manufacture<br />
inorganic standards for laboratories<br />
worldwide. We create aqueous calibration<br />
standards, quality control standards, and<br />
chemical reagents, plus a wide selection<br />
of ion chromatography standards and<br />
CRMs for the latest EPA methods. Over<br />
99% of our custom solutions ship within<br />
five business days. Stock orders ship<br />
same-day prior to 4:00 pm EST. Experts<br />
are available during regular business hours<br />
to provide in-depth technical support. Furthermore,<br />
the Inorganic Ventures’ website,<br />
inorganicventures.com, has been cited by<br />
chemists as one of the best sources for<br />
analytical support on the Web.<br />
Facilities<br />
In 2009 we completed our corporate relocation<br />
to our new state-of-the-art manufacturing<br />
laboratory in Christiansburg,<br />
Virginia. This eco-friendly laboratory offers<br />
contamination-free manufacturing during<br />
every stage of production. Most foreign<br />
orders ship from our European distribution<br />
center in Madrid, Spain.
40 SPECTROSCOPY CORPORATE CAPABILITIES DECEMBER 2009 www.spectroscopyonline.com<br />
KLASTECH Karpushko Laser<br />
Technologies<br />
Major Products/Services<br />
KLASTECH CW DPSS portfolio includes<br />
lasers at 1064 nm (SENZA), 694.3 nm<br />
(CRESCENDO) , 532 nm (SYMPHONY &<br />
SCHERZO), 488 nm (BLUE NOTE), 266<br />
nm (VERVE), and 442 nm (Concerto) with<br />
other wavelengths in development. All<br />
KLASTECH lasers are inherently single frequency<br />
in performance.<br />
Facilities<br />
KLASTECH manufactures all its lasers in<br />
its state of the art facility in Dortmund,<br />
Germany that includes the latest ESD protected<br />
laboratories and production clean<br />
rooms.<br />
KLASTECH Karpushko<br />
Laser Technologies<br />
Konrad-Adenauer-Allee 11<br />
44263 Dortmund, Germany<br />
TELEPHONE<br />
49 (0) 231 477 30 648<br />
FAX<br />
49 (0) 231 477 30 620<br />
E-MAIL<br />
n.steinkretzer@klastech.de<br />
WEB SITE<br />
www.klastech.com<br />
NUMBER OF EMPLOYEES<br />
USA: 1<br />
Elsewhere: 24<br />
Company Description<br />
KLASTECH specializes in the manufacturing of an entirely<br />
new and completely revolutionary range of CW DPSS lasers.<br />
Powered by our patented intra-cavity frequency doubling<br />
technology our range includes the world’s first and only true<br />
CW ruby laser, a revolutionary new CW 266 nm laser and due<br />
for release in December, a direct DPSS alternative to the He-<br />
Cd gas laser. Our 1064 nm, 532 nm, and 488 nm lasers complete<br />
our comprehensive portfolio. Our technology inherently<br />
delivers lasers that produce Pitch Perfect, ultra quiet, single<br />
frequency laser light with diffraction limited beam profiles,<br />
enabling analytical instrument designers and researchers alike<br />
to surpass their highest expectations.<br />
Chief Spectroscopic Techniques Supported<br />
⦁<br />
⦁<br />
Raman<br />
Bio-fluorescence<br />
Markets Served<br />
KLASTECH DPSS lasers are used widely by spectroscopists in<br />
research and by instrument designers due to their inherent<br />
single frequency nature and their long term power and beam<br />
pointing stability.<br />
YEAR FOUNDED<br />
2005
42 SPECTROSCOPY CORPORATE CAPABILITIES DECEMBER 2009 www.spectroscopyonline.com<br />
Moxtek, Inc.<br />
Major Products/Services<br />
ProFlux Wiregrid polarizers<br />
High transmission and contrast inorganic<br />
polarizers for UV, Visible, and IR<br />
applications.<br />
Magnum miniature x-ray sources<br />
The leading x-ray source technology for<br />
handheld and bench top x-ray analysis<br />
applications<br />
XPIN Detectors<br />
The latest generation of affordable<br />
Si-PIN detectors for x-ray fluorescence<br />
spectrometry<br />
AP3 and ProLINE windows<br />
Ultrathin polymer windows for energy and<br />
wavelength dispersive spectroscopy<br />
DuraBeryllium windows<br />
Most rugged and reliable beryllium windows<br />
available for x-ray applications<br />
MX series JFET<br />
The lowest noise JFET available for x-ray<br />
detection systems.<br />
Facilities<br />
Headquarters in Orem, Utah.<br />
Moxtek, Inc.<br />
452 W 1260 N<br />
Orem, UT 84057<br />
TELEPHONE<br />
(801) 225-0930<br />
Toll-free: (800) 758-3110<br />
FAX<br />
(801) 221-1121<br />
E-MAIL<br />
Moxtek@moxtek.com<br />
WEB SITE<br />
www.moxtek.com<br />
NUMBER OF EMPLOYEES<br />
105<br />
YEAR FOUNDED<br />
1986<br />
Company Description<br />
We are a leading supplier of x-ray and optical components for<br />
analytical instrumentation and display electronics. Products<br />
include the new XPIN high-performance Si-PIN x-ray<br />
detectors; Magnum miniature low-power x-ray sources;<br />
AP3 and DuraBeryllium x-ray windows for EDS; ProLINE<br />
windows for WDS; and ProFlux wire-grid polarizers and beam<br />
splitters for UV, Visible, and IR spectroscopy. MOXTEK is well<br />
known for advanced technology, innovative solutions, and<br />
excellent customer service.<br />
Chief Spectroscopic Techniques Supported<br />
⦁<br />
⦁<br />
⦁<br />
⦁<br />
⦁<br />
Energy dispersive x-ray spectroscopy<br />
Wavelength dispersive x-ray spectroscopy<br />
X-ray diffraction<br />
Microanalysis<br />
UV, Visible, IR spectrometry<br />
Markets Served<br />
Moxtek, Inc. serves the analytical instrumentation and<br />
projection display markets.<br />
Customer Support<br />
Technical support is provided by our team<br />
of skilled electronics, mechanical, and<br />
process engineers.
44 SPECTROSCOPY CORPORATE CAPABILITIES DECEMBER 2009 www.spectroscopyonline.com<br />
Newport Corporation<br />
of product innovation and expertise.<br />
Together they deliver a synergy of knowledge<br />
across a broad spectrum of products,<br />
along with the ability to deliver unsurpassed<br />
solutions and integration.<br />
Newport Corporation<br />
1791 Deere Avenue<br />
Irvine, CA 92606<br />
TELEPHONE<br />
(800) 222-6440<br />
FAX<br />
(949) 253-1800<br />
E-MAIL<br />
sales@newport.com<br />
WEB SITE<br />
www.newport.com<br />
YEAR FOUNDED<br />
1969<br />
Company Description<br />
Newport is a world leading supplier of innovative photonic<br />
solutions to Make, Manage, and Measure Light SM . The company’s<br />
broad product portfolio includes an extensive selection<br />
of lasers, high-quality light sources, optomechanics, optics,<br />
filters, gratings, crystals, optical tables, and motion systems.<br />
As the industry’s first and only integrated supplier of laser and<br />
photonic components, Newport does more than just deliver<br />
components. They also leverage a unique ability to integrate<br />
multiple core technologies, a full range of engineering design<br />
services, metrology certification, manufacturing control programs,<br />
and world-class service and support, and offer a wide<br />
variety of subsystems, subassembly, and turnkey systems to<br />
our customers.<br />
Chief Spectroscopic Techniques Supported<br />
⦁<br />
⦁<br />
⦁<br />
⦁<br />
⦁<br />
UV–Vis<br />
Infrared<br />
Fluorescence<br />
Raman<br />
Ultrafast<br />
Markets Served<br />
Newport provides advanced-technology products to the<br />
research, aerospace and defense, life and health sciences,<br />
photovoltaics, semiconductor, and microelectronics markets.<br />
For over 40 years Newport has continued to grow and<br />
today is built upon world-class brands such as; Corion ® ,<br />
New Focus, Oriel ® Instruments, Richardson Gratings and<br />
Spectra-Physics ® . Alone, each of these brands has a rich history<br />
Major Products/Services<br />
As a combined force, Newport, and its<br />
family of brands, is a premier global<br />
resource for solutions to Make, Manage,<br />
and Measure light. Newport’s breadth<br />
of product offerings combined with our<br />
experience and expertise allow us to<br />
meet our customers at any place on the<br />
technology roadmap. Our lasers, photonic<br />
instrumentation, optical tables, motion<br />
control solutions, optics, filters, gratings,<br />
opto-mechanics, and spectroscopy instruments<br />
are used in research and scientific<br />
laboratories, microelectronics and semiconductor<br />
manufacturing, life & health sciences,<br />
aerospace & defense, and industrial<br />
manufacturing. Expanding upon its 40+<br />
year history of innovation in photonics,<br />
Newport is a single-source provider for all<br />
your laser and photonics needs.<br />
Facilities<br />
Newport Corporation has offices in over<br />
10 countries worldwide, including over<br />
600,000 square feet of office and manufacturing<br />
space. The company is headquartered<br />
in Irvine, California. This facility<br />
houses sales, marketing, engineering,<br />
and manufacturing, including facilities for<br />
optics, opto-mechanical assemblies, and<br />
instrumentation. The Spectra-Physics and<br />
New Focus laser manufacturing facilities<br />
are headquartered in Santa Clara, California.<br />
Other offices include Oriel spectroscopy<br />
products in Stratford, Connecticut;<br />
Richardson gratings in Rochester, New<br />
York; Corion filter products and replicated<br />
mirrors in Franklin, Massachusetts; manufacturing<br />
facilities in Darmstadt, Germany,<br />
and Evry, France; and numerous local<br />
sales offices throughout Europe and Asia.
www.spectroscopyonline.com<br />
DECEMBER 2009 SPECTROSCOPY CORPORATE CAPABILITIES 45<br />
Nippon Instruments North America<br />
⦁<br />
⦁<br />
budget requirements. These analyzers<br />
provide simple, highly effective results<br />
for such methods as EPA 245.1.<br />
Model RA-3420 Mercury Analyzer: A<br />
unique analyzer that performs the typical<br />
EPA Method 245.1 analysis in a fully<br />
automatic sequence, including sample<br />
preparation.<br />
Model PE-1000 Mercury Analyzer: A<br />
specifically designed mercury analyzer<br />
for direct, automated analysis of mercury<br />
in liquid and gaseous hydrocarbons.<br />
Nippon Instruments<br />
North America<br />
1511 Texas Ave S #270<br />
College Station, TX 77840<br />
TELEPHONE<br />
(979) 774-3800<br />
FAX<br />
(979) 774-3807<br />
E-MAIL<br />
sales@hg-nic.us<br />
WEB SITE<br />
www.hg-nic.us<br />
NUMBER OF EMPLOYEES<br />
19<br />
YEAR FOUNDED<br />
2003<br />
Company Description<br />
Nippon Instruments North America is the regional office for<br />
Nippon Instruments Corporation-Japan. Nippon Instruments<br />
has over 30 years of experience in the design and manufacture<br />
of high-quality mercury analyzers. With an absolute focus<br />
on mercury analyzers, Nippon Instruments offers mercury<br />
analyzers for just about every application. From systems for<br />
most EPA Methods to direct mercury analyzers to online<br />
monitoring systems to specially designed systems for the petrochem<br />
industry, Nippon Instruments has a mercury analyzer<br />
for your laboratory.<br />
Chief Spectroscopic Techniques Supported<br />
⦁<br />
⦁<br />
Atomic Absorption <strong>Spectroscopy</strong><br />
Atomic Fluorescence <strong>Spectroscopy</strong><br />
Markets Served<br />
Nippon Instruments provides mercury analyzers for EPA compliance<br />
monitoring in the environmental, government,and<br />
industrial markets. We provide highly versatile systems for the<br />
research and education markets, as well as mercury analyzers<br />
that are specifically designed for the unique tasks of the<br />
industrial and petrochem markets.<br />
Major Products/Services<br />
⦁<br />
⦁<br />
Model MA-2000 Mercury Analyzer: A direct mercury<br />
analyzer that allows for mercury analysis of just about any<br />
matrix without the need for sample preparation.<br />
Model RA-3000 Series Mercury Analyzers: Mercury analyzers<br />
with several configurations available to fit various<br />
Facilities<br />
Nippon Instruments North America is in<br />
the final stages of building a new office in<br />
College Station, Texas, in order to continue<br />
to expand our capabilities. Nippon Instruments<br />
Corporation currently maintains offices<br />
in Osaka and Tokyo, Japan, as well as<br />
an additional office in Singapore.
46 SPECTROSCOPY CORPORATE CAPABILITIES DECEMBER 2009 www.spectroscopyonline.com<br />
Ocean Optics, Inc.<br />
the research community has embraced<br />
our systems and components for everything<br />
from cancer detection to solar cell<br />
analysis. In fact, you can find Ocean Optics<br />
products in virtually any application from<br />
food safety to forensics and from semiconductors<br />
to marine biology.<br />
Ocean Optics<br />
830 Douglas Ave.<br />
Dunedin, FL 34698<br />
TELEPHONE<br />
727-733-2447<br />
FAX<br />
727-733-3962<br />
E-MAIL<br />
Info@oceanoptics.com<br />
WEB SITE<br />
www.OceanOptics.com<br />
NUMBER OF EMPLOYEES<br />
250<br />
YEAR FOUNDED<br />
1989<br />
Company Description<br />
Ocean Optics invented the world’s first miniature spectrometer<br />
and has delivered over 130,000 of them since its inception<br />
in 1989. The company provides solutions for diverse applications<br />
of optical sensing in medical and biological research,<br />
environmental regulation, science education, production, and<br />
process control. Ocean Optics also provides a comprehensive<br />
range of complementary technologies including chemical sensors,<br />
metrology instrumentation, optical fibers, probes, filters,<br />
coatings, and many more spectroscopic peripherals and accessories.<br />
Our spectrometers and sensors are also ideal for<br />
OEM applications — with modular options that meet virtually<br />
any application requirement.<br />
Chief Spectroscopic Techniques Supported<br />
Absorbance, transmission, reflectance, irradiance, fluorescence,<br />
Raman, UV/VIS/NIR, spectroradiometry, color spectroscopy,<br />
laser-induced breakdown spectroscopy (LIBS), fiber<br />
optic chemical sensing, flow injection analysis, elemental<br />
analysis, endpoint detection, headspace monitoring, laser<br />
characterization, nondestructive testing, multi-spectral<br />
imaging.<br />
Markets Served<br />
Ocean Optics technologies can be found in a diverse range of<br />
industries and disciplines. Our products are used by innovators,<br />
researchers, scientists, OEMs, medical and healthcare<br />
professionals, and in manufacturing facilities in every country<br />
on the planet. Military and security concerns have incorporated<br />
Ocean Optics technologies into their equipment while<br />
Major Products/Services<br />
⦁<br />
⦁<br />
⦁<br />
⦁<br />
⦁<br />
⦁<br />
Spectrometers: UV/VIS/NIR, highresolution,<br />
time-gated fluorescence,<br />
spectrofluorometers, absorbance, laserinduced<br />
breakdown, LED measurement,<br />
reflectance, Raman, remote sensing,<br />
field measurement.<br />
Optical Sensors: Oxygen sensors, pH<br />
sensors, transducing materials.<br />
Software: Spectrometer operating,<br />
device drivers, irradiance, reflective and<br />
emissive color, compound identification.<br />
Sampling Accessories: Collimating<br />
lenses, cuvettes and holders, standards,<br />
filters and holders, flow cells, cosine<br />
correctors, integrating spheres.<br />
Light Sources: Deuterium, tungsten<br />
halogen, LED, excitation sources, lasers.<br />
Optical Fibers and Probes: Premium<br />
grade assemblies, bare fiber, custom<br />
options, reflection and transmission<br />
probes, vacuum feedthroughs,<br />
complete fiber kits.<br />
Facilities<br />
Ocean Optics is headquartered in Dunedin,<br />
Florida and has full-service locations<br />
in Europe as well as China. Ocean Optics<br />
is part of Halma p.l.c., a safety and environmental<br />
technology group in the United<br />
Kingdom.
48 SPECTROSCOPY CORPORATE CAPABILITIES DECEMBER 2009 www.spectroscopyonline.com<br />
PANalytical<br />
steel, nanomaterials, plastics, polymers<br />
and petrochemicals, industrial minerals,<br />
glass, catalysts, semiconductors thin films<br />
and advanced materials, pharmaceutical<br />
solids, recycled materials and environmental<br />
samples.<br />
PANalytical<br />
117 Flanders Road<br />
Westborough, MA 01581<br />
TELEPHONE<br />
(508) 647-1100<br />
FAX<br />
(508) 647-1115<br />
E-MAIL<br />
amec.info@panalytical.com<br />
WEB SITE<br />
www.panalytical.com<br />
NUMBER OF EMPLOYEES<br />
USA: 100<br />
Worldwide: 800<br />
YEAR FOUNDED<br />
1954<br />
Company Description<br />
PANalytical is the world’s leading supplier of analytical instrumentation<br />
and software for X-ray diffraction (XRD) and X-ray<br />
fluorescence spectrometry (XRF), with more than half a century<br />
of experience. The materials characterization equipment<br />
is used for scientific research and development, for industrial<br />
process control applications, and for semiconductor<br />
metrology.<br />
Chief Spectroscopic Techniques Supported<br />
⦁<br />
⦁<br />
X-ray Diffraction: X-ray diffraction is a versatile, nondestructive<br />
technique that reveals detailed information about the<br />
chemical composition and crystallographic structure of<br />
natural and engineered materials.<br />
X-ray Fluorescence Spectrometry: X-ray fluorescence spectrometry<br />
is a nondestructive analytical technique used to<br />
identify and determine the concentrations of elements<br />
present in solid, powdered, and liquid samples. The spectrometer<br />
measures the fluorescent emission produced by a<br />
sample when irradiated with X-rays.<br />
Markets Served<br />
The product portfolio includes a broad range of XRD and XRF<br />
systems and software widely used for the analysis and materials<br />
characterization of products such as cement, metals and<br />
Major Products/Services<br />
The X-ray fluorescence product line offers<br />
a range of WDXRF and EDXRF instrumentation,<br />
from the MinPal4 benchtop systems<br />
to the industry leading Axios family<br />
of WDXRF spectrometers. In 2009, PANalytical<br />
has set the new benchmark in standardless<br />
XRF analysis with the introduction<br />
of Omnian software. The Epsilon5 EDXRF<br />
system offers unparalleled performance<br />
in ultra trace element analysis. All XRF<br />
instrumentation is backed by complete<br />
application solutions including standards<br />
for many industries, and the largest global<br />
network of application support and service<br />
of any analytical X-ray vendor. The Diffraction<br />
product line includes the proven<br />
choice for speed, resolution and true<br />
flexibility, X’Pert PRO MPD with the PIXcel<br />
detector; Alpha-1, the highest resolution<br />
powder diffractometer available; X’Pert<br />
PRO MRD and MRD-XL, diffractometers<br />
specializing in advanced material characterization<br />
such as semiconductor wafers;<br />
and CubiX3, our latest generation of successful<br />
industrial diffractometers, now<br />
the fastest diffractometer with the PIXcel<br />
detector on board.<br />
Facilities<br />
PANalytical’s headquarters are in Almelo,<br />
the Netherlands. Fully equipped application<br />
laboratories are established in Japan,<br />
China, the USA, and the Netherlands.<br />
PANalytical’s research activities are based<br />
in Almelo (NL) and on the campus of the<br />
University of Sussex in Brighton (UK). Supply<br />
and competence centers are located in<br />
Almelo and Eindhoven (NL). A sales and<br />
service network in more than 60 countries<br />
ensures unrivaled levels of customer<br />
support.
50 SPECTROSCOPY CORPORATE CAPABILITIES DECEMBER 2009 www.spectroscopyonline.com<br />
Parker Hannifin Corporation<br />
Filtration and Separation Division<br />
Markets Served<br />
⦁<br />
⦁<br />
⦁<br />
⦁<br />
⦁<br />
⦁<br />
⦁<br />
⦁<br />
⦁<br />
⦁<br />
⦁<br />
⦁<br />
⦁<br />
⦁<br />
Agriculture<br />
Biotechnology<br />
Chemicals<br />
Chemical and explosives detection<br />
Energy<br />
Environmental<br />
Inorganic chemicals<br />
Instrument development<br />
Life science<br />
Organic chemicals<br />
Paints and coatings<br />
Petrochemicals<br />
Pharmaceuticals<br />
Plastics<br />
Parker Hannifin<br />
Corporation<br />
Filtration and Separation<br />
Division<br />
242 Neck Road<br />
Haverhill, MA 01835<br />
TELEPHONE<br />
(978) 858-0505<br />
FAX<br />
(978) 858-0625<br />
WEB SITE<br />
www.labgasgenerators.com<br />
NUMBER OF EMPLOYEES<br />
6,000<br />
YEAR FOUNDED<br />
1924<br />
Company Description<br />
Safety: Parker Balston gas generators completely eliminate<br />
the safety hazards involved with handling high-pressure gas<br />
cylinders. Enjoy hassle-free automation with no tanks to<br />
change and no downtime.<br />
Reliability: Thousands of laboratories worldwide have Parker<br />
Balston gas generators in routine use. Parker Balston gas<br />
generators are recommended and used by major instrument<br />
manufacturers. We offer the best technology at an affordable<br />
price from the brand you trust.<br />
Quality: Each Parker Balston gas generator is manufactured<br />
under a strict total quality management program. We have a<br />
world-class ISO 9001–certified manufacturing facility in the<br />
United States. All Parker Balston gas generators are backed by<br />
a complete satisfaction guarantee.<br />
Products: Hydrogen gas generators produce 99.99999%<br />
pure hydrogen for gas chromatographs. Zero air generators<br />
produce zero grade air for gas chromatographs. UHP nitrogen<br />
generators produce 99.9999% pure nitrogen for GCs or ICP<br />
spectrometers. FTIR gas generators produce dry, CO 2<br />
-free<br />
purge gas for FTIR spectrometers. Pure air and nitrogen generators<br />
produce dry, ultrapure compressed gas for laboratory<br />
instruments, including LC–MS instruments.<br />
Chief Spectroscopic Techniques Supported<br />
⦁<br />
⦁<br />
⦁<br />
⦁<br />
Optical<br />
Atomic<br />
Infrared<br />
Hyphenated Techniques<br />
Major Products/Services<br />
Gas generators for the following analytical<br />
instruments:<br />
⦁<br />
⦁<br />
⦁<br />
⦁<br />
⦁<br />
⦁<br />
⦁<br />
⦁<br />
⦁<br />
Gas chromatographs<br />
LC–MS<br />
FTIR spectrometers<br />
ICP emission spectrometers<br />
TOC analyzers<br />
Atomic absorption spectrophotometers<br />
Nuclear magnetic resonance (NMR)<br />
Rheometers/Thermal analyzers<br />
Sample evaporators/Concentrators<br />
Facilities<br />
Parker Hannifin manufactures all gas<br />
generator products in Haverhill, Massachusetts.<br />
All Parker Balston products are manufactured<br />
in accordance with a strict Total<br />
Quality Management Program, ensuring<br />
top performance and long-term reliability.<br />
Distribution points stretch across the<br />
United States and worldwide, including<br />
Canada, the UK, China, India, Germany,<br />
France, Japan, and Singapore.
www.spectroscopyonline.com<br />
PerkinElmer<br />
DECEMBER 2009 SPECTROSCOPY CORPORATE CAPABILITIES 51<br />
PerkinElmer, Inc.<br />
940 Winter Street<br />
Waltham, MA 02451<br />
TELEPHONE<br />
(781) 663-6900<br />
FAX<br />
(203) 944-4904<br />
E-MAIL<br />
info@perkinelmer.com<br />
WEB SITE<br />
www.perkinelmer.com<br />
NUMBER OF EMPLOYEES<br />
Worldwide: 8500<br />
YEAR FOUNDED<br />
1937<br />
Company Description<br />
PerkinElmer, Inc. is a global leader focused on improving the<br />
health and safety of people and their environment. Engaged<br />
in a proactive fight against illness, including contamination<br />
and other threats to our well-being, PerkinElmer conceives<br />
and delivers scientific solutions to meet society’s ever-changing<br />
needs. Our mission ranges from fostering earlier insights<br />
and more effective therapies to facilitating cleaner water and<br />
safer buildings where we work, learn, and play. For people<br />
and the environment, we take action to create a better<br />
tomorrow.<br />
Chief Chromatographic Techniques Supported<br />
⦁<br />
⦁<br />
⦁<br />
⦁<br />
⦁<br />
⦁<br />
Gas Chromatography (GC)<br />
Gas Chromatography/Mass Spectrometry (GC–MS)<br />
Headspace Sampling (HS)<br />
Thermal Desorption (TD & ATD)<br />
Liquid Chromatography (HPLC & UHPLC)<br />
Chromatography Data Systems (CDS)<br />
Markets Served<br />
PerkinElmer is a leading provider of precision instrumentation,<br />
reagents and chemistries, software, and services for a<br />
wide range of scientific and industrial laboratory applications,<br />
including environmental monitoring, food and beverage quality/safety,<br />
and chemical analysis, as well as genetic screening,<br />
drug discovery, and development.<br />
Major Products/Services<br />
PerkinElmer, Inc. offers a wide breadth<br />
of instrumentation and solutions to meet<br />
your analytical measurement needs:<br />
⦁<br />
⦁<br />
⦁<br />
⦁<br />
⦁<br />
⦁<br />
⦁<br />
⦁<br />
⦁<br />
⦁<br />
⦁<br />
⦁<br />
⦁<br />
Gas Chromatography: Clarus® 600,<br />
500, and 400 GCs<br />
Gas Chromatography/Mass Spectrometry:<br />
Clarus® 600 and 560 GC–MS<br />
GC Sample Handling: TurboMatrix®<br />
Headspace and Thermal Desorption<br />
HPLC and UHPLC: Flexar, FX-15, FX-10<br />
Data handling & LIMS: LABWORKS<br />
LIMS, Chromera® CDS, TotalChrom®<br />
CDS<br />
Atomic <strong>Spectroscopy</strong>: AA, ICP-OES,<br />
ICP-MS<br />
Molecular <strong>Spectroscopy</strong>: FTIR & FTNIR,<br />
Raman <strong>Spectroscopy</strong>, UV/Vis & UV/Vis/<br />
NIR, Fluorescence <strong>Spectroscopy</strong><br />
Thermal Analysis: DSC, TGA, STA, DMA<br />
Hyphenated Techniques: TG-IR, TG-MS,<br />
TG-GC/MS, DSC-Raman<br />
Organic Elemental Analysis: CHN/O,<br />
CHNS/O<br />
Consumables: Chromatography, Atomic<br />
<strong>Spectroscopy</strong>, Molecular <strong>Spectroscopy</strong>,<br />
Thermal Analysis, Elemental Analysis<br />
EcoAnalytix: Application-focused solutions<br />
to help ensure the preservation of<br />
our ecosystem and public health and<br />
safety<br />
Laboratory Services/OneSource®<br />
Facilities<br />
PerkinElmer, Inc. operates globally in 125<br />
countries.
52 SPECTROSCOPY CORPORATE CAPABILITIES DECEMBER 2009 www.spectroscopyonline.com<br />
PHOTONIS USA<br />
PHOTONIS USA<br />
Sturbridge Business Park<br />
660 Main Street<br />
Sturbridge, MA 01566<br />
TELEPHONE<br />
(508) 347-4000<br />
(800) 648-1800<br />
FAX<br />
(508) 347-3849<br />
E-MAIL<br />
sales@usa.photonis.com<br />
WEB SITE<br />
www.photonis.com<br />
NUMBER OF EMPLOYEES<br />
USA: 150<br />
Elsewhere: 900<br />
YEAR FOUNDED<br />
1937<br />
Company Description<br />
PHOTONIS is a leading developer,<br />
manufacturer, and<br />
supplier of Scientific Detector<br />
products and components<br />
for scientific and<br />
analytical instrumentation<br />
systems. We specialize in<br />
ion, electron, and photon<br />
detection with unrivaled<br />
expertise in designing and<br />
delivering standard and<br />
custom products to meet<br />
the most demanding applications.<br />
Our engineering and<br />
manufacturing expertise<br />
delivers solutions for<br />
virtually every detection<br />
application. With the PHO-<br />
TONIS worldwide manufacturing<br />
capability and support network, we can both design<br />
and manufacture your most challenging detection needs.<br />
Chief Spectroscopic Techniques Supported<br />
⦁<br />
⦁<br />
⦁<br />
⦁<br />
⦁<br />
⦁<br />
⦁<br />
⦁<br />
⦁<br />
⦁<br />
⦁<br />
⦁<br />
⦁<br />
Mass Spectrometry<br />
Time of Flight MS<br />
Raman <strong>Spectroscopy</strong><br />
Nuclear <strong>Spectroscopy</strong><br />
UV and X-Ray <strong>Spectroscopy</strong><br />
Charged Particle Imaging<br />
Electron Microscopy<br />
Residual Gas Analysis/Leak Detection<br />
E-Beam/X-Ray Lithography<br />
Luminescence<br />
Fluorescence<br />
Atomic Absorption<br />
Deep UV/X-Ray Optics<br />
Markets Served<br />
PHOTONIS detection products are found in most of today’s<br />
high technology-based markets, including Scientific and<br />
Analytical Instrumentation, Medical Diagnostics, Chemistry,<br />
Scientific Research, Life Sciences, Space and Geophysical Exploration,<br />
Environmental and Process Monitoring, Homeland<br />
Security, Control, and Communications.<br />
Major Products/Services<br />
⦁<br />
Micro Pore Optics<br />
⦁<br />
⦁<br />
⦁<br />
⦁<br />
⦁<br />
⦁<br />
⦁<br />
⦁<br />
⦁<br />
⦁<br />
⦁<br />
⦁<br />
⦁<br />
⦁<br />
⦁<br />
⦁<br />
⦁<br />
⦁<br />
⦁<br />
Channeltron® Electron Multipliers<br />
MAGNUM ® Electron Multipliers<br />
Long-Life Microchannel Plates<br />
Time-of-Flight MCP Detectors<br />
MCP Detector Assemblies<br />
FieldMaster Ion Guides and Drift<br />
Tubes<br />
Glass Capillary Arrays<br />
Resistive Glass Products<br />
Electron Generator Arrays<br />
MCP-based PMTs<br />
Image Intensifier Tubes<br />
Intensified Camera Units<br />
Hybrid Photo Detectors<br />
Streak Tubes<br />
High Voltage Power Supplies<br />
Power Tubes<br />
Neutron and Gamma Detectors<br />
Glass-coated Wire<br />
Flexible Fiber Optics<br />
Facilities<br />
PHOTONIS in Sturbridge, Massachusetts<br />
manufactures Channeltron® Electron<br />
Multipliers, Microchannel Plates, MCP<br />
Detectors, Ion Guides, prototype detectors<br />
and other custom glass products. The Lancaster,<br />
Pennsylvania facility manufactures<br />
Power Tubes and other related products.<br />
PHOTONIS in Roden, Netherlands<br />
manufactures Image Intensifier Tubes,<br />
Intensified Camera Units and Hybrid Photo<br />
Detectors. PHOTONIS in Brive, France<br />
manufactures Image Intensifier Tubes and<br />
related products.
54 SPECTROSCOPY CORPORATE CAPABILITIES DECEMBER 2009 www.spectroscopyonline.com<br />
PIKE Technologies<br />
⦁<br />
⦁<br />
⦁<br />
Integrating Spheres, NIR, and Mid-IR<br />
versions for FTIR spectrometers<br />
Transmission supplies, including IR<br />
optics, and windows of all sizes and<br />
designs<br />
Automation and temperature control<br />
are available for many of our spectroscopy<br />
accessories to speed sampling and<br />
to provide precise thermal analysis<br />
Markets Served<br />
PIKE products are designed for molecular<br />
spectrometers in the petrochemical, food,<br />
forensic, biochemical, pharmaceutical,<br />
semiconductor, agriculture, and material<br />
science industries. In addition, PIKE<br />
specializes in custom design of products<br />
for specific applications. PIKE products are<br />
designed and built with craftsmanship and<br />
care to exceed customer expectations.<br />
PIKE Technologies<br />
6125 Cottonwood Drive<br />
Madison, WI 53719<br />
TELEPHONE<br />
(608) 274-2721<br />
FAX<br />
(608) 274-0103<br />
E-MAIL<br />
sales@piketech.com<br />
WEB SITE<br />
www.piketech.com<br />
NUMBER OF EMPLOYEES<br />
26<br />
YEAR FOUNDED<br />
1989<br />
Company Description<br />
PIKE Technologies was established in the summer of 1989,<br />
specializing in the development and manufacture of accessories<br />
and optical systems that enhance the performance of<br />
commercial spectrometers.<br />
PIKE concentrates on making the life of laboratory personnel<br />
easier. This is achieved through replacing traditional,<br />
tedious sampling routines with a range of innovative products<br />
and techniques.<br />
Chief Spectroscopic Techniques Supported<br />
PIKE Products are designed to work with FTIR and molecular<br />
spectrometers and are based upon the principles of transmission<br />
and reflection spectroscopy measurements. The sampling<br />
techniques offered can be divided into seven major groups:<br />
⦁<br />
⦁<br />
⦁<br />
⦁<br />
Attenuated Total Reflectance (ATR), for analysis of liquids,<br />
pastes, and soft solid materials<br />
Diffuse Reflectance (DRIFTS), used in sampling of powders<br />
and solids<br />
Specular Reflectance, useful in thin film composition and<br />
thickness measurements<br />
Microsampling Products, FTIR microscope and beam<br />
condensers to analyze microsamples<br />
Major Products/Services<br />
⦁<br />
⦁<br />
⦁<br />
⦁<br />
⦁<br />
⦁<br />
MIRacle — Patented “universal” sampling<br />
accessory — Diamond, ZnSe, Ge,<br />
Si, and AMTIR crystals<br />
GladiATR and GladiATR Vision—<br />
Highest performance diamond ATR<br />
VeeMax — Patented variable angle<br />
Specular Reflection and the ATR Max<br />
used for variable depth of penetration<br />
experiments and studies<br />
A wide range of fully automated FTIR<br />
and NIR products with easy to integrate<br />
AutoPRO software<br />
Valu-Line Kits combining the most<br />
often used sampling accessories and<br />
transmission kits containing sampling<br />
holders, cells, and optics<br />
Integrating Spheres for IR and NIR<br />
Facilities<br />
PIKE Technologies is located in Madison,<br />
Wisconsin. We distribute direct to our<br />
customers worldwide and OEM worldwide<br />
for packaging with spectrometers of all<br />
manufacturers. Please call or visit our web<br />
site for additional contact and product<br />
information.
www.spectroscopyonline.com<br />
Smiths Detection Scientific<br />
DECEMBER 2009 SPECTROSCOPY CORPORATE CAPABILITIES 55<br />
Smiths Detection<br />
Scientific<br />
21 Commerce Drive<br />
Danbury, CT 06810<br />
TELEPHONE<br />
(203) 207-9700<br />
FAX<br />
(203) 207-9780<br />
E-MAIL<br />
danbury@smithsdetection.com<br />
WEB SITE<br />
www.smithsdetection.com<br />
NUMBER OF EMPLOYEES<br />
31,000<br />
Company Description<br />
Smiths Detection Scientific simplifies science by developing<br />
rapid, easy-to-use application-focused tools for cleaning<br />
validation, material, research and identification, manufacturing,<br />
industrial hygiene, and quality control.<br />
Increase the speed and reliability of your chemical analysis<br />
with solutions that include:<br />
⦁<br />
⦁<br />
⦁<br />
⦁<br />
IlluminatIR II – FT-IR Accessory for Light Microscopy<br />
IdentifyIR ® – Portable FT-IR Spectrometer<br />
IONSCAN-LS ® – Ion Mobility Spectrometer<br />
FT-IR Accessories & Libraries<br />
Smiths Detection Scientific is part of the global business<br />
Smiths Group, a leading developer and manufacturer of<br />
advanced technology solutions for civil and military markets<br />
worldwide.<br />
Chief Spectroscopic Techniques Supported<br />
⦁<br />
⦁<br />
⦁<br />
⦁<br />
⦁<br />
⦁<br />
⦁<br />
⦁<br />
⦁<br />
⦁<br />
⦁<br />
⦁<br />
Coating characterization<br />
Compound validation<br />
Consistency verification<br />
Containment studies<br />
Contamination analysis<br />
Counterfeit analysis<br />
Crystal characterization<br />
Drug precursor identification<br />
Explosives identification<br />
Failure analysis<br />
Fiber or film recognition<br />
Forensic analysis<br />
⦁<br />
⦁<br />
⦁<br />
⦁<br />
⦁<br />
⦁<br />
⦁<br />
⦁<br />
⦁<br />
⦁<br />
⦁<br />
Illicit drug identification<br />
Laminate characterization<br />
Pharmaceutical research<br />
Process chemistry<br />
Quality control<br />
Reaction monitoring<br />
Research and development<br />
Reverse engineering<br />
Soil identification<br />
White powder identification<br />
WMD identification<br />
Markets Served<br />
Smiths Detection Scientific is solely committed<br />
to providing user-focused solutions<br />
to help improve analytical practices within<br />
highly specific markets, including:<br />
⦁<br />
⦁<br />
⦁<br />
⦁<br />
⦁<br />
⦁<br />
⦁<br />
⦁<br />
Forensic Sciences<br />
Homeland Security<br />
Industrial<br />
Military<br />
Pharmaceutical<br />
Public Health Laboratories<br />
Chemical<br />
Custom<br />
Major Products/Services<br />
⦁<br />
⦁<br />
⦁<br />
⦁<br />
IlluminatIR II – FT-IR Accessory for Light<br />
Microscopy<br />
IdentifyIR – Portable FT-IR Spectrometer<br />
IONSCAN-LS– Ion Mobility Spectrometer<br />
FT-IR Accessories & Libraries<br />
Facilities<br />
Smiths Detection – Danbury is a registered<br />
ISO14001:2004 company dedicated to<br />
customer satisfaction with a commitment<br />
to quality. Our quality platform is built on<br />
our Six Sigma Certification Program and<br />
our Quality Management Data System designed<br />
for consistency and quality in our<br />
products as well as continuous improvement<br />
in our business processes. In addition<br />
Smiths Detection – Danbury offers 21<br />
CFR part 11 compliant solutions, enabling<br />
our customers to meet the needs of<br />
government regulations.
56 SPECTROSCOPY CORPORATE CAPABILITIES DECEMBER 2009 www.spectroscopyonline.com<br />
Shimadzu Scientific Instruments<br />
Shimadzu Scientific<br />
Instruments<br />
7102 Riverwood Drive<br />
Columbia, MD 21046<br />
TELEPHONE<br />
800-477-1227<br />
410-381-1227<br />
FAX<br />
410-381-1222<br />
E-MAIL<br />
webmaster@shimadzu.com<br />
WEB SITE<br />
www.ssi.shimadzu.com<br />
NUMBER OF EMPLOYEES<br />
USA: 335<br />
Worldwide: 9600<br />
YEAR FOUNDED<br />
Shimadzu Scientific<br />
Instruments: 1975<br />
Shimadzu Corporation: 1875<br />
Company Description<br />
Shimadzu Scientific Instruments (SSI) is the North American<br />
subsidiary of Shimadzu Corp., headquartered in Kyoto, Japan.<br />
Founded in 1875, Shimadzu Corporation has a distinguished<br />
history of innovation built on the foundation of contributing<br />
to society through science and technology. SSI was established<br />
in 1975 to provide analytical solutions to a wide range<br />
of laboratories in the Americas. Steady and controlled growth<br />
has seen the opening of ten regional offices across the United<br />
States; a state-of-the-art Customer Training and Education<br />
Center; and, most recently, a Life Sciences Applications<br />
Laboratory in California.<br />
Chief SpectroscopicTechniques Supported<br />
⦁<br />
⦁<br />
⦁<br />
⦁<br />
⦁<br />
⦁<br />
⦁<br />
UV-Vis<br />
FT-IR<br />
Fluorescence<br />
Atomic (AA/ICP)<br />
X-Ray (EDX/XRD/XRF)<br />
GC–MS<br />
LC–MS<br />
Markets Served<br />
Shimadzu offers more spectroscopy instrumentation, with<br />
more software and accessory options, than any other company.<br />
This flexibility enables spectroscopists in virtually any<br />
laboratory, from biotechnology, pharmaceutical, and industrial<br />
to academic, forensic, and environmental, to select the instrument<br />
best suited to their application. Shimadzu provides free<br />
technical support for the life of the instruments and encourages<br />
customer alliances to further product development.<br />
Major Products/Services<br />
UV-VIS: Shimadzu meets your needs for ruggedness, ease of<br />
use, validation and applications with a variety of UV-Vis<br />
spectrophotometers.<br />
⦁<br />
Compact, high-resolution UV-1800<br />
⦁<br />
⦁<br />
⦁<br />
⦁<br />
⦁<br />
⦁<br />
⦁<br />
Easy-to-use UV-Mini<br />
Bioscience-oriented BioSpec-mini<br />
Life science-dedicated BioSpec-nano<br />
Single monochromator UV-2450<br />
Double-blazed, double monochromator<br />
UV-2550<br />
Research-grade UV-3600 UV-VIS-NIR<br />
SolidSpec-3700 UV-VIS-NIR<br />
FT-IR: Our robust, yet stable, FT-IR spectrophotometers<br />
deliver optimum performance,<br />
sensitivity, and reliability at an exceptional<br />
price, and we offer more of the<br />
sampling accessories you need, including<br />
an automated microscope.<br />
FLUORESCENCE: High-performance spectrofluorophotometer<br />
handles a range of<br />
applications from routine analysis to highlevel<br />
R&D.<br />
AA/ICP: High-quality spectrometers<br />
represent the ultimate in technology by<br />
delivering exceptional performance and<br />
maximum value.<br />
X-ray: Our EDX/XRF/XRD systems are<br />
packed with powerful features to provide<br />
users with versatile, easy-to-use solutions.<br />
Facilities<br />
Shimadzu’s U.S. headquarters includes<br />
customer service and technical support, as<br />
well as a customer training and education<br />
center. Ten regional facilities, strategically<br />
located around the U.S., provide customers<br />
with local sales, service, and technical<br />
support.
58 SPECTROSCOPY CORPORATE CAPABILITIES DECEMBER 2009 www.spectroscopyonline.com<br />
Specac, Inc.<br />
Company Description<br />
Specac delivers quality products engineered to meet your needs. Our accessories and systems are<br />
easy to use and built to last. From thin plastic film preparation accessories, used for routine quality<br />
checks, to sophisticated remote sampling systems for reaction monitoring.<br />
Specac is now part of Smiths Group, who acquired Specac Ltd from Graseby in 1997. Specac now<br />
employs around 55 people worldwide, with offices in the U.S. and the U.K., and a network of distributors<br />
and dealers worldwide. Smiths Group is an international company employing 16,000 people in<br />
some 50 different businesses located in the U.K., U.S., and Europe.<br />
Specac does not support chromatographic techniques.<br />
Markets Served<br />
Specac provides accurate and reliable IR and FT-IR sample handling accessories to academic,<br />
industrial, and research institutions worldwide. Specific areas include oil refineries, petrochemicals,<br />
chemical, pharmaceutical, food, observatories, military, and universities.<br />
Specac Limited<br />
River House<br />
97 Cray Avenue<br />
Orpington<br />
Kent<br />
BR5 4HE<br />
TELEPHONE<br />
01689 873134<br />
FAX<br />
01689 878527<br />
Specac, Inc.<br />
50 Sharpe Drive<br />
Cranston, RI 02920<br />
Major Products/Services<br />
Specac’s products fall into 4 areas: IR Sampling Accessories, Sample Preparation, Polarisers, and<br />
Products and Process.<br />
We can provide everything you need, from classic hydraulic presses (up to 40 ton) to handheld<br />
dies for producing smaller samples, a grinding mill or a high-temperature constant thickness film<br />
maker system — whatever type of sample you are preparing, you can be sure of a perfect reading.<br />
Our range of gas cells allows us to offer sampling solutions in a wide variety of pathlengths,<br />
volumes, construction materials, and windows.<br />
Facilities<br />
Specac moved to its current purpose-built location in 1995, based in Orpington, Kent.<br />
There has been a substantial manufacturing investment, and we have a team of optical and<br />
mechanical engineering experts using the latest in 3D CAD systems and optical design software.<br />
TELEPHONE<br />
(401) 854-5281<br />
FAX<br />
(401) 463-6206<br />
E-MAIL<br />
sales@specac.co.uk<br />
WEB SITE<br />
www.specac.com<br />
NUMBER OF EMPLOYEES<br />
USA: 3<br />
UK: 55<br />
YEAR FOUNDED<br />
1971
www.spectroscopyonline.com<br />
DECEMBER 2009 SPECTROSCOPY CORPORATE CAPABILITIES 59<br />
Spellman High-Voltage Electronics<br />
Spellman High-Voltage<br />
Electronics<br />
475 Wireless Blvd.<br />
Hauppauge, NY 11788<br />
TELEPHONE<br />
(631) 630-3000<br />
FAX<br />
(631) 435-1620<br />
E-MAIL<br />
sales@spellmanhv.com<br />
WEB SITE<br />
www.spellmanhv.com<br />
NUMBER OF EMPLOYEES<br />
1000<br />
YEAR FOUNDED<br />
1947<br />
Company Description<br />
When manufacturers around the world require high-precision,<br />
well-regulated power, one name most often comes to mind:<br />
Spellman High Voltage. Over the past 60 years, Spellman<br />
has helped innovative system developers succeed by custom<br />
designing and manufacturing the best high voltage DC power<br />
supplies for their unique requirements.<br />
Spellman’s global direct sales and technical support professionals,<br />
and our specialized sales representatives, focus on<br />
adding value over the long term. They amplify our customers’<br />
voices within Spellman, ensuring that the right people are<br />
aware, the right resources are allocated and the right<br />
response is generated.<br />
You can rely on the world’s largest and most experienced<br />
high voltage engineering staff to design the best solutions for<br />
your system requirements. World-class project teams, experienced<br />
in specific applications and technologies, are dedicated<br />
not only to new designs but also to sustaining engineering<br />
throughout the life of each product.<br />
Markets Served<br />
With the broadest range of products in our market and over<br />
1000 employees located in North America, Europe and Asia,<br />
choosing Spellman makes it possible for many customers to<br />
reduce their vendor base. Our seven integrated manufacturing<br />
facilities permit us to locate production to minimize cost and<br />
support individual customer needs. Low-cost manufacturing<br />
centers in Mexico and China provide high quality products at<br />
competitive prices. Spellman’s purchasing power and global<br />
supply chain alliances with superior vendors enables us to<br />
negotiate competitive pricing, stocking and<br />
delivery programs.<br />
C-TPAT certification reduces international<br />
shipment transit times, as well as<br />
the risk of lengthy delays due to sudden<br />
increases in border security. Lean manufacturing<br />
techniques such as value stream<br />
mapping, focused factories, mixed and<br />
single model cells, and visual control systems<br />
are some of the tools used to reduce<br />
cost and lead time.<br />
In-house expertise in sub-assembly<br />
manufacturing processes - including sheet<br />
metal fabrication, machining, welding and<br />
finishing, high voltage coil winding, printed<br />
circuit board assembly (surface mount and<br />
thru-hole) and encapsulation - increase<br />
control of quality, reduce time-to-market<br />
and permit quick reaction to design or<br />
market changes. Spellman’s quality system<br />
focuses on understanding and providing<br />
what our customers value. Lean and Six<br />
Sigma initiatives empower individuals<br />
and teams to conduct systematic root<br />
cause analyses, and implement effective<br />
corrective prevention measures. In 1994,<br />
Spellman demonstrated its long-standing<br />
commitment to rigorous standards of<br />
quality by becoming the first high voltage<br />
company to achieve ISO 9001 certification.<br />
Major Products/Services<br />
We offer power converters with well regulated<br />
outputs from
60 SPECTROSCOPY CORPORATE CAPABILITIES DECEMBER 2009 www.spectroscopyonline.com<br />
SPEX CertiPrep, Inc<br />
cement facilities, state and federal government<br />
agencies, industrial laboratories,<br />
manufacturing facilities, clinical laboratories,<br />
colleges and universities, public utilities,<br />
oil refiners, nuclear plants, wineries,<br />
wastewater and drinking water labs, and<br />
wastewater treatment plants, etc.<br />
SPEX CertiPrep, Inc.<br />
203 Norcross Ave.<br />
Metuchen, NJ 08840<br />
TELEPHONE<br />
(800) 522-7739<br />
FAX<br />
(732) 603-9647<br />
E-MAIL<br />
CRMsales@spexcsp.com<br />
WEB SITE<br />
www.spexcsp.com<br />
NUMBER OF EMPLOYEES<br />
50<br />
YEAR FOUNDED<br />
1954<br />
Company Description<br />
SPEX CertiPrep is a leading manufacturer of Certified Reference<br />
Materials (CRMs) and calibration standards for analytical<br />
spectroscopy and chromatography. We offer a full range of<br />
organic and inorganic CRMs for ICP, ICP-MS, AA, GC, GC–MS,<br />
and HPLC. We are proud to be accredited by A2LA for both<br />
Organic and Inorganic CRMs under ISO 17025:2005 and ISO<br />
Guide 34-2000. The scope of our accreditation is the most<br />
comprehensive in the industry and encompasses all our<br />
manufactured products. We also offer customers the option<br />
to create their own custom standards with quick turn-around<br />
time at no additional cost.<br />
Chief Spectroscopic Techniques Supported<br />
⦁<br />
⦁<br />
⦁<br />
⦁<br />
⦁<br />
⦁<br />
⦁<br />
⦁<br />
⦁<br />
⦁<br />
ICP<br />
ICP-MS<br />
IC<br />
AA<br />
GC<br />
GC–MS<br />
HPLC<br />
ISE<br />
XRF<br />
XRD<br />
Markets Served<br />
SPEX CertiPrep supplies Certified Reference Materials to the<br />
following markets: research and development laboratories,<br />
environmental laboratories, wastewater treatment facilities,<br />
Major Products/Services<br />
SPEX CertiPrep products include aqueous<br />
and organometallic certified reference<br />
materials for ICP-MS, ICP and AA; organic<br />
standards for GC, GC–MS and HPLC; Ion<br />
Chromatography and Ion Selective Electrode<br />
Standards; Inorganic and Organic<br />
Quality Control; Fusion Fluxes for XRF; and<br />
OdorEroder. Our newest products include<br />
a RoHS/WEEE check standard and various<br />
solid reference materials. Stock items<br />
generally ship within 24–48 hours from<br />
our Metuchen, New Jersey facility. Technical<br />
customer service is available Monday<br />
through Friday 8:00 am – 5:30 pm EST by<br />
phone or Live Chat through our website<br />
at www.spexcsp.com. Look for our newly<br />
designed and updated website coming in<br />
early <strong>2010</strong>!!<br />
Facilities<br />
Our US headquarters is located in<br />
Metuchen, New Jersey. All our products<br />
are manufactured and shipped from this<br />
facility. SPEX CertiPrep, Ltd. is the European<br />
subsidiary of SPEX CertiPrep, Inc. and is<br />
located in Middlesex, England. Distributors<br />
throughout Europe support this branch.
www.spectroscopyonline.com<br />
Thermo Fisher Scientific<br />
DECEMBER 2009 SPECTROSCOPY CORPORATE CAPABILITIES 61<br />
Thermo Fisher Scientific<br />
Instruments<br />
5225 Verona Road<br />
Madison, WI 53711<br />
TELEPHONE<br />
(800) 532-4752<br />
FAX<br />
(608) 273-5046<br />
E-MAIL<br />
analyze@thermofisher.com<br />
WEB SITE<br />
www.thermo.com<br />
Company Description<br />
Thermo Fisher Scientific is the world leader in serving science,<br />
enabling our customers to make the world healthier, cleaner,<br />
and safer. Our goal is to make our customers more productive<br />
and to enable them to solve their analytical challenges,<br />
from routine testing to complex research and discovery. We<br />
offer a wide range of products including analytical instruments,<br />
equipment, reagents and consumables, software, and<br />
services for research, analysis, discovery, and diagnostics. Our<br />
manufacturing sites in the United States and Europe provide<br />
products for customers within pharmaceutical and biotech<br />
companies, hospitals and clinical diagnostic labs, universities,<br />
research institutions, and government and environmental<br />
industries.<br />
Chief Spectroscopic Techniques Supported<br />
⦁<br />
⦁<br />
⦁<br />
⦁<br />
⦁<br />
⦁<br />
⦁<br />
⦁<br />
⦁<br />
⦁<br />
⦁<br />
⦁<br />
AA<br />
ICP<br />
ICP-MS<br />
Combustion Analyzers<br />
FT-IR<br />
FT-NIR<br />
UV-Vis<br />
Raman<br />
EDS/WDS<br />
OES<br />
XRD<br />
XRF<br />
Markets Served<br />
Our growing portfolio of products includes<br />
innovative technologies for a multitude<br />
of markets including mass spectrometry,<br />
elemental analysis, molecular spectroscopy,<br />
sample preparation, informatics, fine<br />
and high-purity chemistry production, cell<br />
culture, RNA interference analysis and immunodiagnostic<br />
testing, as well as air and<br />
water quality monitoring process control.<br />
Major Products/Services<br />
Thermo Scientific spectroscopy instruments<br />
are ideal for investigative analysis<br />
or quality control applications.<br />
<strong>Spectroscopy</strong> systems are used to determine<br />
the molecular or elemental composition<br />
of a wide range of complex samples,<br />
including liquids, solids, and gases. We offer<br />
an expansive range of techniques, such<br />
as FT-IR, FT-NIR, Infrared microsampling,<br />
Raman spectroscopy, AA, ICP, ICP-MS and<br />
ARL OES, XRD and XRF spectrometers.
62 SPECTROSCOPY CORPORATE CAPABILITIES DECEMBER 2009 www.spectroscopyonline.com<br />
WITec GmbH<br />
WITec GmbH<br />
Main Address:<br />
Lise-Meitner-Str. 6, 89081<br />
Ulm, Germany<br />
WITec Instruments Corp.,<br />
200 East Broadway Ave.,<br />
Suite 30, Maryville, TN 37804<br />
TELEPHONE<br />
+49 (0) 731 140 700<br />
USA: (865) 984-4445<br />
FAX<br />
+49 (0) 731 140 7020<br />
USA: (865) 984-4441<br />
E-MAIL<br />
info@witec.de<br />
WEB SITE<br />
www.witec.de<br />
NUMBER OF EMPLOYEES<br />
33<br />
YEAR FOUNDED<br />
1997<br />
Company Description<br />
WITec is a manufacturer of high-resolution optical and scanning<br />
probe microscopy solutions for scientific and industrial<br />
applications. A modular product line allows the combination<br />
of different microscopy techniques such as Raman, NSOM, or<br />
AFM in one instrument. The company’s product line features<br />
a Near-field Scanning Optical Microscope, using unique cantilever<br />
technology, a Confocal Raman Microscope designed<br />
for highest sensitivity and resolution, and an AFM for material<br />
research and nanotechnology. Focusing on innovations and<br />
constantly introducing new technologies, WITec is the leading<br />
expert for a vide variety of optical, structural, and chemical<br />
imaging tasks.<br />
Chief Spectroscopic Techniques Supported<br />
⦁<br />
⦁<br />
⦁<br />
⦁<br />
⦁<br />
Raman <strong>Spectroscopy</strong><br />
Confocal Raman Imaging<br />
Ultrafast Confocal Raman Imaging<br />
Confocal and Near-field Fluorescence <strong>Spectroscopy</strong><br />
Upgradeable with Atomic Force and Near-field Microscopy<br />
<strong>Capabilities</strong><br />
Markets Served<br />
WITec products are delivered worldwide to academic and<br />
industrial research labs focusing on high-resolution chemical<br />
imaging and materials characterization. Areas of application<br />
for WITec’s Confocal Raman Imaging systems include Polymer<br />
Sciences, Pharmaceutics, Life Science, Geoscience, Thin Films<br />
and Coating Analysis, Semiconductors, and Nanotechnology.<br />
Major Products/Services<br />
WITec alpha300 Confocal Raman<br />
Microscope: The alpha300 R is a Raman<br />
imaging systems, focusing on high-resolution<br />
as well as high-speed spectra and<br />
image acquisition. The acquisition time<br />
for a single Raman spectrum is in the<br />
range of one millisecond or even below;<br />
thus, a complete Raman image consisting<br />
of tens of thousands of spectra can be<br />
obtained in one minute or less. Differences<br />
in chemical composition, although<br />
completely invisible in the optical image,<br />
will be apparent in the Raman image and<br />
can be analyzed with a resolution down<br />
to 200 nm.<br />
WITec alpha500 Automated Confocal<br />
Raman & Atomic Force Microscope: The<br />
alpha500 is an automated Confocal Raman<br />
and Atomic Force Microscopy System<br />
incorporating a motorized sample stage<br />
for large samples and customized multiarea/multi-point<br />
measurements. It allows<br />
nondestructive chemical imaging with<br />
Confocal Raman Microscopy as well as<br />
high-resolution topography imaging with<br />
AFM using the integrated piezo scan-stage.<br />
Both modes can be run fully automatically,<br />
guaranteeing the most comprehensive<br />
surface inspection possibilities for systematic<br />
and routine research tasks or highlevel<br />
quality control.<br />
Facilities<br />
WITec Headquarters is located in Ulm,<br />
Germany, and includes the R&D department,<br />
production, sales & marketing, and<br />
administration. WITec Instruments Corp.<br />
in Savoy, Illinois, is responsible for North<br />
American sales activities.
www.spectroscopyonline.com<br />
December 2009 <strong>Spectroscopy</strong> 24(12) 63<br />
The Baseline<br />
Group Theory and Symmetry,<br />
Part I: Symmetry Elements<br />
Group theory is the field of mathematics that includes, among other things, the treatment of<br />
symmetry. Well, it turns out that molecules have symmetry, so group theoretical principles<br />
can be applied to molecules. Because spectroscopy uses light to probe the properties of molecules,<br />
it might not be surprising that group theory has some application to spectroscopy.<br />
Here, we start a multipart discussion of symmetry and group theory.<br />
David W. Ball<br />
Symmetry is one of those things that people recognize<br />
but is hard to define. For example, most people recognize<br />
that a square is more symmetric than a rectangle,<br />
but they would have a difficult time defining why a square is<br />
more symmetric than a rectangle.<br />
For our purposes, symmetry can be defined as a sort of<br />
shape similarity. A square is more symmetric than a rectangle<br />
because all four of its sides are equal, whereas in a<br />
rectangle, only two sides are equal.<br />
However, the mathematical treatment of symmetry has<br />
more to it than that. There are certain specific operations<br />
that can be performed on an object to reorient that object in<br />
space, and if the exact same-looking shape is generated, the<br />
object has symmetry. The more of these sorts of operations<br />
that can be performed to regenerate the exact same shape<br />
in space, the “higher” the symmetry of the object. Here, we<br />
will introduce the different operations that are used to define<br />
the symmetry of an object.<br />
Rotational Symmetry<br />
Consider the square in Figure 1. One of the corners has<br />
been marked by an asterisk. If we rotate the square by<br />
90°, note that the asterisk moves position but the square<br />
remains looking like, well, a square. The resulting square<br />
looks exactly like the initial square. Consider, however, the<br />
rectangle in Figure 1. When it is rotated by 90°, it is still the<br />
same rectangle to be sure, but now it is oriented differently.<br />
It is not the same-looking rectangle in space that we started<br />
with. We say, then, that the square has a rotational axis of<br />
symmetry that the rectangle doesn’t. In this case, the symmetry<br />
axis would be going through the center of the square,<br />
right through the plane of the printed paper. Because we<br />
turned the square by one fourth of a full circle, we say that<br />
the square has a fourfold rotational axis of symmetry. (Axes<br />
of symmetry are named for the number of times an object<br />
has to rotate to return to its original starting position; in this<br />
case, the square would be rotated four times to return to its
64 <strong>Spectroscopy</strong> 24(12) December 2009 www.spectroscopyonline.com<br />
* *<br />
*<br />
starting position.) The rectangle has a<br />
twofold axis of symmetry, because we<br />
can rotate the rectangle by one half of<br />
a circle, 180° and generate a similarlooking<br />
rectangle in the same<br />
orientation.<br />
A rotational axis of symmetry is one<br />
type of symmetry element. The actual<br />
performance of the rotation by the<br />
object is called a symmetry operation.<br />
An object is said to “have a symmetry<br />
element” if the operation performed<br />
by the symmetry element yields a new<br />
shape that is oriented exactly like the<br />
original shape is oriented, even though<br />
the parts of the shape have moved. Rotational<br />
axes of symmetry are labeled<br />
as C n<br />
, with the n standing for the 1/nth<br />
of a circle the object is rotated. Hence,<br />
the square has a C 4<br />
axis of symmetry<br />
going through its center, while the<br />
rectangle does not. The square is said<br />
to have a “fourfold” axis of symmetry,<br />
and the value of four is called the order<br />
of the axis.<br />
An object can have more than one<br />
of the same type of symmetry element.<br />
For instance, coincident with the C 4<br />
axis of the square is also a C 2<br />
axis,<br />
because you can also rotate a square<br />
by one half of a circle and get the same<br />
square back. The C 2<br />
can be thought<br />
of as performing a C 4<br />
-type of rotation<br />
twice, but the C 2<br />
symmetry element<br />
is in fact a unique symmetry element.<br />
90°<br />
Figure 1: A square (top) has a symmetry element that allows it to be rotated by 90° and a similar<br />
square is generated. A rectangle does not; after 90° rotation, the long axis is vertical rather than<br />
horizontal. We say that the square has “higher” symmetry than the rectangle. The symmetry<br />
element is an axis going through center of the square, perpendicular to the page, and is labeled<br />
a C 4<br />
axis.<br />
90°<br />
The square also has some other C 2<br />
axes, as shown in Figure 2. The rectangle<br />
shares some of these axes, but<br />
not others. It is partly because of this<br />
that the square is considered higher<br />
symmetry than the rectangle — it has<br />
more symmetry elements.<br />
Reflection Symmetry<br />
Another type of symmetry element<br />
is the reflection plane, which is symbolized<br />
by the lowercase Greek letter<br />
sigma σ. This symmetry element is<br />
exactly what it sounds like: a plane that<br />
acts as a mirror, reflecting all points<br />
of a shape to the other side of the mirror.<br />
If the exact same shape oriented in<br />
space is produced, the object is said to<br />
have a reflection plane of symmetry.<br />
Figure 3 demonstrates a reflection<br />
plane of symmetry. The pentagon<br />
on top is split by a mirror that goes<br />
through the plane of the page. As is<br />
demonstrated by the indicated point, if<br />
that point is reflected to the other side<br />
of the plane, it falls back on the pentagon<br />
shape. Reflecting all points on the<br />
pentagon will end up reproducing the<br />
original pentagon, so this pentagon<br />
has a reflection plane of symmetry as a<br />
symmetry element. However, the crescent<br />
on the bottom does not have the<br />
indicated plane of symmetry, because<br />
reflecting all points on the crescent<br />
through the plane would not<br />
*<br />
regenerate the original shape. In this<br />
regard, the crescent is acting like your<br />
hands — they are reflections of each<br />
other, but not the same orientation in<br />
space. (You can verify this by putting<br />
your hands on a table palm-down and<br />
trying to superimpose your thumbs<br />
and pinkies — you won’t be able to!)<br />
Note that the plane of the page also<br />
forms a reflection plane of symmetry<br />
for both shapes in Figure 3. Each point<br />
on the shape is reflected on itself.<br />
Reflection planes are classified<br />
by whether or not they contain the<br />
rotational axis of highest order, the<br />
so-called principal axis. If a reflection<br />
plane contains the principal axis, it<br />
is called a vertical plane of symmetry<br />
and given the symbol σ v<br />
. There can be<br />
more than one vertical plane of symmetry<br />
in an object. If the reflection<br />
plane of symmetry is perpendicular<br />
to the principal axis, it is called a<br />
horizontal plane of symmetry and<br />
given the symbol σ h<br />
. If a shape has a<br />
horizontal plane of symmetry, it has<br />
only one; you cannot have more than<br />
one horizontal plane of symmetry in<br />
an object. As it is conventional to orient<br />
an object to put the principal axis<br />
in an up-and-down orientation, these<br />
descriptions of reflection planes make<br />
sense.<br />
Some shapes have vertical planes<br />
that bisect two different C 2<br />
axes. If this<br />
is the case, these vertical planes are<br />
called dihedral planes, and are given<br />
the symbol σ d<br />
. However, dihedral<br />
planes are just another type of vertical<br />
plane.<br />
Identity and Center of Inversion<br />
Likely the most simple symmetry<br />
element is identity, represented by E<br />
(from the German word “einheit”,<br />
meaning unity). Identity is the symmetry<br />
element of existence; all objects<br />
have this symmetry element, even if<br />
they have no other symmetry element.<br />
This begs the question, then: Why is<br />
this symmetry element even necessary?<br />
The answer is that it’s necessary<br />
because of the mathematical requirements<br />
of group theory. Just like the<br />
number zero is an important part of<br />
arithmetic, so is identity important in<br />
group theory and symmetry.
www.spectroscopyonline.com<br />
December 2009 <strong>Spectroscopy</strong> 24(12) 65<br />
180°<br />
180°<br />
180°<br />
i<br />
180°<br />
180°<br />
i<br />
?<br />
?<br />
180°<br />
Figure 2: The square has more C 2<br />
axes of<br />
rotational symmetry than the rectangle does.<br />
Again, the square has a higher symmetry than<br />
the rectangle.<br />
The next symmetry element is the<br />
center of inversion, symbolized by i.<br />
This symmetry operation is a reflection<br />
through a point at the center of<br />
an object in the same direction and at<br />
the same angle. Figure 4 shows a shape<br />
that has a center of inversion and a<br />
shape that does not. As its name implies,<br />
if an object does have a center of<br />
inversion symmetry element, the point<br />
that everything is reflected through is<br />
in the center of the object.<br />
Improper Rotation<br />
The last symmetry element we will<br />
consider is the most unusual. It is<br />
called an improper axis of rotation,<br />
and is denoted S n<br />
. It is a rotation by<br />
1/nth of a circle followed by reflection<br />
through a plane that is perpendicular<br />
to the rotational axis. Figure 5 demonstrates<br />
the improper rotational axis.<br />
The scroll is rotated by 180° about<br />
an axis, and then reflected through a<br />
plane that is perpendicular to that axis.<br />
Note that the original shape in space<br />
is reproduced, so this scroll has an S 2<br />
symmetry element.<br />
Improper axes of rotation can be notoriously<br />
difficult to find or visualize.<br />
Figure 3: Illustration of a reflection plane of<br />
symmetry. The pentagon on top has the given<br />
reflection of symmetry, while the crescent<br />
on the bottom does not. (The crescent does,<br />
however, have a different reflection plane of<br />
symmetry; can you find it?)<br />
Why, then, are they necessary? For the<br />
same reason that identity is defined as<br />
a symmetry element: the mathematical<br />
properties of groups require them.<br />
Point Groups<br />
As it turns out, not every random combination<br />
of symmetry elements exist<br />
for any real object. In fact, only certain<br />
combinations of symmetry elements<br />
are possible for any real three-dimensional<br />
object. These combinations are<br />
called point groups. They are called<br />
this because all of the symmetry elements<br />
of the shape will intersect at (at<br />
least) a point. While technically there<br />
are an infinite number of point groups<br />
(for example, a rotational axis can have<br />
any number as its order), only a few are<br />
scientifically relevant. For example, in<br />
crystallography, it has been demonstrated<br />
that there are only 32 different<br />
ways that a crystal can fill three-dimensional<br />
space (this is known as the<br />
crystallographic restriction theorem<br />
and applies to true crystals, not quasicrystals).<br />
Figure 4: The square has a center of inversion<br />
symmetry element, while the equilateral<br />
triangle does not.<br />
180°<br />
Rotation by ½ of a circle<br />
Reflection through plane<br />
perpendicular to axis<br />
Figure 5: Demonstration of an improper axis<br />
of rotation symmetry element. This scroll has<br />
an S 2<br />
symmetry element.
66 <strong>Spectroscopy</strong> 24(12) December 2009 www.spectroscopyonline.com<br />
v<br />
v<br />
C 2<br />
Figure 6: An object with four, and only four, symmetry elements. This combination of symmetry<br />
elements defines the C 2v<br />
point group.<br />
v<br />
+ E<br />
How does this apply to spectroscopy?<br />
Well, molecules have shapes<br />
too. Consider Figure 7. It is the same<br />
as Figure 6 but has a water molecule<br />
drawn instead of an arch. See how the<br />
water molecule has the same symmetry<br />
elements as the arch does? As such,<br />
it has the same symmetry point group:<br />
C 2v<br />
. Because of this, the water molecule<br />
will have certain properties that<br />
it shares with the arch. For example,<br />
the electrons in the water molecule are<br />
imbalanced in such a way that the molecule<br />
has a dipole moment. If the arch<br />
in Figure 6 were composed of electron<br />
density, it too, would have a dipole<br />
moment. Because the shape of the molecule<br />
is dictated by electronic wavefunctions,<br />
it should come as no surprise<br />
that the wavefunctions will have<br />
C 2v<br />
symmetry as well. <strong>Spectroscopy</strong> is<br />
the interaction of light with wavefunctions,<br />
so symmetry ultimately becomes<br />
very important in spectroscopy. But we<br />
have a ways to go before we can consider<br />
wavefunctions.<br />
In our next installment, we will find<br />
out what a mathematical group is and<br />
how these symmetry elements do indeed<br />
satisfy the definition of a group.<br />
Stay tuned . . .<br />
H<br />
v<br />
OC 2<br />
+ E<br />
H<br />
Figure 7: The water molecule has the same symmetry elements as the arch in Figure 6, so it has<br />
the same symmetry point group and will have similar properties.<br />
David W. Ball is a<br />
professor of chemistry at<br />
Cleveland State University<br />
in Ohio. Many of his<br />
“Baseline” columns have<br />
been reprinted in book<br />
form by SPIE Press as The<br />
Basics of <strong>Spectroscopy</strong>, available through<br />
the SPIE Web Bookstore at www.spie.org.<br />
Another book, Field Guide to <strong>Spectroscopy</strong><br />
(published in May 2006), is available from<br />
SPIE Press. He can be reached at d.ball@<br />
csuohio.edu; his website is<br />
academic.csuohio.edu/ball.<br />
Consider the arch in Figure 6. It<br />
has four, and only four, symmetry<br />
elements, which are superimposed<br />
on the arch: it has the E identity element,<br />
a C 2<br />
axis of rotation, and two<br />
different planes of reflection (one<br />
of which is arbitrarily labeled with<br />
a prime). That’s all, nothing else.<br />
These four symmetry elements constitute<br />
a mathematical group labeled<br />
C 2v<br />
(spoken as “sea-two-vee”). By<br />
virtue of having this point group,<br />
this shape will have certain physical<br />
properties.<br />
For more information on<br />
this topic, please visit:<br />
www.spectroscopymag.com/ball
www.spectroscopyonline.com<br />
December 2009 <strong>Spectroscopy</strong> 24(12) 67<br />
Focus on Quality<br />
Are You Getting Value From Your<br />
Spectrometer?<br />
Getting the best business value from a spectrometer requires knowledge of the instrument<br />
and its operating abilities, any attachments, the sample including sampling procedure and<br />
presentation, and the software. All of these elements must be pulled together by a skilled<br />
and knowledgeable spectroscopist. Unfortunately, this is not always the case in many<br />
organizations.<br />
R.D. McDowall<br />
In a dark, dark cupboard far, far away from the boss’s prying<br />
eyes, somewhere in your laboratory, is usually that<br />
spectrometer you wish you’d never bought. It was purchased<br />
at phenomenal expense and with great promise but it<br />
did not match reality when used operationally. So over time,<br />
alternative analytical procedures have been developed or<br />
you stick with the existing ones that the new instrument was<br />
meant to replace and you push the spectrometer into the<br />
cupboard and hope nobody notices. We’ve all done this at<br />
some time in our careers, mainly because we did not specify<br />
our requirements in sufficient detail or understand exactly<br />
why we were purchasing the system. Provided that we learn<br />
from the experience and don’t repeat it, we know that we<br />
should get better at instrument selection by documenting<br />
our user needs in the first place. Hiding an instrument from<br />
view keeps the management heat from you but does not assuage<br />
your conscience. This is the most obvious case of poor<br />
instrument selection.<br />
However, the purpose of this “Focus on Quality” installment<br />
is to look at what happens after you have purchased<br />
a system and determine the factors you need to get right<br />
to enable the system to deliver what was promised. This is<br />
especially so for molecular spectrometers such as infrared,<br />
near infrared (NIR), and Raman instruments, which offer<br />
the potential for great business benefit but often can fail<br />
to deliver. During laboratory audits that I have conducted<br />
in the past year, I have seen examples where spectrometers<br />
have failed to meet their full expectation and potential.<br />
Therefore, I want to discuss with you some of the main<br />
points that I think need to be considered to get the most out<br />
of your spectrometers and save resources at the same time.<br />
The Promise: Taking the Laboratory to the Sample<br />
Molecular spectroscopy (for example, IR, NIR, and Raman)<br />
is an analytical technique that promises rapid identity<br />
verification or qualitative analysis of most chemicals by<br />
nondestructive testing, often in situ. Furthermore, it also is<br />
capable of quantitative analysis using chemometric models<br />
contained in the instrument software, provided that the<br />
system has been correctly set up. In both modes, it is quicker<br />
than the alternative of destructive testing that occurs in<br />
conventional quality control laboratories where production<br />
needs to wait while the laboratory checks if the material<br />
meets the appropriate specification.<br />
The basis of a spectrometric verification test, often carried<br />
out in a warehouse, is that the supplier of the material<br />
has tested and certified the material against your specification<br />
and all you are doing is identity confirmation. However,
68 <strong>Spectroscopy</strong> 24(12) December 2009 www.spectroscopyonline.com<br />
there is the ability to use spectroscopic<br />
analysis to differentiate chemicals<br />
with the same structure but different<br />
physical properties — for example, differentiating<br />
different particle sizes of<br />
microcrystalline cellulose. However,<br />
to be successful, a library of spectra<br />
needs to be built up and where necessary,<br />
the postspectrum analysis models<br />
need to be established as part of the<br />
overall analytical procedure and then<br />
the overall analytical procedure must<br />
be validated.<br />
If the procedure is set up correctly, it<br />
can save a company a lot of money and<br />
time and avoid errors. For example, if a<br />
system is installed in a goods-inwards<br />
warehouse, as the containers of material<br />
come off the delivery truck, they<br />
can be sampled and tested almost immediately.<br />
If the identity is wrong, the<br />
containers can be loaded back on the<br />
track and returned to the supplier. The<br />
company has not paid for the shipment<br />
and the material has not been<br />
taken through a long and expensive<br />
QC testing process before the error<br />
has been found. Thus, there is an immediate<br />
benefit on company cash flow.<br />
Furthermore, it can enable a just-intime<br />
approach to manufacturing and<br />
hold less stock, further improving its<br />
cash position. As it can differentiate<br />
between polymorphs of the same compound,<br />
it also can be used to detect<br />
counterfeit products or subtle changes<br />
in the manufacturing process of the<br />
compound.<br />
When these spectroscopic techniques<br />
are used for quantitative analysis,<br />
there is the possibility to determine<br />
the purity of a material, either as a<br />
raw material or a finished product as<br />
well as large levels of contaminants or<br />
impurities (down to ~1%). Also, many<br />
users of spectrometers don’t realize<br />
the wider benefits of the technique as<br />
the instrument gathers much data that<br />
are unused: for example, moisture can<br />
be determined simultaneously and<br />
time saved by avoiding a separate Karl<br />
Fischer test. With the rise of counterfeit<br />
goods, molecular spectroscopy<br />
is being used both qualitatively and<br />
quantitatively to analyze suspected<br />
goods and compare with the genuine<br />
article. The ability to achieve analyses<br />
such as these requires that the system<br />
is set up correctly. However, to reach<br />
this spectroscopic nirvana, the laboratory<br />
must overcome some obstacles<br />
that might not always be considered<br />
and hence, the predestined journey to<br />
that dark, dark cupboard.<br />
However, to reach<br />
this spectroscopic<br />
nirvana, the laboratory<br />
must overcome<br />
some obstacles that<br />
might not always<br />
be considered and<br />
hence, the predestined<br />
journey to<br />
that dark, dark<br />
cupboard.<br />
But Often Reality Does Not<br />
Match the Promise<br />
So the theory and promise are great,<br />
but what happens in reality? The workflow<br />
goes something like this after the<br />
selection and purchase of the instrument<br />
(any similarity to your laboratory<br />
is merely coincidental):<br />
• You will have written down your requirements<br />
for the system and have<br />
a good understanding of what analyses<br />
it will be undertaking when operational.<br />
You’ll have compared the<br />
instruments available on the market<br />
with your specification and made<br />
the selection based upon fit to requirements,<br />
ease of use, price versus<br />
budget, and support by the potential<br />
vendor. Why are pigs flying around<br />
my office as I write this section?<br />
• The selected system is delivered by<br />
the vendor to your laboratory.<br />
• In a minority of cases, mainly regulated<br />
laboratories, the system will sit<br />
in the boxes for three to six months<br />
as the spectroscopists do not have<br />
time to validate the system. In the<br />
majority of cases, we will move immediately<br />
onto the next phase of the<br />
process.<br />
• The vendor’s service engineer will<br />
unpack the system, place it in the<br />
location where it will be used, install<br />
the components including the software<br />
and any sampling attachments<br />
purchased, and then integrate them<br />
into a system.<br />
• The service engineer will then test<br />
the system to be confident that it<br />
works from the vendor’s perspective.<br />
There will be varying degrees of formality<br />
at this stage depending if the<br />
laboratory is regulated or not and<br />
how much the company has paid for<br />
this part of the service.<br />
• Finally, the service engineer will<br />
hand the system over to the laboratory<br />
as now it is working from the<br />
vendor’s perspective.<br />
This part of the workflow is shown<br />
in the top half of Figure 1. This is the<br />
easy bit and you are now the proud<br />
owner of a brand spanking new spectrometer<br />
that has been commissioned<br />
by the vendor! So all you have established<br />
at this stage of the process is that<br />
the instrument and the other system<br />
components meet the vendor’s specifications.<br />
However, this does not mean<br />
that your analytical procedures or the<br />
software analysis models used in them<br />
have been established or validated, nor<br />
does it mean they are usable.<br />
So what are you going to do now?<br />
Establish or transfer and validate<br />
existing analytical procedures and<br />
methods using the new system. Alternatively,<br />
you will need to develop<br />
and validate new ones. You will probably<br />
need to configure the software<br />
to do what you want and spend time<br />
building the spectroscopic library if<br />
you want to perform identity tests.<br />
Furthermore, you may need to develop<br />
the chemometric models if you need<br />
to interpret the spectra acquired from<br />
sample analysis if performing quantitative<br />
analysis. Of course, this work<br />
has all been planned in advance and<br />
you have allowed time for all of these<br />
activities? Here’s where the fun starts.<br />
You are now at a crossroads with two<br />
paths ahead of you, one to the left<br />
and the other to the right. Where are
www.spectroscopyonline.com<br />
December 2009 <strong>Spectroscopy</strong> 24(12) 69<br />
Validation delay<br />
for some<br />
regulated<br />
laboratories<br />
No planning to<br />
get the system<br />
operational<br />
Instrument fails<br />
to deliver<br />
promise<br />
Relocate<br />
instrument to<br />
dark cupboard<br />
we going? The signpost for the righthand<br />
path reads “Heaven” and for the<br />
left-hand path it says “Hell.” Reading<br />
the guidebook, we find that Heaven is<br />
the spectroscopic nirvana where the<br />
system provides business benefits and<br />
is used well. Conversely, Hell closely<br />
resembles the dark, dark cupboard in<br />
your laboratory that you use to hide<br />
your mistakes. Are we going to turn<br />
left or right?<br />
Write user<br />
requirements<br />
(DQ) and select<br />
instrument<br />
Order<br />
instrument and<br />
take delivery<br />
Vendor unpacks<br />
and installs<br />
instrument and<br />
components<br />
Vendor<br />
commissioning<br />
and hand over<br />
to user<br />
Figure 1: Process flows for implementation of a spectrometer.<br />
Planning to use<br />
the instrument<br />
Validation of<br />
analytical<br />
procedures and<br />
software models<br />
Effective<br />
operational use<br />
of the system<br />
There are a number of factors that<br />
could influence which path you will<br />
eventually take. Listed below are some<br />
of the major issues to consider along<br />
with a brief description of each. How<br />
many of these will apply to your laboratory<br />
will depend upon how you will<br />
use the system.<br />
• Defined purpose for the spectrometer:<br />
You will have done this by writing<br />
down your requirements used to<br />
select the instrument. However, have<br />
you captured all of the ways you will<br />
use the instrument or just the main<br />
one? Just documenting the user<br />
needs does not ensure that the system<br />
will deliver it. So you will need<br />
to know the operational limits of the<br />
instrument — will you be working<br />
close to any limits?<br />
• Analytical technique and procedure:<br />
The procedure is documented and<br />
has been validated is a given to ensure<br />
that the results are scientifically<br />
sound. However, how are you using<br />
the instrument? Is the method qualitative<br />
or quantitative? Does it use<br />
transmittance or reflectance mode?<br />
• Sampling and the container that will<br />
be used will be either established or<br />
must be investigated as well as the<br />
way the sample is presented to the<br />
instrument.<br />
• The use of any attachments used in<br />
an analysis,such as an autosampler<br />
or a fiber-optic probe, should be understood<br />
• Software, including the development<br />
of any chemometric models used to<br />
analyze or interpret acquired spectra<br />
or reference library generation and<br />
maintenance, will be known and<br />
understood by the developer<br />
Unfortunately, as you failed to plan<br />
for this work, you have just turned<br />
onto the left-hand path. Furthermore,<br />
you have just been joined on your journey<br />
by the devil’s disciple: laboratory<br />
management! The common management<br />
mantra is get the instrument<br />
working, and now (I could say yesterday<br />
but do not want to spoil your day<br />
so early into this column). The rational<br />
is understandable, as there has been<br />
a large investment in purchasing the<br />
system and a return on investment is<br />
required for senior management. However,<br />
the old maxim “failing to plan is<br />
planning to fail” rears its ugly head at<br />
this point, and the spectrometer is on<br />
the downward spiral to that dark, dark<br />
cupboard.<br />
What Do We Need to Achieve the<br />
Promise?<br />
The first thing to remember is that<br />
for many applications, spectrometers<br />
do not simply come with on buttons.
70 <strong>Spectroscopy</strong> 24(12) December 2009 www.spectroscopyonline.com<br />
0.48<br />
0.46<br />
0.44<br />
0.42<br />
0.40<br />
Normal jar<br />
0.38<br />
0.36<br />
Absorbance<br />
0.34<br />
0.32<br />
0.30<br />
0.28<br />
0.26<br />
22-mm vial<br />
0.24<br />
0.22<br />
0.20<br />
0.18<br />
5000 4900 4800 4700 4600 4500 4400 4300 4200 4100 4000<br />
Wavenumber (cm -1 )<br />
Figure 2: NIR analysis of aureomycin showing the influence of the sample container on the spectrum. (C. Burgess, personal communication.)<br />
There is more to using the instrument<br />
and system effectively than<br />
that. The purchase, installation, and<br />
vendor commissioning phases of the<br />
work are relatively straightforward<br />
as we can see from Figure 1. The<br />
problems come when a laboratory<br />
wants to use the system for a specific<br />
analytical procedure that requires<br />
the spectrometer and the software<br />
to do more than just print a spectral<br />
scan. We will consider just a few of<br />
the factors that will influence the<br />
path you will take with your spectrometer.<br />
Of the critical factors needed to<br />
reach the promise offered by spectroscopy,<br />
we will discuss the following<br />
ones:<br />
• Instrument capability: What can<br />
the instrument can do versus the<br />
job you want it to do? Are the two<br />
congruent?<br />
• Software skills: Understanding<br />
what the software can do and its<br />
limitations for your specific analytical<br />
applications and chemometric<br />
models.<br />
• Accessories: Do you know how to<br />
use them and what impact they<br />
have on the resulting spectra?<br />
• Sample presentation: Putting the<br />
sample in a suitable container<br />
before analysis is always critical<br />
to the outcome of any analytical<br />
procedure and then presenting the<br />
sample to the instrument.<br />
If we return to the situation in<br />
which a spectrometer is to be used to<br />
verify the identity of chemicals entering<br />
a warehouse, we will need to<br />
generate a spectral library that will<br />
use the instrument and the software.<br />
The amount of time that you will<br />
need will depend upon the amount<br />
of discrimination you require. For<br />
example, if you want to discriminate<br />
lactose from methylene chloride,<br />
you will only require one or two<br />
sample spectra of each compound.<br />
For materials that are more closely<br />
related then, you will need to use up<br />
to 30 batches from the same supplier<br />
who used the same manufacturing<br />
process for each chemical. The<br />
reason for this is that differences<br />
in the manufacturing process over<br />
time will result in small changes in<br />
spectra. To ensure good discriminatory<br />
power of the instrument, the library<br />
must have sufficient examples.<br />
You can build a library with fewer<br />
samples but you will lose discrimination.<br />
If you decide to go down this<br />
route, consider what could happen if<br />
a mistake were made and the wrong<br />
material accepted.<br />
Taking the library-development<br />
discussion further, if very closely related<br />
material must be discriminated,<br />
then chemometric models, using<br />
partial least squares (PLS), principal<br />
components regression (PCR), or soft<br />
independent modeling of class analogy<br />
(SIMCA) analysis as examples,<br />
must be developed and validated.<br />
These will take correspondingly<br />
more time, and the complex ones<br />
can require 3–9 months before they<br />
are fully developed, validated, and<br />
operational. The problem is that<br />
management needs to be aware of the<br />
time needed to do this and plan<br />
accordingly.
www.spectroscopyonline.com<br />
December 2009 <strong>Spectroscopy</strong> 24(12) 71<br />
Therefore, for qualitative analysis,<br />
the message is: You need to plan for<br />
some or all of the following questions:<br />
• What you will use the library to<br />
identify?<br />
• How many compounds will be entered<br />
in the library?<br />
• How closely related chemically are<br />
the compounds?<br />
• How many batches do you need for<br />
each chemical?<br />
• Do you need to consider chemometric<br />
models?<br />
So far, we have just looked at factors<br />
influencing the library. Another<br />
factor in the mix will be if sample<br />
accessories for the spectrometer are<br />
used in an analytical procedure:<br />
• Autosampler for vials, powders, or<br />
tablets<br />
• Liquid sipper<br />
• Diffuse reflectance module<br />
• Remote fiber-optic probes for either<br />
solids or liquids<br />
Accessory choice can be critical, and<br />
when each is used in an analytical procedure,<br />
it can influence the outcome.<br />
Therefore, accessory choice needs to be<br />
understood. The choice of accessory or<br />
accessories will impart their own effects<br />
on the spectra obtained by the instrument<br />
and therefore, the laboratory<br />
must know which ones will be used<br />
at the beginning of method development<br />
so that the library or model can<br />
be built using them from the start and<br />
avoid repeating work unnecessarily.<br />
Consider also the method: How<br />
robust or accurate does the procedure<br />
have to be as the users of the procedure<br />
might not be spectroscopists or even<br />
analytical scientists? For example,<br />
there is always a balance between accuracy<br />
and robustness of the method.<br />
There can be many reasons for this<br />
but one is based upon the beam size of<br />
the instrument used in the procedure,<br />
which illustrates the need to know<br />
and understand this relationship. If<br />
you want a robust assay then typically<br />
a larger beam size is used, but this is<br />
at the cost of the accuracy of the result.<br />
Conversely if you want accuracy<br />
a smaller beam size can be used but<br />
at the cost of method robustness. In<br />
turn, this decision can result in more<br />
work on developing a library of the<br />
model used in the assay. Does this<br />
matter? Only you can decide based<br />
upon your analytical needs but the<br />
point I am making is that you need to<br />
understand how the instrument and<br />
software operate so that you can make<br />
an informed decision: Know the performance<br />
characteristics and operating<br />
envelope of the instrument you are<br />
using.<br />
How the sample is presented to<br />
the instrument is also important and<br />
is shown in Figure 2. The standard<br />
sample jars used for QC analysis were<br />
suggested for use with a new NIR spectrometer<br />
to be used for sample identification<br />
in a warehouse. When sample<br />
jars were checked, there was a high<br />
background caused by the curvature of<br />
the bottom of the jar, which dispersed<br />
the light beam. This is shown as the<br />
blue line in Figure 2. A 22-mm vial was<br />
better suited to the analysis as the base<br />
of the container was flat and the glass<br />
thinner than the standard jar, resulting<br />
in lower absorbance losses. As can be<br />
Trained user<br />
User<br />
continuum<br />
Figure 3: Diagram of the spectrometer user continuum.<br />
Instrument<br />
capability<br />
Use of<br />
instrument<br />
accessories<br />
Sample<br />
presentation<br />
Figure 4: Skills of an expert spectroscopist.<br />
Software<br />
knowledge<br />
Spectroscopist<br />
(expert user)<br />
Development<br />
of analytical<br />
methods<br />
seen in Figure 2, with the red line, the<br />
resulting spectrum has a lower background<br />
and shows more detail than<br />
using the standard jar. Interestingly,<br />
which container did the laboratory<br />
select for their sample container, the<br />
jar or the vial? Yes, you guessed right,<br />
it was the jar. Not for scientific reasons,<br />
but mainly for cost, as the vials were<br />
more expensive than the vials and<br />
they did not wish to modify existing<br />
working practices. Furthermore, the<br />
compounds in the spectral library<br />
were relatively divergent and therefore,<br />
the spectral detail obtained from using<br />
the vial was not needed. However, if<br />
the spectral library is increased and<br />
closely related compounds needed to<br />
be identified, this changes the whole<br />
approach. The downside of the decision<br />
is that the vial probably will be<br />
needed for high-resolution work and<br />
the library would need to be completely<br />
regenerated and validated. The<br />
message of the sample container saga<br />
is that you must think through your<br />
Chemometric<br />
models<br />
Spectroscopic<br />
knowledge<br />
Validation of<br />
analytical<br />
methods<br />
Expert user
72 <strong>Spectroscopy</strong> 24(12) December 2009 www.spectroscopyonline.com<br />
use of the spectrometer carefully and<br />
to plan ahead as much as possible.<br />
This is not an all-inclusive list of<br />
factors that can influence the use of a<br />
spectrometer. Some of the others are<br />
• Interoperability between instruments<br />
from the same vendor<br />
• Interoperability between instruments<br />
from different vendors<br />
• Interchangeable custom spectral<br />
libraries<br />
• Library maintenance over time<br />
• Use of third-party software<br />
Key to a Successful Solution Is an<br />
Expert User<br />
We have discussed a number of technical<br />
and scientific issues surrounding<br />
the effective deployment of a<br />
spectrometer but we have omitted the<br />
one key factor that will ensure success<br />
by integrating all of these factors<br />
together: an expert user. The decision<br />
of this debate is who is going to drive<br />
the instrument? This, in my view, will<br />
determine if you are going to be successful<br />
or if the dark cupboard will<br />
loom large in your thoughts.<br />
To understand how a spectrometer<br />
can be used effectively, it is important<br />
to understand the continuum of users<br />
of a system, and this is shown simply<br />
in Figure 3. We have on the left-hand<br />
side of the continuum a trained user<br />
or operator who would follow a set of<br />
instructions to perform a method but<br />
perhaps without understanding the<br />
technical issues of the instrument. On<br />
the right-hand side we have the expert<br />
user who understands the technical<br />
issues and can develop and validate<br />
methods for the trained users to perform.<br />
These are the extremes of the<br />
continuum. In the middle of the continuum<br />
there may be users who have<br />
more technical understanding of the<br />
system and others who are analytical<br />
scientists but have had little training<br />
in the instrument other than that<br />
offered by the service engineer augmented<br />
by reading the manuals. So<br />
if you want to develop complex spectroscopic<br />
methods, who will you be<br />
calling (as a clue it will not be Ghostbusters)?<br />
That’s right, the expert user!<br />
It was the lack of these individuals<br />
that caused me to write this column in<br />
the first place when I was auditing two<br />
laboratories.<br />
Let us look in a little more detail<br />
at the skills this group should have<br />
for effective development of spectroscopic<br />
methods. This is shown diagrammatically<br />
in Figure 4.<br />
The issue in a climate of strict cost<br />
control: Do you invest in the skills of<br />
an expert spectroscopist who understands<br />
the theory of the technique,<br />
knows the instrument and its capabilities,<br />
and how to use the accessories<br />
effectively, along with the appropriate<br />
software skills? Or do you use a<br />
generalist user? To get the most from<br />
your instrument and software, you<br />
will need a spectroscopist with some<br />
or all of the skills shown in Figure<br />
4. In the current economic climate,<br />
senior management often does not<br />
understand this and will cut specialists<br />
and aim for generalists, which is<br />
a mistake in my view. Another skill<br />
that is required by the spectroscopist<br />
is management of expectations, as it<br />
is clear from reading this column that<br />
you will not be able to roll out a complex<br />
analytical procedure in 5 min.<br />
Keeping management aware of the<br />
timeframes required is important.<br />
<strong>Spectroscopy</strong> has great potential<br />
to save time and money and the scientists<br />
who can deliver this may not<br />
be retained by an organization. So if<br />
you don’t have this in-house, it could<br />
be outsourced either from a specialist<br />
consultancy or from the instrument<br />
vendor. Regardless of the source<br />
of skill, a laboratory will need this<br />
knowledge and skill if a laboratory is<br />
to realize fully the benefits of investing<br />
in spectroscopic analysis.<br />
Summary<br />
We have looked at some of the factors<br />
necessary for effective and efficient<br />
deployment of spectroscopic methods<br />
of analysis within an organization.<br />
The key element is that an expert<br />
spectroscopist is critical for success.<br />
How you get this expertise (internal<br />
or external available) is up to the<br />
organization. However, specialist<br />
user expertise is the critical success<br />
factor to achieve the promise of spectrometry<br />
and get the most value and<br />
return on investment from your spectrometer.<br />
References<br />
(1) ASTM E 1790–04; Standard Practice<br />
for Near Infrared Qualitative Analysis<br />
(2004).<br />
(2) ASTM E 2056–04; Standard Practice<br />
for Qualifying Spectrometers and<br />
Spectrophotometers for Use in Multivariate<br />
Analyses, Calibrated Using<br />
Surrogate Mixtures (2004).<br />
(3) European Pharmacopeia 5.0, 2005;<br />
Section 2.2.40 Near-Infrared Spectrophotometry.<br />
(4) United States Pharmacopeia XXXII,<br />
2009 General Chapter Near-<br />
Infrared Spectrophotometry<br />
(5) Guidelines for the development and<br />
validation of Near Infrared (NIR) spectroscopic<br />
methods; Pharmaceutical<br />
Analytical Sciences Group (PASG)<br />
October 2001 (http://www.pasg.org.<br />
uk/NIR/NIR.htm).<br />
(6) Note for Guidance on the use of Near<br />
Infrared spectroscopy by the pharmaceutical<br />
industry and the data required<br />
for new submissions and variations;<br />
CPMP/QWP/3309/01, February<br />
2003 (www.emea.europa.eu/pdfs/<br />
human/qwp/330901en.pdf).<br />
R.D. McDowall<br />
is principal of Mc-<br />
Dowall Consulting<br />
and director<br />
of R.D. McDowall<br />
Limited, and “Questions<br />
of Quality” column<br />
editor for<br />
LCGC Europe,<br />
<strong>Spectroscopy</strong>’s sister magazine. Address<br />
correspondence to him at 73 Murray<br />
Avenue, Bromley, Kent, BR1 3DJ, UK.<br />
For more information on<br />
this topic, please visit:<br />
www.spectroscopymag.com/adar
www.spectroscopyonline.com<br />
December 2009 <strong>Spectroscopy</strong> 24(12) 73<br />
Volume 24, 2009<br />
Annual Editorial Index<br />
AUTHORS<br />
A<br />
Adar, Fran. “FT-IR and Raman: A Synergism, Not Competing<br />
Technologies,” in Molecular <strong>Spectroscopy</strong> Workbench.<br />
October, p. 16.<br />
Adar, Fran. “Raman <strong>Spectroscopy</strong> for Biomedical Applications,”<br />
in Molecular <strong>Spectroscopy</strong> Workbench. March, p.<br />
26.<br />
Adar, Fran. “Raman <strong>Spectroscopy</strong> of Carbon — More Information<br />
Than You Would Think,” in Molecular <strong>Spectroscopy</strong><br />
Workbench. February, p. 28.<br />
Adar, Fran; Lee, Eunah; and Whitley, Andrew. Transmission<br />
Raman Offers Improved Quantitation of Pharmaceutical<br />
Solids. Raman Technology for Today’s Spectroscopists, June,<br />
p. 26.<br />
Akao, Ken-ichi. See Larsen, Richard A.<br />
Almeida, Manuel. See Mahar, Maura.<br />
Asa, Darwin. High Performance Mass Spectrometry for<br />
Small Molecule and Protein Applications. Current Trends<br />
in Mass Spectrometry, May, p. 30.<br />
Athanas, Michael. See Sarracino, David.<br />
Bol´shakov, Alexander; Yoo, Jong H.; Liu, Chunyi; and<br />
Russo, Richard. Discrimination of Complex Substances<br />
with Laser-Induced Breakdown <strong>Spectroscopy</strong>. October, p.<br />
36.<br />
Botonjic-Sehic, Edita; Brown, Chris W.; Lamontagne, Marc;<br />
and Tsaparikos, Mary. Forensic Application of Near-Infrared<br />
<strong>Spectroscopy</strong>: Aging of Bloodstains. February, p. 42.<br />
Bowerbank, Christopher R. See Later, Douglas W.<br />
Boyle, Ross. See Lowry, Steve.<br />
Bradley, Mike. See Lowry, Steve.<br />
Briggs, Jenni. See Feustel, Manfred.<br />
Brown, Chris W. See Botonjic-Sehic, Edita.<br />
Brown, Peter. See Mahar, Maura.<br />
B<br />
Ball, David W. “Auger <strong>Spectroscopy</strong>,” in The Baseline. June,<br />
p. 14.<br />
Ball, David W. “Color,” in The Baseline. September, p. 16.<br />
Ball, David W. “Group Theory and Symmetry, Part I: Symmetry<br />
Elements,” in The Baseline. December, p. 63.<br />
Ball, David W. “The Seven Base Units, Part I,” in The Baseline.<br />
January, p. 22.<br />
Ball, David W. “The Seven Base Units, Part II,” in The Baseline.<br />
April, p. 14.<br />
Becker, Christopher; Fernandez-Lima, Francisco A.; and<br />
Russell, David H. Ion Mobility-Mass Spectrometry: A<br />
Tool for Characterizing the Petroleome. April, p. 38.<br />
Bluck, Les, and Volmer, Dietrich A. The Role of Naturally<br />
Occurring Stable Isotopes in Mass Spectrometry, Part II:<br />
The Instrumentation. February, p. 50.<br />
Bluck, Les, and Volmer, Dietrich A. The Role of Naturally<br />
Occurring Stable Isotopes in Mass Spectrometry, Part III:<br />
Small Gas Molecule Calculations. September, p. 34.
74 <strong>Spectroscopy</strong> 24(12) December 2009 www.spectroscopyonline.com<br />
Network. February, p. 58.<br />
Churley, Melissa. See Latiff, Aishah.<br />
Curtis, Matthew. See Sparkman, O.<br />
David.<br />
D<br />
Dalrymple, Dave. See Lowry, Steve.<br />
Davies, Gavin. See Murphy, Terry.<br />
De Lucia Jr., Frank C.; Gottfried, Jennifer<br />
L.; Munson, Chase A.; and<br />
Miziolek, Andrzej. Current Status of<br />
Standoff LIBS Security Applications<br />
at the United States Army Research<br />
Laboratory. June, p. 32.<br />
Dolic, Vesna. See Dulude, Jerry.<br />
Dong, Jing. See Yin, Liangliang.<br />
Downs, Robert T. See Lowry, Steve.<br />
Duchoslav, Eva. See Simons, Brigitte.<br />
Dulude, Jerry, and Dolic, Vesna. Optimizing<br />
Productivity for Environmental<br />
Applications of ICP. Application of<br />
ICP & ICP-MS Techniques for Today’s<br />
Spectroscopist, November, p. 16.<br />
Burrell, Michael C. See Lesaicherre,<br />
Marie.<br />
Busch, Kenneth L. “Development of<br />
Mass Spectrometry in the United<br />
States: The First 50 Years,” in Mass<br />
Spectrometry Forum. March, p. 18.<br />
Busch, Kenneth L. “Higher Resolution<br />
Mass Analysis in Inductively Coupled<br />
Plasma–Mass Spectrometry,” in<br />
Mass Spectrometry Forum. January,<br />
p. 30.<br />
Busch, Kenneth L. “Ion Lenses,” in<br />
Mass Spectrometry Forum. September,<br />
p. 20.<br />
Busch, Kenneth L. A Mass Spectrometry<br />
Glossary. Current Trends in Mass<br />
Spectrometry, October, p. 10.<br />
Busch, Kenneth L. “Pressure and Vacuum:<br />
Not Really Trivial,” in Mass<br />
Spectrometry Forum. November, p.<br />
16.<br />
Busch, Kenneth L. “Sampling in Mass<br />
Spectrometry,” in Mass Spectrometry<br />
Forum. July, p. 14.<br />
C<br />
Cai, Changqun; Chen, Xiaoming; and<br />
Gong, Hang. Interaction of Indigo<br />
Carmine with Nucleic Acids in the<br />
Presence of Cetyltrimethylammonium<br />
Bromide: Spectral Studies<br />
and the Confirmation of Combined<br />
Points. November, p. 34.<br />
Castro-Perez, Jose. See Yu, Kate.<br />
Chakraborty, Asish; Xie, Hongwei;<br />
Skilton, St John; Gebler, John C.;<br />
and Chen, Weibin. Improving the<br />
Analytical Workflow for Protein<br />
Biopharmaceutical Characterization<br />
with a Novel LC–MS System Solution.<br />
Current Trends in Mass Spectrometry,<br />
July, p. 26.<br />
Chamberland, Martin; Farley, Vincent;<br />
Lagueux, Philippe; and Villemaire,<br />
André. Chemical Warfare Agent<br />
Spectral Imaging for Real-Time Identification<br />
and Localization. Homeland<br />
Security, April, p. 20.<br />
Champion, Matthew. See Scott, Greg.<br />
Chen, Shizhong. See Yin, Liangliang.<br />
Chen, Weibin. See Chakraborty, Asish<br />
B.<br />
Chen, Xiaoming. See Cai, Changqun.<br />
Chen, Yougen. See Yu, Kate.<br />
Cheng, Cungui; Xiong, Wei; Tian,<br />
Yumei; and Zhang, Changjiang. A<br />
Novel Recognition of Three Kinds of<br />
Sibling Plants Using FT-IR with Continuous<br />
Wavelet Feature Extraction<br />
Combined with an Artificial Neural<br />
E<br />
Evans, Megan. 57th ASMS Conference<br />
Review. Current Trends in Mass Spectrometry,<br />
July, p. 10.<br />
Evans, Megan. Salary Survey: Salaries<br />
and Stress on the Rise. March, p. 32.<br />
F<br />
Fadgen, Keith. See Stapels, Martha.<br />
Farley, Vincent. See Chamberland,<br />
Martin.<br />
Fernandez-Lima, Francisco A. See<br />
Becker, Christopher.<br />
Feustel, Manfred, and Briggs, Jenni.<br />
Rapid Analysis of Inks on Paper by<br />
Viewing FT-IR–ATR <strong>Spectroscopy</strong>.<br />
FT-IR Technology for Today’s Spectroscopists,<br />
August, p. 16.<br />
Fischer, H. See Schmidt, U.<br />
Fu, Xintong. See Yu, Kate.<br />
G<br />
Gabriele, Peter D. See Reffner, John<br />
A.<br />
Garner, Mark M. See Ghobarah, Hesham.<br />
Gayraud, Nicolas; Kornaszewski, Lukasz;<br />
Stone, James M.; Knight, Jonathan<br />
C.; Reid, Derryck T.; MacPherson,<br />
William N.; and Hand, Duncan<br />
P. Mid-Infrared Gas Sensing Using<br />
a Photonic Bandgap Fiber as a Gas<br />
Cell. January, p. 46.
www.spectroscopyonline.com<br />
December 2009 <strong>Spectroscopy</strong> 24(12) 75<br />
Gebler, John C. See Chakraborty, Asish<br />
B.<br />
Gelsinger-Austin, Paul. “Advantages<br />
of High OD Filters to Microscopy,”<br />
in Laser and Optics Interface. July,<br />
p. 24.<br />
Ghobarah, Hesham; Jones, Elliott B.;<br />
and Garner, Mark M. Metabolite<br />
Profiling Applications in Early Drug<br />
Discovery. Current Trends in Mass<br />
Spectrometry, October, p. 44.<br />
Ghosh, Dipankar. See Kellman,<br />
Markus.<br />
Gong, Hang. See Cai, Changqun.<br />
Gottfried, Jennifer L. See De Lucia Jr.,<br />
Frank C.<br />
Guo, Hongzhu. See Yu, Kate.<br />
H<br />
Hahn, David W. Laser-Induced Breakdown<br />
<strong>Spectroscopy</strong> for Analysis of<br />
Aerosol Particles: The Path Toward<br />
Quantitative Analysis. September, p.<br />
26.<br />
Hail, M. See Scott, G.<br />
Hamester, Meike; McSheehy, Shona;<br />
and Rodushkin, Ilia. Magnet or Cell?<br />
A Comparison of High-Resolution<br />
Sector Field ICP-MS and Collision–<br />
Reaction Cell Quadrupole ICP-MS.<br />
Current Trends in Mass Spectrometry,<br />
October, p. 26.<br />
Hand, Duncan P. See Gayraud, Nicolas.<br />
Hanold, Karl A. See Syage, Jack A.<br />
Heim, John, and Pugh, Scott. Nonderivatized<br />
Drug-Screen Analysis in<br />
Urine with Automated Solid Phase<br />
Microextraction and Comprehensive<br />
Two-Dimensional GC–TOF-MS.<br />
Current Trends in Mass Spectrometry,<br />
March, p. 26.<br />
Hobbs, Steve. See Neyer, David.<br />
Hodkiewicz, Joe and Wall, Mark.<br />
Raman <strong>Spectroscopy</strong> as a Rapid<br />
Characterization Tool for Heterogeneous<br />
Solids. Raman Technology for<br />
Today’s Spectroscopists, June, p. 18.<br />
Hollricher, O. See Schmidt, U.<br />
Huhmer, Andreas. Successfully Identifying<br />
Proteins and Their Modifications<br />
Using Electron Transfer Dissociation<br />
Linear Ion Trap Mass Spectrometry.<br />
Current Trends in Mass Spectrometry,<br />
March, p. 22.<br />
I<br />
Ibach, W. See Schmidt, U.<br />
Impey, Gary. See Simons, Brigitte.<br />
J<br />
Jasinevicius, Renata. See Lowry,<br />
Steve.<br />
Jones, Elliott B. See Ghobarah, Hesham.<br />
Jones, Patrick R. See Sparkman, O.<br />
David.<br />
K<br />
Kansal, Monika. See Sanchez, A.<br />
Carl.<br />
Kellman, Markus; Wieghaus, Andreas;<br />
Muenster, Helmut; Taylor, Lester;<br />
and Ghosh, Dipankar. Using High-<br />
Resolution LC–MS to Analyze Complex<br />
Sample. Current Trends in Mass<br />
Spectrometry, May, p. 38.<br />
Knight, Jonathan C. See Gayraud,<br />
Nicolas.<br />
Kornaszewski, Lukasz. See Gayraud,<br />
Nicolas.<br />
Koshoubu, Jun. See Larsen, Richard<br />
A.<br />
Krastins, Bryan. See Sarracino,<br />
David.<br />
L<br />
Lagueux, Philippe. See Chamberland,<br />
Martin.<br />
Lamontagne, Marc. See Botonjic-Sehic,<br />
Edita.<br />
Larsen, Richard A.; Akao, Ken-ichi;<br />
Sugiyama, Hiroshi; and Koshoubu,<br />
Jun. Advanced Infrared Imaging for<br />
Sample Analysis. FT-IR Technology<br />
for Today’s Spectroscopists, August,<br />
p. 42.<br />
Later, Douglas W.; Wirth, Tiffany C.;<br />
Bowerbank, Christopher R.; Lee,<br />
Edgar D.; and Sadowski, Charles S.<br />
Rapid Field Detection of Chemical<br />
Warfare Agents and Toxic Industrial<br />
Chemicals Using a Hand-Portable<br />
GC–TMS System. Homeland Security,<br />
April, p. 6.<br />
Latiff, Aishah, and Churley, Melissa.<br />
The Role of Triple Quadrupole<br />
GC–MS in Steroid Analysis. Current<br />
Trends in Mass Spectrometry, May, p.<br />
33.<br />
Leary, Pauline E. See Reffner, John A.<br />
Lee, Edgar D. See Later, Douglas W.<br />
Lee, Eunah. See Adar, Fran.<br />
Leroy, Emmanuel. See Whitley, Andrew.<br />
Lesaicherre, Marie; Paxon, Tracy L.;<br />
Burrell, Michael C.; Sunderland,<br />
William Scott; Linsebigler, Amy;<br />
and Mondello, Frank J. Dual-Use<br />
Raman <strong>Spectroscopy</strong> for Chemical<br />
and Biological Agent Identification.<br />
Raman Technology for Today’s Spectroscopists,<br />
June, p. 6.<br />
Lin, Dayin. See Miller, Christine.<br />
Linsebigler, Amy. See Lesaicherre,<br />
Marie.<br />
Liu, Chunyi. See Bol´shakov, Alexander.<br />
Lopez, Mary F. See Sarracino, David.<br />
Lowry, Steve; Boyle, Ross; and Bradley,<br />
Mike. Analysis of Solar Silicon Using<br />
High-Throughput <strong>Spectroscopy</strong>.
76 <strong>Spectroscopy</strong> 24(12) December 2009 www.spectroscopyonline.com<br />
FT-IR Technology for Today’s Spectroscopists,<br />
August, p. 28.<br />
Lowry, Steve; Wieboldt, Dick; Dalrymple,<br />
Dave; Jasinevicius, Renata;<br />
and Downs, Robert T. The Use of a<br />
Raman Spectral Database of Minerals<br />
for the Rapid Verification of Semiprecious<br />
Gemstones. May, p. 52.<br />
M<br />
Macho, Jorge. Low-Resolution Raman<br />
<strong>Spectroscopy</strong>, the Photonic Engine<br />
Behind Materials Identification’s<br />
Promising Future. Raman Technology<br />
for Today’s Spectroscopists, June,<br />
p. 46.<br />
MacPherson, William N. See Gayraud,<br />
Nicolas.<br />
Magarini, Riccardo. ICP-MS Determination<br />
of Micro and Macro Elements<br />
in Waters. Application of ICP & ICP-<br />
MS Techniques for Today’s Spectroscopist,<br />
November, p. 45.<br />
Mahar, Maura; Almeida, Manuel; and<br />
Brown, Peter. Determination of<br />
Toxic Elements Leached from Toys<br />
and Household Structures by Inductively<br />
Coupled Plasma–Optical Emission<br />
<strong>Spectroscopy</strong>. Application of ICP<br />
& ICP-MS Techniques for Today’s<br />
Spectroscopist, November, p. 24.<br />
Mark, Howard. Pittcon New Product<br />
Review. May, p. 22.<br />
Mark, Howard, and Workman Jr.,<br />
Jerome. “The Long, Complicated,<br />
Tedious, and Difficult Route to<br />
Principal Components: Coda,” in<br />
Chemometrics in <strong>Spectroscopy</strong>. May,<br />
p. 14.<br />
Mark, Howard, and Workman Jr.,<br />
Jerome. “The Long, Complicated,<br />
Tedious and Difficult Route to Principal<br />
Components: Part VI,” in Chemometrics<br />
in <strong>Spectroscopy</strong>. February,<br />
p. 16.<br />
McCurdy, Ed. Comparing Collision–<br />
Reaction Cell Modes for the Measurement<br />
of Interfered Analytes in<br />
Complex Matrices. Current Trends in<br />
Mass Spectrometry, October, p. 30.<br />
McDowall, R.D. “Are You Getting Value<br />
from Your Spectrometer?” in Focus<br />
on Quality. December, p. 67.<br />
McDowall, R.D. “The Tiger Has Sharp<br />
New Teeth,” in Focus on Quality. November,<br />
p. 23.<br />
McDowall, R.D. “Understanding and<br />
Interpreting the New GAMP 5 Software<br />
Categories,” in Focus on Quality.<br />
June, p. 22.<br />
McDowall, R.D. “USP on Analytical<br />
Instrument Qualification and<br />
the Laboratory Impact,” in Focus on<br />
Quality. April, p. 20.<br />
McGinley, M. See Scott, G.<br />
McGinley, Michael. See Scott, Greg.<br />
McSheehy, Shona. Using GC–ICP-MS<br />
for Speciation of Sulfur in Reformulated<br />
Fuels. Application of ICP & ICP-<br />
MS Techniques for Today’s Spectroscopist,<br />
November, p. 40.<br />
McSheehy, Shona. See Hamester,<br />
Meike.<br />
McSheehy, Shona, and Sperling, Michael.<br />
“Hyphenated ICP-MS Techniques<br />
for Speciation Analysis,” in<br />
Atomic Perspectives. March, p. 14.<br />
Menard, Kevin P., and Spragg, Richard.<br />
Combining Raman <strong>Spectroscopy</strong> and<br />
Differential Scanning Calorimetry.<br />
Raman Technology for Today’s Spectroscopists,<br />
June, p. 39.<br />
Miller, Christine, and Lin, Dayin.<br />
Microfluidic Chip-Based Technology<br />
as a Growing Trend in LC–MS<br />
Analysis. Current Trends in Mass<br />
Spectrometry, March, p. 8.<br />
Miziolek, Andrzej. See De Lucia Jr.,<br />
Frank C.<br />
Mondello, Frank J. See Lesaicherre,<br />
Marie.<br />
Morris, Rob. “How Will Distributed<br />
Sensing Inspire Changes in Optical-<br />
Sensing R&D?” in Laser and Optics<br />
Interface. January, p. 40.<br />
Muenster, Helmut. See Kellman,<br />
Markus.<br />
Munson, Chase A. See De Lucia Jr.,<br />
Frank C.<br />
Murphy, Brian. See Yu, Kate.<br />
Murphy, Terry; Roberts, Gareth; and<br />
Davies, Gavin. Chemical Warfare<br />
Agents and Use of Thermal Desorption–GC–MS<br />
to Achieve Improved<br />
Trace-Level Detection. Homeland<br />
Security, April, p. 29.<br />
N<br />
Neubauer, Kenneth. “Advantages and<br />
Disadvantages of Different Column<br />
Types for Speciation Analysis by<br />
LC–ICP-MS,” in Atomic Perspectives.<br />
November, p. 30.<br />
Neufeld, Lawrence. Cone Care and<br />
Maintenance. Application of ICP &<br />
ICP-MS Techniques for Today’s Spectroscopist,<br />
November, p. 32.<br />
Newbury, Dale E. The Revolution in<br />
Energy Dispersive X-Ray Spectrometry:<br />
Spectrum Imaging at Output<br />
Count Rates Above 1 MHz with the<br />
Silicon Drift Detector on a Scanning<br />
Electron Microscope. July, p. 32.<br />
Neyer, David, and Hobbs, Steve. Application<br />
of Microbore UHPLC–MS-<br />
MS to the Quantitation of In Vivo<br />
Pharmacokinetic Study Samples.<br />
Current Trends in Mass Spectrometry,<br />
July, p. 40.<br />
Nielsen, Claus Hélix. See Petersen,<br />
Frederic N. R.<br />
P<br />
Paxon, Tracy L. See Lesaicherre,<br />
Marie.<br />
Petersen, Frederic N.R.; and Nielsen,<br />
Claus Hélix. Raman <strong>Spectroscopy</strong> as<br />
a Tool for Investigating Lipid–Protein<br />
Interactions. October, p. 26.<br />
Prakash, Amol. See Sarracino, David.<br />
Pugh, Scott. See Heim, John.<br />
R<br />
Reffner, John A.; Gabriele, Peter D.;<br />
and Leary, Pauline E. Detection<br />
and Sourcing of Counterfeit Pharmaceutical<br />
Products and Consumer<br />
Goods. FT-IR Technology for Today’s<br />
Spectroscopists, August, p. 10.<br />
Reid, Derryck T. See Gayraud, Nicolas.<br />
Rivera, B. See Scott, G.
www.spectroscopyonline.com<br />
December 2009 <strong>Spectroscopy</strong> 24(12) 77<br />
Roberts, Gareth. See Murphy, Terry.<br />
Rodushkin, Ilia. See Hamester,<br />
Meike.<br />
Russell, David H. See Becker, Christopher.<br />
Russo, Richard. See Bol´shakov,<br />
Alexander.<br />
S<br />
Sadowski, Charles S. See Later,<br />
Douglas W.<br />
Sanchez, A. Carl, and Kansal, Monika.<br />
Structured Approach to Method Development<br />
for Bioanalytical HILIC–<br />
MS-MS Applications. Current Trends<br />
in Mass Spectrometry, May, p. 44.<br />
Sarracino, David; Krastins, Bryan;<br />
Prakash, Amol; Lopez, Mary F.;<br />
Wong, Waichi; Zorn, Emmanuel;<br />
and Athanas, Michael. Quantitative<br />
Proteomic Workflow for Discovery<br />
of Early Rejection Kidney Transplant<br />
Peptide Biomarkers and Subsequent<br />
Development of SRM Assays in<br />
Urine. Current Trends in Mass Spectrometry,<br />
July, p. 34.<br />
Schmid, Lawrence S. <strong>Spectroscopy</strong>:<br />
Enduring During Uncertain Times.<br />
March, p. 38.<br />
Schmidt, U.; Ibach, W.; Fischer, H.; and<br />
Hollricher, O. Analysis of Multicomponent<br />
Polymer Blends with Confocal<br />
Raman Imaging and Atomic<br />
Force Microscopy. Raman Technology<br />
for Today’s Spectroscopists, June,<br />
p. 32.<br />
Schreiber, André, and von Czaplewski,<br />
Kristin. Recent Trends in the Use of<br />
LC–MS-MS for the Testing of Food<br />
and Environmental Contaminants.<br />
Current Trends in Mass Spectrometry,<br />
March, p. 16.<br />
Scott, G.; Hail, M.; Rivera, B.; and Mc-<br />
Ginley, M. ADME/Pharmacokinetic<br />
Studies from Serum and Plasma: Improvements<br />
in Sample Preparation<br />
and LC–MS Analysis of Therapeutic<br />
Oligonucleotides. Current Trends in<br />
Mass Spectrometry, July, p. 44.<br />
Scott, Greg; Champion, Matthew;<br />
and McGinley, Michael. Improving<br />
Oligonucleotide Sensitivity and<br />
Separation for LC–MS Applications.<br />
Current Trends in Mass Spectrometry,<br />
March, p. 30.<br />
Shockcor, John. See Yu, Kate.<br />
Simons, Brigitte; Impey, Gary; and<br />
Duchoslav, Eva. Accelerated Discovery<br />
and Quantitation of Lipids in<br />
Complex Extracts. Current Trends in<br />
Mass Spectrometry, May, p. 12.<br />
Skilton, St John. See Chakraborty,<br />
Asish B.<br />
Sparkman, O. David; Jones, Patrick R.;<br />
and Curtis, Matthew. Anatomy of an<br />
Ion’s Fragmentation After Electron<br />
Ionization, Part I. Current Trends in<br />
Mass Spectrometry, May, p. 18.<br />
Sparkman, O. David; Jones, Patrick R.;<br />
and Curtis, Matthew. Anatomy of an<br />
Ion’s Fragmentation After Electron<br />
Ionization, Part II. Current Trends in<br />
Mass Spectrometry, July, p. 12.<br />
Sperling, Michael. See McSheehy,<br />
Shona.<br />
Spragg, Richard. See Menard, Kevin<br />
P.<br />
Stapels, Martha, and Fadgen, Keith.<br />
A Reproducible Online 2D Reversed<br />
Phase–Reversed Phase High–Low pH<br />
Method for Qualitative and Quantitative<br />
Proteomics. Current Trends in<br />
Mass Spectrometry, March, p. 14.<br />
Stone, James M. See Gay raud,<br />
Nicolas.<br />
Sugiyama, Hiroshi. See Larsen, Richard<br />
A.<br />
Sunderland, William Scott. See Lesaicherre,<br />
Marie.<br />
Sword, Duane. Portable FT-IR and<br />
Raman <strong>Spectroscopy</strong> for Explosives<br />
Identification. Homeland Security,<br />
April, p. 16.<br />
Syage, Jack A., and Hanold, Karl A.<br />
Combating Terrorism with Mass<br />
Spectrometry — Screening People for<br />
Explosives. Current Trends in Mass<br />
Spectrometry, July, p. 26.<br />
T<br />
Taday, Philip F. “Terahertz Pulsed Imaging<br />
for Nondestructive Testing of<br />
Pharmaceutical Products,” in Lasers<br />
and Optics Interface. April, p. 28.<br />
Takeuchi, Seiji. Polarization Measurement<br />
of Film Using Single-Reflection<br />
FT-IR–ATR. FT-IR Technology<br />
for Today’s Spectroscopists, August,<br />
p. 22.<br />
Taylor, Lester. See Kellman, Markus.<br />
Thompson, Laura. “Software Features
78 <strong>Spectroscopy</strong> 24(12) December 2009 www.spectroscopyonline.com<br />
Jose; Fu, Xintong; Chen, Yougen;<br />
Guo, Hongzhu; Shockcor, John; and<br />
Murphy, Brian. Using LC–oa-TOF<br />
MS E with a Multivariate Statistical<br />
Sample Profiling Strategy to Distinguish<br />
Chinese Red Ginseng from Korean<br />
Red Ginseng. Current Trends in<br />
Mass Spectrometry, October, p. 36.<br />
Yuki, Hashi. See Yin, Liangliang.<br />
Z<br />
Zhang, Changjiang. See Cheng, Cungui.<br />
Zorn, Emmanuel. See Sarracino,<br />
David.<br />
SUBJECTS<br />
to Improve Quality Control and Data<br />
Validation in the Inorganic Laboratory,”<br />
in Atomic Perspectives. July,<br />
p. 20.<br />
Tian, Yumei. See Cheng, Cungui.<br />
Tsaparikos, Mary. See Botonjic-Sehic,<br />
Edita.<br />
V<br />
Villemaire, André. See Chamberland,<br />
Martin.<br />
Volmer, Dietrich A. See Bluck, Les.<br />
von Czaplewski, Kristin. See Schreiber,<br />
André.<br />
W<br />
Wall, Mark. See Hodkiewicz, Joe.<br />
Weng, Chao; Chen, Xiaoming; and<br />
Cai, Changqun. Spectral Studies on<br />
the Interaction of [Ru(bpy) 2<br />
(BTIP)] 2+<br />
with DNA and Determination of<br />
Nucleic Acids at Nanogram Levels.<br />
June, p. 39.<br />
Whitley, Andrew; Leroy, Emmanuel;<br />
and Adar, Fran. FT-IR–Raman<br />
Combination: The Perfect Analytical<br />
Solution for Vibrational Spectroscopists.<br />
FT-IR Technology for Today’s<br />
Spectroscopists, August, p. 35.<br />
Whitley, Andrew. See Adar, Fran.<br />
Wieboldt, Dick. See Lowry, Steve.<br />
Wieghaus, Andreas. See Kellman,<br />
Markus.<br />
Wilbur, Steven M. Factors Determining<br />
Sensitivity in ICP-MS. Application of<br />
ICP & ICP-MS Techniques for Today’s<br />
Spectroscopist, November, p. 10.<br />
Wilbur, Steven. “Universal Quantification<br />
— The Uncelebrated Strength<br />
of ICP-MS,” in Atomic Perspectives.<br />
May, p. 16.<br />
Wirth, Tiffany C. See Later, Douglas<br />
W.<br />
Wong, Waichi. See Sarracino, David.<br />
Workman Jr., Jerome. See Mark, Howard.<br />
Workman Jr., Jerome, and Mark, Howard.<br />
“Statistics and Chemometrics<br />
for Clinical Data Reporting, Part I,”<br />
in Chemometrics in <strong>Spectroscopy</strong>.<br />
June, p. 18.<br />
Workman Jr., Jerome, and Mark, Howard.<br />
“Statistics and Chemometrics<br />
for Clinical Data Reporting, Part II:<br />
Using Excel for Computations,” in<br />
Chemometrics in <strong>Spectroscopy</strong>. October,<br />
p. 20.<br />
X<br />
Xie, Hongwei. See Chakraborty, Asish<br />
B.<br />
Xin, Mintong. See Yu, Kate.<br />
Xiong, Wei. See Cheng, Cungui.<br />
Y<br />
Yin, Liangliang; Dong, Jing; Yuki,<br />
Hashi; and Chen, Shizhong. Online<br />
Identification of Flavones from Flos<br />
Chrysanthemi by LC–MS-IT-TOF.<br />
Current Trends in Mass Spectrometry,<br />
October, p. 22.<br />
Yoo, Jong H. See Bol´shakov, Alexander.<br />
Yu, Kate; Xin, Mintong; Castro-Perez,<br />
ATOMIC PERSPECTIVES COLUMN<br />
“Advantages and Disadvantages of Different<br />
Column Types for Speciation<br />
Analysis by LC–ICP-MS,” in Atomic<br />
Perspectives. Kenneth Neubauer. November,<br />
p. 30.<br />
“Hyphenated ICP-MS Techniques for<br />
Speciation Analysis,” in Atomic Perspectives.<br />
Shona McSheehy and Michael<br />
Sperling. March, p. 14.<br />
“Software Features to Improve Quality<br />
Control and Data Validation in the<br />
Inorganic Laboratory,” in Atomic<br />
Perspectives. Laura Thompson. July,<br />
p. 20.<br />
“Universal Quantification — The Uncelebrated<br />
Strength of ICP-MS,” in<br />
Atomic Perspectives. Steven Wilbur.<br />
May, p. 16.<br />
ATOMIC SPECTROSCOPY<br />
“Advantages and Disadvantages of Different<br />
Column Types for Speciation<br />
Analysis by LC–ICP-MS,” in Atomic<br />
Perspectives. Kenneth Neubauer. November,<br />
p. 30.<br />
“Higher Resolution Mass Analysis in<br />
Inductively Coupled Plasma–Mass<br />
Spectrometry,” in Mass Spectrometry<br />
Forum. Kenneth L. Busch. January,<br />
p. 30.<br />
“Hyphenated ICP-MS Techniques for<br />
Speciation Analysis,” in Atomic Perspectives.<br />
Shona McSheehy and Michael<br />
Sperling. March, p. 14.<br />
“Software Features to Improve Quality<br />
Control and Data Validation in the<br />
Inorganic Laboratory,” in Atomic<br />
Perspectives. Laura Thompson. July,
www.spectroscopyonline.com<br />
December 2009 <strong>Spectroscopy</strong> 24(12) 79<br />
p. 20.<br />
“Universal Quantification — The Uncelebrated<br />
Strength of ICP-MS,” in<br />
Atomic Perspectives. Steven Wilbur.<br />
May, p. 16.<br />
BASELINE COLUMN<br />
“Auger <strong>Spectroscopy</strong>,” in The Baseline.<br />
David W. Ball. June, p. 14.<br />
“Color,” in The Baseline. David W. Ball.<br />
September, p. 16.<br />
“Group Theory and Symmetry, Part I:<br />
Symmetry Elements,” in The Baseline.<br />
David Ball. December, p. 63.<br />
“The Seven Base Units, Part I,” in The<br />
Baseline. David W. Ball. January, p.<br />
22.<br />
“The Seven Base Units, Part II,” in The<br />
Baseline. David W. Ball. April, p. 14.<br />
BIOLOGICAL AND MEDICAL<br />
ANALYSIS<br />
Interaction of Indigo Carmine with<br />
Nucleic Acids in the Presence of Cetyltrimethylammonium<br />
Bromide:<br />
Spectral Studies and the Confirmation<br />
of Combined Points. Changqun<br />
Cai, Xiaoming Chen, and Hang Gong.<br />
November, p. 34.<br />
“Raman <strong>Spectroscopy</strong> for Biomedical<br />
Applications,” in Molecular <strong>Spectroscopy</strong><br />
Workbench. Fran Adar. March,<br />
p. 26.<br />
Raman <strong>Spectroscopy</strong> as a Tool for Investigating<br />
Lipid–Protein Interactions.<br />
Frederic N.R. Petersen and Claus<br />
Hélix Nielsen. October, p. 26.<br />
Spectral Studies on the Interaction of<br />
[Ru(bpy) 2<br />
(BTIP)] 2+ with DNA and<br />
Determination of Nucleic Acids<br />
at Nanogram Levels. Chao Weng,<br />
Xiaoming Chen, and Changqun Cai.<br />
June, p. 39.<br />
CHEMOMETRICS IN<br />
SPECTROSCOPY COLUMN<br />
“The Long, Complicated, Tedious, and<br />
Difficult Route to Principal Components:<br />
Coda,” in Chemometrics<br />
in <strong>Spectroscopy</strong>. Howard Mark and<br />
Jerome Workman Jr. May, p. 14.<br />
“The Long, Complicated, Tedious and<br />
Difficult Route to Principal Components:<br />
Part VI,” in Chemometrics in<br />
<strong>Spectroscopy</strong>. Howard Mark and Jerome<br />
Workman Jr. February, p. 16.<br />
“Statistics and Chemometrics for<br />
Clinical Data Reporting, Part I,”<br />
in Chemometrics in <strong>Spectroscopy</strong>.<br />
Jerome Workman Jr. and Howard<br />
Mark. June, p. 18.<br />
“Statistics and Chemometrics for Clinical<br />
Data Reporting, Part II: Using Excel<br />
for Computations,” in Chemometrics<br />
in <strong>Spectroscopy</strong>. Jerome Workman Jr.<br />
and Howard Mark. October, p. 20.<br />
FIBER OPTICS<br />
Mid-Infrared Gas Sensing Using a Photonic<br />
Bandgap Fiber as a Gas Cell.<br />
Nicolas Gayraud, Lukasz Kornaszewski,<br />
James M. Stone, Jonathan C.<br />
Knight, Derryck T. Reid, William N.<br />
MacPherson, and Duncan P. Hand.<br />
January, p. 46.<br />
FOCUS ON QUALITY COLUMN<br />
“Are You Getting Value from Your<br />
Spectrometer?” in Focus on Quality.<br />
R.D. McDowall. December, p. 67.<br />
“The Tiger Has Sharp New Teeth,” in<br />
Focus on Quality. R.D. McDowall.<br />
November, p. 23.<br />
“Understanding and Interpreting the<br />
New GAMP 5 Software Categories,”<br />
in Focus on Quality. R.D. McDowall.<br />
June, p. 22.<br />
“USP on Analytical Instrument<br />
Qualification and the Laboratory<br />
Impact,” in Focus on Quality. R.D.<br />
McDowall. April, p. 20.<br />
FORENSIC APPLICATIONS<br />
Forensic Application of Near-Infrared<br />
<strong>Spectroscopy</strong>: Aging of Bloodstains.<br />
Edita Botonjic-Sehic, Chris W. Brown,<br />
Marc Lamontagne, and Mary Tsaparikos.<br />
February, p. 42.<br />
FT-IR SPECTROSCOPY<br />
“FT-IR and Raman: A Synergism, Not<br />
Competing Technologies,” in Molecular<br />
<strong>Spectroscopy</strong> Workbench. Fran<br />
Adar. October, p. 16.<br />
A Novel Recognition of Three Kinds of<br />
Sibling Plants Using FT-IR with Continuous<br />
Wavelet Feature Extraction<br />
Combined with an Artificial Neural<br />
Network. Cungui Cheng, Wei Xiong,<br />
Yumei Tian, and Changjiang Zhang.<br />
February, p. 58.<br />
FUELS<br />
Ion Mobility-Mass Spectrometry: A Tool<br />
for Characterizing the Petroleome.<br />
Christopher Becker, Francisco A.<br />
Fernandez-Lima, and David H. Russell.<br />
April, p. 38.<br />
ICP AND ICP-MS<br />
“Advantages and Disadvantages of Different<br />
Column Types for Speciation<br />
Analysis by LC–ICP-MS,” in Atomic<br />
Perspectives. Kenneth Neubauer. November,<br />
p. 30.<br />
“Higher Resolution Mass Analysis in<br />
Inductively Coupled Plasma–Mass<br />
Spectrometry,” in Mass Spectrometry<br />
Forum. Kenneth L. Busch. January,<br />
p. 30.<br />
“Hyphenated ICP-MS Techniques for<br />
Speciation Analysis,” in Atomic Perspectives.<br />
Shona McSheehy and Michael<br />
Sperling. March, p. 14.<br />
“Universal Quantification — The Uncelebrated<br />
Strength of ICP-MS,” in<br />
Atomic Perspectives. Steven Wilbur.<br />
May, p. 16.<br />
INFRARED SPECTROSCOPY<br />
Mid-Infrared Gas Sensing Using a Photonic<br />
Bandgap Fiber as a Gas Cell.<br />
Nicolas Gayraud, Lukasz Kornaszewski,<br />
James M. Stone, Jonathan C.<br />
Knight, Derryck T. Reid, William N.<br />
MacPherson, and Duncan P. Hand.<br />
January, p. 46.<br />
LASERS AND OPTICS INTERFACE<br />
COLUMN<br />
“Advantages of High OD Filters to Microscopy,”<br />
in Laser and Optics Interface.<br />
Paul Gelsinger-Austin. July,<br />
p. 24.<br />
“How Will Distributed Sensing Inspire<br />
Changes in Optical-Sensing R&D?”<br />
in Laser and Optics Interface. Rob<br />
Morris. January, p. 40.<br />
“Terahertz Pulsed Imaging for Nondestructive<br />
Testing of Pharmaceutical<br />
Products,” in Lasers and Optics Interface.<br />
Philip F. Taday. April, p. 28.<br />
LASERS<br />
Current Status of Standoff LIBS Security<br />
Applications at the United States<br />
Army Research Laboratory. Frank<br />
C. De Lucia Jr., Jennifer L. Gottfried,<br />
Chase A. Munson, and Andrzej<br />
Miziolek. June, p. 32.<br />
Discrimination of Complex Substances
80 <strong>Spectroscopy</strong> 24(12) December 2009 www.spectroscopyonline.com<br />
with Laser-Induced Breakdown <strong>Spectroscopy</strong>.<br />
Alexander Bol´shakov, Jong<br />
H. Yoo, Chunyi Liu, and Richard<br />
Russo. October, p. 36.<br />
“How Will Distributed Sensing Inspire<br />
Changes in Optical-Sensing R&D?”<br />
in Laser and Optics Interface. Rob<br />
Morris. January, p. 40.<br />
Laser-Induced Breakdown <strong>Spectroscopy</strong><br />
for Analysis of Aerosol Particles: The<br />
Path Toward Quantitative Analysis.<br />
David W. Hahn. September, p. 26.<br />
“Terahertz Pulsed Imaging for Nondestructive<br />
Testing of Pharmaceutical<br />
Products,” in Lasers and Optics Interface.<br />
Philip F. Taday. April, p. 28.<br />
MARKET PROFILE<br />
<strong>Spectroscopy</strong>: Enduring During Uncertain<br />
Times. Lawrence S. Schmid.<br />
March, p. 38.<br />
MASS SPECTROMETRY FORUM<br />
COLUMN<br />
“Development of Mass Spectrometry<br />
in the United States: The First<br />
50 Years,” in Mass Spectrometry<br />
Forum. Kenneth L. Busch. March,<br />
p. 18.<br />
“Higher Resolution Mass Analysis in<br />
Inductively Coupled Plasma–Mass<br />
Spectrometry,” in Mass Spectrometry<br />
Forum. Kenneth L. Busch. January,<br />
p. 30.<br />
“Ion Lenses,” in Mass Spectrometry<br />
Forum. Kenneth L. Busch. September,<br />
p. 20.<br />
“Pressure and Vacuum: Not Really Trivial,”<br />
in Mass Spectrometry Forum.<br />
Kenneth L. Busch. November, p. 16.<br />
“Sampling in Mass Spectrometry,” in<br />
Mass Spectrometry Forum. Kenneth<br />
L. Busch. July, p. 14.<br />
MASS SPECTROMETRY<br />
“Development of Mass Spectrometry<br />
in the United States: The First<br />
50 Years,” in Mass Spectrometry<br />
Forum. Kenneth L. Busch. March,<br />
p. 18.<br />
“Higher Resolution Mass Analysis in<br />
Inductively Coupled Plasma–Mass<br />
Spectrometry,” in Mass Spectrometry<br />
Forum. Kenneth L. Busch. January,<br />
p. 30.<br />
“Ion Lenses,” in Mass Spectrometry<br />
Forum. Kenneth L. Busch.<br />
September, p. 20.<br />
Ion Mobility-Mass Spectrometry: A<br />
Tool for Characterizing the Petroleome.<br />
Christopher Becker, Francisco<br />
A. Fernandez-Lima, and David<br />
H. Russell. April, p. 38.<br />
“Pressure and Vacuum: Not Really<br />
Trivial,” in Mass Spectrometry<br />
Forum. Kenneth L. Busch. November,<br />
p. 16.<br />
The Role of Naturally Occurring Stable<br />
Isotopes in Mass Spectrometry, Part<br />
II: The Instrumentation. Les Bluck<br />
and Dietrich A. Volmer. February,<br />
p. 50.<br />
The Role of Naturally Occurring Stable<br />
Isotopes in Mass Spectrometry,<br />
Part III: Small Gas Molecule Calculations.<br />
Les Bluck and Dietrich A.<br />
Volmer. September, p. 34.<br />
“Sampling in Mass Spectrometry,” in<br />
Mass Spectrometry Forum. Kenneth<br />
L. Busch. July, p. 14.<br />
“Universal Quantification — The Uncelebrated<br />
Strength of ICP-MS,” in<br />
Atomic Perspectives. Steven Wilbur.<br />
May, p. 16.<br />
MOLECULAR SPECTROSCOPY<br />
WORKBENCH COLUMN<br />
“FT-IR and Raman: A Synergism, Not<br />
Competing Technologies,” in Molecular<br />
<strong>Spectroscopy</strong> Workbench.<br />
Fran Adar. October, p. 16.<br />
“Raman <strong>Spectroscopy</strong> for Biomedical<br />
Applications,” in Molecular <strong>Spectroscopy</strong><br />
Workbench. Fran Adar. March,<br />
p. 26.<br />
“Raman <strong>Spectroscopy</strong> of Carbon —<br />
More Information Than You Would<br />
Think,” in Molecular <strong>Spectroscopy</strong><br />
Workbench. Fran Adar. February,<br />
p. 28.<br />
NEAR-IR SPECTROSCOPY<br />
Forensic Application of Near-Infrared<br />
<strong>Spectroscopy</strong>: Aging of Bloodstains.<br />
Edita Botonjic-Sehic, Chris<br />
W. Brown, Marc Lamontagne, and<br />
Mary Tsaparikos. February, p. 42.<br />
NMR SPECTROSCOPY<br />
Interaction of Indigo Carmine with<br />
Nucleic Acids in the Presence of<br />
Cetyltrimethylammonium Bromide:<br />
Spectral Studies and the Confirmation<br />
of Combined Points. Changqun<br />
Cai, Xiaoming Chen, and Hang<br />
Gong. November, p. 34.<br />
OPTICS<br />
“Advantages of High OD Filters to Microscopy,”<br />
in Laser and Optics Interface.<br />
Paul Gelsinger-Austin. July,<br />
p. 24.<br />
“Group Theory and Symmetry, Part I:<br />
Symmetry Elements,” in The Baseline.<br />
David Ball. December, p. 63.<br />
PHARMACEUTICAL<br />
APPLICATIONS<br />
“Are You Getting Value from Your<br />
Spectrometer?” in Focus on Quality.<br />
R.D. McDowall. December, p. 67.<br />
“Terahertz Pulsed Imaging for<br />
Nondestructive Testing of Pharmaceutical<br />
Products,” in Lasers and<br />
Optics Interface. Philip F. Taday.<br />
April, p. 28.<br />
“The Tiger Has Sharp New Teeth,” in<br />
Focus on Quality. R.D. McDowall.<br />
November, p. 23.<br />
“USP on Analytical Instrument<br />
Qualification and the Laboratory<br />
Impact,” in Focus on Quality. R.D.<br />
McDowall. April, p. 20.<br />
PRODUCT REVIEW<br />
Pittcon 2009 New Product Review.<br />
Howard Mark. May, p. 22.
www.spectroscopyonline.com<br />
December 2009 <strong>Spectroscopy</strong> 24(12) 81<br />
RAMAN SPECTROSCOPY<br />
“FT-IR and Raman: A Synergism, Not<br />
Competing Technologies,” in Molecular<br />
<strong>Spectroscopy</strong> Workbench.<br />
Fran Adar. October, p. 16.<br />
“Raman <strong>Spectroscopy</strong> for Biomedical<br />
Applications,” in Molecular <strong>Spectroscopy</strong><br />
Workbench. Fran Adar.<br />
March, p. 26.<br />
“Raman <strong>Spectroscopy</strong> of Carbon —<br />
More Information Than You Would<br />
Think,” in Molecular <strong>Spectroscopy</strong><br />
Workbench. Fran Adar. February,<br />
p. 28.<br />
Raman <strong>Spectroscopy</strong> as a Tool for Investigating<br />
Lipid–Protein Interactions.<br />
Frederic N.R. Petersen and Claus<br />
Hélix Nielsen. October, p. 26.<br />
The Use of a Raman Spectral Database<br />
of Minerals for the Rapid Verification<br />
of Semiprecious Gemstones.<br />
Steve Lowry, Dick Wieboldt, Dave<br />
Dalrymple, Renata Jasinevicius, and<br />
Robert T. Downs. May, p. 52.<br />
REGULATORY ISSUES<br />
“Are You Getting Value from Your Spectrometer?”<br />
in Focus on Quality. R.D.<br />
McDowall. December, p. 67.<br />
“The Tiger Has Sharp New Teeth,” in<br />
Focus on Quality. R.D. McDowall.<br />
November, p. 23.<br />
“Understanding and Interpreting the<br />
New GAMP 5 Software Categories,”<br />
in Focus on Quality. R.D. McDowall.<br />
June, p. 22.<br />
“USP on Analytical Instrument<br />
Qualification and the Laboratory<br />
Impact,” in Focus on Quality. R.D.<br />
McDowall. April, p. 20.<br />
SALARY SURVEY<br />
2009 Salary Survey: Salaries and Stress<br />
on the Rise. Megan Evans. March,<br />
p. 32.<br />
SPECTRAL INTERPRETATION<br />
Spectral Studies on the Interaction of<br />
[Ru(bpy) 2<br />
(BTIP)] 2+ with DNA and<br />
Determination of Nucleic Acids<br />
at Nanogram Levels. Chao Weng,<br />
Xiaoming Chen, and Changqun Cai.<br />
June, p. 39.<br />
The Use of a Raman Spectral Database<br />
of Minerals for the Rapid Verification<br />
of Semiprecious Gemstones.<br />
Steve Lowry, Dick Wieboldt, Dave<br />
Dalrymple, Renata Jasinevicius, and<br />
Robert T. Downs. May, p. 52.<br />
SUPPLEMENT: APPLICATION OF<br />
ICP & ICP-MS TECHNIQUES FOR<br />
TODAY’S SPECTROSCOPIST<br />
Cone Care and Maintenance. Lawrence<br />
Neufeld. November, p. 32.<br />
Determination of Toxic Elements<br />
Leached from Toys and Household<br />
Structures by Inductively Coupled<br />
Plasma–Optical Emission <strong>Spectroscopy</strong>.<br />
Maura Mahar, Manuel<br />
Almeida, and Peter Brown. November,<br />
p. 24.<br />
Factors Determining Sensitivity in ICP-<br />
MS. Steven M. Wilbur. November, p.<br />
10.<br />
ICP-MS Determination of Micro and<br />
Macro Elements in Waters. Riccardo<br />
Magarini. November, p. 45.<br />
Optimizing Productivity for Environmental<br />
Applications of ICP. Jerry<br />
Dulude and Vesna Dolic. November,<br />
p. 16.<br />
Using GC–ICP-MS for Speciation of<br />
Sulfur in Reformulated Fuels. Shona<br />
McSheehy. November, p. 40.<br />
SUPPLEMENT: CURRENT TRENDS<br />
IN MASS SPECTROMETRY<br />
57th ASMS Conference Review. Megan<br />
Evans. July, p. 10.<br />
Accelerated Discovery and Quantitation<br />
of Lipids in Complex Extracts.<br />
Brigitte Simons, Gary Impey, and<br />
Eva Duchoslav. May, p. 12.<br />
ADME/Pharmacokinetic Studies from<br />
Serum and Plasma: Improvements<br />
in Sample Preparation and LC–MS<br />
Analysis of Therapeutic Oligonucleotides.<br />
G. Scott, M. Hail, B. Rivera,<br />
and M. McGinley. July, p. 44.<br />
Anatomy of an Ion’s Fragmentation<br />
After Electron Ionization, Part I. O.<br />
David Sparkman, Patrick R. Jones,<br />
and Matthew Curtis. May, p. 18.<br />
Anatomy of an Ion’s Fragmentation<br />
After Electron Ionization, Part II. O.<br />
David Sparkman, Patrick R. Jones,<br />
and Matthew Curtis. July, p. 12.<br />
Application of Microbore UHPLC–MS-<br />
MS to the Quantitation of In Vivo<br />
Pharmacokinetic Study Samples.<br />
David Neyer and Steve Hobbs. July,<br />
p. 40.<br />
Combating Terrorism with Mass Spectrometry<br />
— Screening People for<br />
Explosives. Jack A. Syage and Karl<br />
A. Hanold. July, p. 26.<br />
Comparing Collision–Reaction Cell<br />
Modes for the Measurement of Interfered<br />
Analytes in Complex Matrices.<br />
Ed McCurdy. October, p. 30.<br />
High Performance Mass Spectrometry<br />
for Small Molecule and Protein Applications.<br />
Darwin Asa. May, p. 30.<br />
Improving the Analytical Workflow for<br />
Protein Biopharmaceutical Characterization<br />
with a Novel LC–MS System<br />
Solution. Asish Chakraborty,<br />
Hongwei Xie, St John Skilton, John<br />
C. Gebler, and Weibin Chen. July,<br />
p. 26.<br />
Improving Oligonucleotide Sensitivity<br />
and Separation for LC–MS Applications.<br />
Greg Scott, Matthew<br />
Champion, and Michael McGinley.<br />
March, p. 30.<br />
Magnet or Cell? A Comparison of<br />
High-Resolution Sector Field ICP-<br />
MS and Collision–Reaction Cell<br />
Quadrupole ICP-MS. Meike Hamester,<br />
Shona McSheehy, and Ilia Rodushkin.<br />
October, p. 26.<br />
A Mass Spectrometry Glossary.<br />
Kenneth L. Busch. October, p. 10.<br />
Metabolite Profiling Applications in<br />
Early Drug Discovery. Hesham Ghobarah,<br />
Elliott B. Jones, and Mark M.
82 <strong>Spectroscopy</strong> 24(12) December 2009 www.spectroscopyonline.com<br />
Garner. October, p. 44.<br />
Microfluidic Chip-Based Technology as<br />
a Growing Trend in LC–MS Analysis.<br />
Christine Miller and Dayin Lin.<br />
March, p 8.<br />
Nonderivatized Drug-Screen Analysis<br />
in Urine with Automated Solid<br />
Phase Microextraction and Comprehensive<br />
Two-Dimensional GC–TOF-<br />
MS. John Heim and Scott Pugh.<br />
March, p. 26.<br />
Online Identification of Flavones from<br />
Flos Chrysanthemi by LC–MS-IT-<br />
TOF. Liangliang Yin, Jing Dong,<br />
Hashi Yuki, and Shizhong Chen.<br />
October, p. 22.<br />
Quantitative Proteomic Workflow for<br />
Discovery of Early Rejection Kidney<br />
Transplant Peptide Biomarkers and<br />
Subsequent Development of SRM<br />
Assays in Urine. David Sarracino,<br />
Bryan Krastins, Amol Prakash,<br />
Mary F. Lopez, Waichi Wong, Emmanuel<br />
Zorn, and Michael Athanas.<br />
July, p. 34.<br />
Recent Trends in the Use of LC–MS-MS<br />
for the Testing of Food and Environmental<br />
Contaminants. André Schreiber<br />
and Kristin von Czaplewski.<br />
March, p. 16.<br />
A Reproducible Online 2D Reversed<br />
Phase–Reversed Phase High–Low<br />
pH Method for Qualitative and<br />
Quantitative Proteomics. Martha<br />
Stapels and Keith Fadgen. March,<br />
p. 14.<br />
The Role of Triple Quadrupole GC–MS<br />
in Steroid Analysis. Aishah Latiff<br />
and Melissa Churley. May, p. 33.<br />
Structured Approach to Method Development<br />
for Bioanalytical HILIC–<br />
MS-MS Applications. A. Carl Sanchez<br />
and Monika Kansal. May, p.<br />
44.<br />
Successfully Identifying Proteins and<br />
Their Modifications Using Electron<br />
Transfer Dissociation Linear Ion<br />
Trap Mass Spectrometry. Andreas<br />
Huhmer. March, p. 22.<br />
Using High-Resolution LC–MS to<br />
Analyze Complex Sample. Markus<br />
Kel lman, Andreas Wieghaus,<br />
Helmut Muenster, Lester Taylor, and<br />
Dipankar Ghosh. May, p. 38.<br />
Using LC–oa-TOF MS E with a Multivariate<br />
Statistical Sample Profiling<br />
Strategy to Distinguish Chinese Red<br />
Ginseng from Korean Red Ginseng.<br />
Kate Yu, Mintong Xin, Jose Castro-<br />
Perez, Xintong Fu, Yougen Chen,<br />
Hongzhu Guo, John Shockcor, and<br />
Brian Murphy. October, p. 36.<br />
SUPPLEMENT: FT-IR<br />
TECHNOLOGY FOR TODAY’S<br />
SPECTROSCOPISTS<br />
Advanced Infrared Imaging for Sample<br />
Analysis. Richard A. Larsen, Kenichi<br />
Akao, Hiroshi Sugiyama, and<br />
Jun Koshoubu. August, p. 42.<br />
Analysis of Solar Silicon Using High-<br />
Throughput <strong>Spectroscopy</strong>. Steve<br />
Lowry, Ross Boyle, and Mike Bradley.<br />
August, p. 28.<br />
Detection and Sourcing of Counterfeit<br />
Pharmaceutical Products and Consumer<br />
Goods. John A. Reffner, Peter<br />
D. Gabriele, and Pauline E. Leary.<br />
August, p. 10.<br />
FT-IR–Raman Combination: The<br />
Perfect Analytical Solution for Vibrational<br />
Spectroscopists. Andrew<br />
Whitley, Emmanuel Leroy, and Fran<br />
Adar. August, p. 35.<br />
Polarization Measurement of Film<br />
Using Single-Reflection FT-IR–ATR.<br />
Seiji Takeuchi. August, p. 22.<br />
Rapid Analysis of Inks on Paper by<br />
Viewing FT-IR–ATR <strong>Spectroscopy</strong>.<br />
Manfred Feustel and Jenni Briggs.<br />
August, p. 16.<br />
SUPPLEMENT: HOMELAND<br />
SECURITY<br />
Chemical Warfare Agent Spectral Imaging<br />
for Real-Time Identification and<br />
Localization. Martin Chamberland,<br />
Vincent Farley, Philippe Lagueux,<br />
and André Villemaire. April, p. 20.<br />
Chemical Warfare Agents and Use of<br />
Thermal Desorption–GC–MS to<br />
Achieve Improved Trace-Level Detection.<br />
Terry Murphy, Gareth Roberts,<br />
and Gavin Davies. April, p. 29.<br />
Portable FT-IR and Raman <strong>Spectroscopy</strong><br />
for Explosives Identification. Duane<br />
Sword. April, p. 16.<br />
Rapid Field Detection of Chemical<br />
Warfare Agents and Toxic Industrial<br />
Chemicals Using a Hand-Portable<br />
GC–TMS System. Douglas W.<br />
Later, Tiffany C. Wirth, Christopher<br />
R. Bowerbank, Edgar D. Lee, and<br />
Charles S. Sadowski. April, p. 6.<br />
SUPPLEMENT: RAMAN<br />
TECHNOLOGY FOR TODAY’S<br />
SPECTROSCOPISTS<br />
Analysis of Multicomponent Polymer<br />
Blends with Confocal Raman Imaging<br />
and Atomic Force Microscopy. U.<br />
Schmidt, W. Ibach, H. Fischer, and O.<br />
Hollricher. June, p. 32.<br />
Combining Raman <strong>Spectroscopy</strong> and<br />
Differential Scanning Calorimetry.<br />
Kevin P. Menard and Richard Spragg.<br />
June, p. 39.<br />
Dual-Use Raman <strong>Spectroscopy</strong> for<br />
Chemical and Biological Agent Identification.<br />
Marie Lesaicherre, Tracy L.<br />
Paxon, Michael C. Burrell, William<br />
Scott Sunderland, Amy Linsebigler,<br />
and Frank J. Mondello. June, p. 6.<br />
Low-Resolution Raman <strong>Spectroscopy</strong>,<br />
the Photonic Engine Behind Materials<br />
Identification’s Promising Future.<br />
Jorge Macho. June, p. 46.<br />
Raman <strong>Spectroscopy</strong> as a Rapid Characterization<br />
Tool for Heterogeneous<br />
Solids. Joe Hodkiewicz and Mark<br />
Wall. June, p. 18.<br />
Transmission Raman Offers Improved<br />
Quantitation of Pharmaceutical Solids.<br />
Fran Adar, Eunah Lee, and Andrew<br />
Whitley. June, p. 26.<br />
UV SPECTROSCOPY<br />
Interaction of Indigo Carmine with Nucleic<br />
Acids in the Presence of Cetyltrimethylammonium<br />
Bromide: Spectral<br />
Studies and the Confirmation of<br />
Combined Points. Changqun Cai,<br />
Xiaoming Chen, and Hang Gong.<br />
November, p. 34.<br />
Spectral Studies on the Interaction of<br />
[Ru(bpy) 2<br />
(BTIP)] 2+ with DNA and<br />
Determination of Nucleic Acids<br />
at Nanogram Levels. Chao Weng,<br />
Xiaoming Chen, and Changqun Cai.<br />
June, p. 39.<br />
X-RAY SPECTROSCOPY<br />
The Revolution in Energy Dispersive X-<br />
Ray Spectrometry: Spectrum Imaging<br />
at Output Count Rates Above 1<br />
MHz with the Silicon Drift Detector<br />
on a Scanning Electron Microscope.<br />
Dale E. Newbury. July, p. 32. ◾
<strong>Spectroscopy</strong><br />
485 Route 1 South,<br />
Building F, First Floor<br />
Iselin, NJ 08830<br />
TELEPHONE<br />
732-225-9500<br />
FAX<br />
732-225-0211<br />
E-MAIL<br />
spectroscopyedit@<br />
advanstar.com<br />
WEB SITE<br />
www.spectroscopyonline<br />
.com<br />
DATE FOUNDED<br />
1985<br />
November 2009 Volume 24 Number 11<br />
<strong>Spectroscopy</strong><br />
An Advanstar Science Publication<br />
www.spectroscopyonline.com<br />
Nucleic Acid Analysis<br />
with UV-vis and NMR<br />
The Sharp New Teeth<br />
of the FDA<br />
The Importance of<br />
Pressure and Vacuum<br />
®<br />
Company Description<br />
<strong>Spectroscopy</strong> is the most widely<br />
read publication devoted<br />
exclusively to spectroscopic<br />
technology, serving an audience<br />
of over 24,000 North American<br />
spectroscopists in industry, the<br />
government, and academia.<br />
Provided to qualified subscribers<br />
at no cost, <strong>Spectroscopy</strong> has<br />
established a reputation for<br />
presenting timely and practical<br />
information for spectroscopists<br />
at all skill levels. We feature<br />
peer-reviewed technical articles, authoritative columns, helpful<br />
tutorials, and comprehensive product information on the full<br />
range of spectroscopic techniques and applications. By presenting<br />
scientifically rigorous information in a user-friendly format,<br />
we promote wider and more effective use of spectroscopy in<br />
research, industry, and the life sciences.<br />
Chief Spectroscopic Techniques Supported<br />
Articles in <strong>Spectroscopy</strong> focus on all major atomic, mass, and<br />
molecular spectroscopic techniques, including AA, ICP, fluorescence,<br />
FT-IR, MS, hyphenated techniques, near-IR, NMR, Raman,<br />
surface analysis and imaging, UV–vis, terahertz, and X-ray. We<br />
also cover important issues of broad interest, such as:<br />
• Lasers and optics<br />
• Chemometrics and statistical data treatment<br />
• Spectral interpretation<br />
• Sample preparation and handling<br />
• Quality issues, validation, calibration, and regulatory compliance<br />
• Instrument design<br />
Markets Served<br />
<strong>Spectroscopy</strong> serves R&D and QA/QC chemists and other scientists<br />
working in virtually all major sectors of private industry;<br />
researchers and educators at universities and colleges; scientists<br />
at government laboratories and regulatory agencies; clinical and<br />
biomedical researchers; analysts at independent laboratories; and<br />
others interested in the field.<br />
<strong>Spectroscopy</strong> is indexed or abstracted by the Chemistry<br />
Citation Index, Excerpta Medica, Chemical Abstracts Service,<br />
Analytical Abstracts, Mass Spectrometry Bulletin, and other<br />
information services.<br />
Issues & Supplements<br />
<strong>Spectroscopy</strong> publishes a monthly print<br />
issue, with each issue focusing on specific<br />
topics, including the February Pittcon<br />
issue, the March Salary Survey, and the<br />
July X-Ray issue. In addition to these<br />
informative and useful monthly issues,<br />
<strong>Spectroscopy</strong> also publishes a series of<br />
supplements on a wide range of topics.<br />
The February and September “Application<br />
Notebooks” connect lab scientists with<br />
the products they need to make their laboratories<br />
more efficient and productive,<br />
while our yearly primer series explores<br />
the topics of Raman Technology, FT-IR,<br />
and ICP. <strong>Spectroscopy</strong>’s quarterly Current<br />
Trends in Mass Spectrometry supplement<br />
and yearly Homeland Security, “Buyers’<br />
Guide,” and “<strong>Corporate</strong> <strong>Capabilities</strong>” issues<br />
also provide our readership with the<br />
kind of useful information that cannot be<br />
found elsewhere. Our monthly newsletter,<br />
“The Wavelength,” brings valuable<br />
technical information to readers electronically,<br />
while our monthly Global Digital<br />
Edition brings <strong>Spectroscopy</strong>’s content to a<br />
worldwide audience. Our website, www.<br />
spectroscopyonline.com, provides readers<br />
with a continually updated resource on<br />
the spectroscopy market, and our<br />
LinkedIn site provides readers with a<br />
valuable social network of colleagues in<br />
the field of materials analysis.<br />
Advertising & Marketing Services<br />
<strong>Spectroscopy</strong> provides a range of advertising<br />
and marketing services to assist<br />
suppliers of the spectroscopy market.<br />
Print-based Marketing:<br />
• Display advertising<br />
• Custom publishing<br />
• Inserts and outserts<br />
• Direct mail lists<br />
• Post-it Notes<br />
• Business Reply Cards<br />
Web-based Marketing:<br />
• Website advertising<br />
• Web seminars<br />
• Podcasts<br />
• Flash presentations<br />
• On-line surveys<br />
• Product e-mail blasts<br />
• E-newsletters<br />
• E-Application note alerts