got metals? got metals? - Spectroscopy
got metals? got metals? - Spectroscopy
got metals? got metals? - Spectroscopy

You also want an ePaper? Increase the reach of your titles
YUMPU automatically turns print PDFs into web optimized ePapers that Google loves.
PRODUCTIVITY TOOLS<br />
<strong>got</strong> <strong>metals</strong>?<br />
- think Milestone<br />
Microwave Digestion Solutions For Your Lab
ETHOS EZ: THE MOST ADVANCED CLOSED<br />
VESSEL MICROWAVE DIGESTION SYSTEM<br />
NEW<br />
ULTRAWAVE: BENCHTOP HIGH THROUGHPUT<br />
MICROWAVE DIGESTION SYSTEM<br />
The ETHOS EZ represents the state of the art in<br />
closed vessel microwave digestion. Unique technology<br />
and unmatched build quality have produced the<br />
safest, most versatile and highest performing system<br />
available. Fully automated power control and patented<br />
vent-and-reseal vessel technology, combined<br />
with the most advanced software, delivers better<br />
digestion quality than any other closed vessel<br />
system - whatever the sample type.<br />
The remarkable UltraWAVE features Milestone’s unique<br />
Single Reaction Chamber (SRC) technology in a fully<br />
automated benchtop package. Unlike closed vessel<br />
digestion, SRC uses disposable glass vials, and different<br />
sample types can be digested simultaneously,<br />
greatly increasing productivity, reducing labor and<br />
overall cost per digestion. The UltraWAVE operates at<br />
high temperature and pressure, so complete digestion<br />
of even the most difficult sample types is achieved.<br />
MILESTONESCI.COM/ETHOSEZ<br />
MILESTONESCI.COM/ULTRAWAVE
i<br />
To download application notes, methods and<br />
more, go to: MILESTONESCI.COM/RESOURCES<br />
i<br />
To find out which Milestone digestion product<br />
is right for you, go to: MILESTONESCI.COM/WHICH<br />
ULTRACLAVE: THE ULTIMATE THROUGHPUT<br />
MICROWAVE DIGESTION SYSTEM<br />
The UltraCLAVE features the same SRC technology<br />
as the UltraWAVE, and offers all the same great<br />
benefits. However, its larger SRC system digests<br />
40 samples simultaneously in disposable glass<br />
vials, making it the most productive microwave<br />
digestion system ever. The UltraCLAVE also delivers<br />
the biggest labor savings, and with lower consumables<br />
costs than closed vessel digestion, rapidly<br />
repays its initial investment in high throughput labs.<br />
i<br />
i<br />
i<br />
For detail on the widest range of digestion rotors<br />
and accessories from Milestone go to:<br />
MILESTONESCI.COM/VESSELS<br />
To learn about the benefits of vent-and-reseal<br />
technology, go to: MILESTONESCI.COM/TECHNOLOGY<br />
For in-depth information on SRC technology<br />
go to: MILESTONESCI.COM/SRC<br />
MILESTONESCI.COM/ULTRACLAVE<br />
866-995-5100<br />
mwave@milestonesci.com<br />
www.milestonesci.com
milestonesci.com/digestion<br />
MILESTONE +<br />
PRODUCTIVITY TOOLS<br />
MILESTONE – A HISTORY OF INNOVATION AND LEADERSHIP IN MICROWAVE DIGESTION<br />
With over 15,000 units shipped since 1988, Milestone is a leading manufacturer of microwave digestion systems. We are proud of our clear<br />
leadership in technology, with over 50 patents granted, and a series of industry firsts. Milestone introduced the first microwave designed specifically<br />
for lab use, the first high pressure vessels, and it’s unique vent-and-reseal vessel technology is a cornerstone of its success today. Operator<br />
safety has always been a #1 priority at Milestone, demonstrated by the development of the patented self-resealing moveable safety door. Other<br />
notable innovations include advanced PID power control, which delivers superior digestion consistency, and the development of EasyCONTROL<br />
software – the easiest to use yet the most powerful software available in microwave digestion. Finally, Milestone’s unique SRC technology dramatically<br />
simplifies the microwave digestion workflow. Milestone is the only manufacturer to offer a range of microwave digestion systems – all<br />
designed and built to offer years of service, and backed by the best service and applications support in the business.<br />
digestion | clean chemistry | mercury | ashing | extraction | synthesis<br />
Milestone Inc. | 25 Controls Drive, Shelton, CT 06484 | 866-995-5100 | mwave@milestonesci.com
Volume 25 Number 12 SPECTROSCOPY CORPORATE CAPABILITIES ISSUE December 2010<br />
December 2010 Volume 25 Number 12<br />
www.spectroscopyonline.com<br />
C 2011 Corporate<br />
Capabilities<br />
I a Data t Integrity and the<br />
E<br />
Human Element<br />
E I<br />
2010 Editorial Index<br />
Application Notes ♦ See page 86
Raman power<br />
On the frontiers of research, Raman gains popularity with its outstanding power<br />
and utility. We’ve tapped Raman user input to design flexible, uncomplicated<br />
instruments. Raman experts and researchers in forensics, pharmaceutical<br />
and analytical labs now tailor their analyses, and arrive at fast, reliable answers<br />
without all the work. Our innovations in instrument design such as the DXR<br />
Raman Microscope put Raman to work for you, not the other way around.<br />
It’s Raman where you’re in charge.<br />
without the work<br />
• see the complete family of Raman instruments at • www.thermoscientific.com/raman<br />
© 2010 Thermo Fisher Scientific Inc. All rights reserved.<br />
DXR Raman Microscope<br />
• From our full line of Raman instruments<br />
• OMNIC software family suite<br />
• Patented automated data optimization<br />
• Industry-best spatial resolution performance<br />
Germanium lines on Chromium ranging from 500 to 900 nm wide
Making FTIR<br />
Sampling Easier<br />
MIRacle <br />
From Solids<br />
to Liquids<br />
From Macro<br />
to Micro<br />
From Monolayers<br />
to Multi-Layers<br />
And<br />
Much More!<br />
MappIR <br />
High throughput, high performance – exceptional quality spectral data.<br />
VeeMAX II<br />
GladiATR Vision <br />
PIKE Technologies products cover the full range of infrared sampling<br />
techniques:<br />
• Attenuated Total Reflectance (ATR)<br />
• Diffuse Reflectance<br />
• Specular Reflectance<br />
• Integrating Spheres<br />
• Polarization<br />
• IR Microsampling<br />
• Long and Short Pathlength Gas Cells<br />
• Transmission Sampling Accessories<br />
• Automated Accessories for Transmission and Reflection<br />
PIKE products are designed and optimized to be compatible with all<br />
major spectrometer models. Many of these products are available with<br />
heating options. Please call us to discuss your sampling requirements.<br />
www.piketech.com<br />
6125 Cottonwood Drive • Madison, WI 53719 • 608.274.2721 • fax: 608.274.0103 • email: sales@piketech.com
te<br />
4 <strong>Spectroscopy</strong> 25(12) December 2010 www.spectroscopyonline.com<br />
®<br />
®<br />
PUBLISHING & SALES<br />
485F US Highway One South, Suite 100, Iselin, NJ 08830<br />
(732) 596-0276, Fax: (732) 596-0003<br />
MANUSCRIPTS: To discuss possible article topics or obtain manuscript preparation<br />
guidelines, contact the editorial director at: (732) 346-3020, e-mail: lbush@advanstar.com.<br />
Publishers assume no responsibility for safety of artwork, photographs, or manuscripts.<br />
Every caution is taken to ensure accuracy, but publishers cannot accept responsibility for the<br />
information supplied herein or for any opinion expressed.<br />
SUBSCRIPTIONS: For subscription information: <strong>Spectroscopy</strong>, P.O. Box 6196, Duluth, MN<br />
55806-6196; (877) 527-7008, 7:00 a.m. to 6:00 p.m. CST. Outside the U.S., +1-218-740-6477.<br />
Delivery of <strong>Spectroscopy</strong> outside the U.S. is 3–14 days after printing. Single-copy price:<br />
U.S., $10.00 + $7.00 postage and handling ($17.00 total); Canada and Mexico, $12.00 + $7.00<br />
postage and handling ($19.00 total); Other international, $15.00 + $7.00 postage and handling<br />
($22.00 total).<br />
CHANGE OF ADDRESS: Send change of address to <strong>Spectroscopy</strong>, P.O. Box 6196, Duluth, MN<br />
55806-6196; provide old mailing label as well as new address; include ZIP or postal code.<br />
Allow 4–6 weeks for change. Alternately, go to the following URL for address changes or<br />
subscription renewal: https://advanstar.replycentral.com/?PID=581<br />
RETURN ALL UNDELIVERABLE CANADIAN ADDRESSES TO: Pitney Bowes, P.O. Box<br />
25542, London, ON N6C 6B2, CANADA.<br />
REPRINTS: Reprints of all articles in this issue and past issues are available<br />
(500 minimum). Call 800-290-5460, x100 or e-mail AdvanstarReprints@theYGSgroup.com.<br />
DIRECT LIST RENTAL: Contact Tamara Phillips, (440) 891-2773; e-mail: tphillips@<br />
advanstar.com<br />
INTERNATIONAL LICENSING: Maureen Cannon, (440) 891-2742,<br />
fax: (440) 891-2650; e-mail: mcannon@advanstar.com.<br />
<strong>Spectroscopy</strong> does not verify any claims or other information appearing in any of the<br />
advertisements contained in the publication, and cannot take any responsibility for any<br />
losses or other damages incurred by readers in reliance on such content.<br />
<strong>Spectroscopy</strong> welcomes unsolicited articles, manuscripts, photographs, illustrations and<br />
other materials but cannot be held responsible for their safekeeping or return.<br />
Advanstar Communications provides certain customer contact data (such as customers’<br />
names, addresses, phone numbers, and e-mail addresses) to third parties who wish to<br />
promote relevant products, services and other opportunities that may be of interest to you.<br />
If you do not want Advanstar Communications to make your contact information available to<br />
third parties for marketing purposes, simply call toll-free (866) 529-2922 between the hours<br />
of 7:30 a.m. and 5 p.m. CST, and a customer service representative will assist you in removing<br />
your name from Advanstar’s lists. Outside the United States, please phone (218) 740-6395.<br />
Michael J. Tessalone<br />
Science Group Publisher, mtessalone@advanstar.com<br />
Edward Fantuzzi<br />
Publisher, efantuzzi@advanstar.com<br />
Stephanie Shaffer<br />
East Coast Sales Manager, sshaffer@advanstar.com<br />
(508) 481-5885<br />
EDITORIAL<br />
Laura Bush<br />
Editorial Director, lbush@advanstar.com<br />
Megan Evans<br />
Managing Editor, mevans@advanstar.com<br />
Stephen A. Brown<br />
Group Technical Editor, sbrown@advanstar.com<br />
Robert Moreschi<br />
Assistant Editor, rmoreschi@advanstar.com<br />
Dan Ward<br />
Art Director, dward@media.advanstar.com<br />
MARKETING<br />
Anne Young<br />
Marketing Manager, ayoung@advanstar.com<br />
MARKET DEVELOPMENT<br />
Tamara Phillips<br />
Direct List Rentals, tphillips@advanstar.com<br />
YGS Group<br />
Reprints, advanstarreprints@theYGSgroup.com<br />
Maureen Cannon<br />
Permissions, mcannon@advanstar.com<br />
PRODUCTION AND AUDIENCE DEVELOPMENT<br />
David Erickson<br />
Production Manager, derickson@media.advanstar.com<br />
Peggy Olson<br />
Audience Development Manager, polson@advanstar.com<br />
Gail Mantay<br />
Audience Development Assistant Manager, gmantay@advanstar.com<br />
50% Recycled Paper<br />
s10-20% Post Consumer Wa<br />
©2010 Advanstar Communications Inc. All rights reserved. No part of this<br />
publication may be reproduced or transmitted in any form or by any means,<br />
electronic or mechanical, including by photocopy, recording, or information storage<br />
and retrieval without permission in writing from the publisher. Authorization to<br />
photocopy items for internal/educational or personal use, or the internal/educational or personal<br />
use of specific clients, is granted by Advanstar Communications Inc. for libraries and other users<br />
registered with the Copyright Clearance Center, 222 Rosewood Dr., Danvers, MA 01923, 978-750-<br />
8400, fax 978-646-8700. For uses beyond those listed above, please direct your written request<br />
to Permission Dept. fax 440-891-2650 or email: mcannon@advanstar.com.<br />
Advanstar Communications Inc. (www.advanstar.com) is a leading worldwide media company<br />
providing integrated marketing solutions for the Fashion, Life Sciences and Powersports<br />
industries. Advanstar serves business professionals and consumers in these industries with its<br />
portfolio of 91 events, 67 publications and directories, 150 electronic publications and Web<br />
sites, as well as educational and direct marketing products and services. Market leading brands<br />
and a commitment to delivering innovative, quality products and services enables Advanstar<br />
to “Connect Our Customers With Theirs.” Advanstar has approximately 1000 employees and<br />
currently operates from multiple offices in North America and Europe.<br />
All color separations, proofs, and film produced by Advanstar’s Scanning and<br />
Digital Prepress Departments.<br />
Joseph Loggia<br />
President, Chief Executive Officer<br />
Ted Alpert<br />
Executive Vice-President, Finance & Chief Financial Officer<br />
Eric I. Lisman<br />
Executive Vice-President, Corporate Development<br />
Tony Calanca<br />
Executive Vice-President, Exhibitions<br />
Chris DeMoulin<br />
Executive Vice-President, Fashion Group<br />
Danny Phillips<br />
Executive Vice-President, Powersports, Veterinary & Dental Group<br />
Georgiann DeCenzo<br />
Executive Vice-President, Market Development, Europe & Licensing Group<br />
Francis Heid<br />
Vice-President, Media Operations<br />
J Vaughn<br />
Vice-President, Information Technology<br />
Mike Alic<br />
Vice-President, Electronic Media Group<br />
Nancy Nugent<br />
Vice-President, Human Resources<br />
Ward D. Hewins<br />
Vice-President, General Counsel<br />
David C. Esola<br />
Vice-President, General Manager
Tools for IncreasingEfficiency<br />
&Productivity<br />
In Drug Discovery & Development<br />
ON DEMAND<br />
Register Free at: http://chromatographyonline.com/increasing<br />
Event Overview:<br />
Today’s high performance discovery laboratories perform many different assays on an increasing<br />
number of novel pharmaceutical compounds. To improve the discovery pipeline, drug discovery labs<br />
must gather more and more information on a greater number of new chemical entities. New innovative<br />
software tools, such as DiscoveryQuant, can greatly improve the situation through automation,<br />
information sharing and monitoring functionality. Learn how DiscoveryQuant can dramatically impact<br />
the efficiencies of the modern early-ADME drug discovery environment.<br />
Innovations in sample throughput and chromatography have made efficient data quantitation a priority<br />
in the bioanalytical laboratory operating in both regulated and non-regulated environments. Learn how<br />
MultiQuant can accelerate your quantitative research, save valuable time with generation of instant<br />
statistic tables and metric plots, increase performance through powerful integration algorithms and<br />
enhance security with robust audit trail functionality.<br />
Speakers:<br />
Dr. John Janiszewski<br />
Associate Research Fellow<br />
Pfizer Global Research & Development<br />
Dr. Rick King<br />
Laboratory Director<br />
PharmaCadence Analytical Services, LLC<br />
Moderator:<br />
Laura Bush<br />
Editorial Director<br />
LCGC<br />
Who Should Attend:<br />
Current LC/MS/MS users in early-ADME and regulated<br />
and non-regulated bioanalytical laboratories interested<br />
in improving their efficiencies and productivity in highthroughput<br />
drug discovery assays and streamlining their<br />
data review process.<br />
Key Learning Objectives:<br />
Learn how to increase efficiencies for the development<br />
of early-ADME high-throughout assays.<br />
Discover new tools to streamline the quantitative data<br />
processing & review for small molecules, large biomarkers<br />
and biopharmaceuticals
6 <strong>Spectroscopy</strong> 25(12) December 2010<br />
®<br />
CONTENTS<br />
www.spectroscopyonline.com<br />
volume 25 number 12<br />
december 2010<br />
December 2010<br />
Volume 25 Number 12<br />
Columns<br />
THE BASELINE 12<br />
Neutron <strong>Spectroscopy</strong><br />
David Ball discusses neutron sources and introduces the two types of neutron scattering:<br />
elastic and inelastic.<br />
David W. Ball<br />
FOCUS ON QUALITY 15<br />
Fat Finger, Falsification, or Fraud?<br />
Where is the dividing line between a simple mistake and falsification?<br />
R.D. McDowall<br />
Cover image courtesy of<br />
Getty Images.<br />
Articles<br />
<strong>Spectroscopy</strong> Market: Weathering the Storm and 19<br />
on the Path to Recovery<br />
The author discusses current trends in the spectroscopy market.<br />
Sivakumar Narayanaswamy<br />
2010 Editorial Index 22<br />
<strong>Spectroscopy</strong> presents its annual index of authors and articles.<br />
ON THE WEB<br />
WEB SEMINARS<br />
New seminars now available on demand<br />
at www.spectroscopyonline.com:<br />
Changing Everything You Know About<br />
Liquids Analysis by FTIR<br />
Investigating Fluorescence Lifetime<br />
<strong>Spectroscopy</strong> and Imaging<br />
The Easiest and Most Cost-efficient<br />
Way to Determine Elements in<br />
Environmental Matrices by ICP-MS<br />
According to Your Regulations<br />
Increase LC/MS Throughput and<br />
Improve ROI for Biological Samples<br />
SPECTROSCOPY WAVELENGTH<br />
Subscribe to our monthly newsletter, which<br />
features new tools, applications, feature<br />
articles, and other industry developments.<br />
SPECTROSCOPYONLINE.COM<br />
The full spectrum of technical, applicationsoriented<br />
information about spectroscopy.<br />
Join the<br />
<strong>Spectroscopy</strong> Group<br />
on LinkedIn<br />
Application Notes<br />
Portable Transmission FTIR Analysis of Volatile Samples 86<br />
Using the DialPath Liquid Cell<br />
Frank Higgins, A2 Technologies<br />
Long-Wavelength Dispersive 1064nm Raman: Non-Invasive 88<br />
Cancer Tissue Diagnostics<br />
BaySpec, Inc.<br />
Determination of Low Concentration Methanol in Alcohol 89<br />
by an Affordable High Sensitivity Raman Instrument<br />
Duyen Nguyen and Eric Wu, Enwave Optronics, Inc.<br />
High-Resolution NIR Analysis 90<br />
R. Morris, Ocean Optics, Inc.<br />
DEPARTMENTS<br />
From the Editor . . . . . . . . . . . . . . . . . . . . . . . . . . . . . . . . . . . . . . . . . . . . . . . . . . . . . .10<br />
News Spectrum . . . . . . . . . . . . . . . . . . . . . . . . . . . . . . . . . . . . . . . . . . . . . . . . . . . . . . 11<br />
Corporate Capabilities . . . . . . . . . . . . . . . . . . . . . . . . . . . . . . . . . . . . . . . . . . . . . . . . .32<br />
<strong>Spectroscopy</strong> (ISSN 0887-6703 [print], ISSN 1939-1900 [digital]) is published monthly by Advanstar Communications, Inc.,<br />
131 West First Street, Duluth, MN 55802-2065. <strong>Spectroscopy</strong> is distributed free of charge to users and specifiers of spectroscopic<br />
equipment in the United States. <strong>Spectroscopy</strong> is available on a paid subscription basis to nonqualified readers at the<br />
rate of: U.S. and possessions: 1 year (12 issues), $74.95; 2 years (24 issues), $134.50. Canada/Mexico: 1 year, $95; 2 years, $150. International:<br />
1 year (12 issues), $140; 2 years (24 issues), $250. Periodicals postage paid at Duluth, MN 55806 and at additional<br />
mailing offices. POSTMASTER: Send address changes to <strong>Spectroscopy</strong>, P.O. Box 6196, Duluth, MN 55806-6196. Canadian<br />
GST number: R-124213133RT001, Publications Mail Agreement Number 40017597. Printed in the U.S.A.
ZZZKRULEDFRPVFLHQWL¿F<br />
HPDLODGVFL#KRULEDFRP<br />
3URYLGLQJWKHWRROVWRKHOS\RXFKDQJHWKHZRUOG<br />
)OXRUHVFHQFH<br />
:RUOGVPRVWVHQVLWLYH<br />
DQGPRGXODUUHVHDUFK<br />
VSHFWURÀXRURPHWHUVI<br />
7&63&DQGIUHTXHQF\<br />
OLIHWLPHV)RUELRWHFKQ<br />
QDQRWHFKQRORJ\<br />
$WRPLFHPLVVLRQ<br />
VSHFWURVFRS\HOHPHQW<br />
DQDO\VLV,&3DQGJORZ<br />
GLVFKDUJHRSWLFDOHPLV<br />
VSHFWURPHWHUV(OHPH<br />
DQDO\VHUVIRU&6+<br />
6XOSKXULQSHWUROHXP<br />
5DPDQDQDO\VLV<br />
$QDO\WLFDODQGUHVHDUF<br />
V\VWHPVIRUDFDGHPLF<br />
LQGXVWULDODSSOLFDWLRQV<br />
PDFURFDSDELOLWLHVZLW<br />
H[FLWDWLRQVIURPIDU8<br />
)RUSKDUPDFHXWLFDOV<br />
VHPLFRQGXFWRUVDQGP<br />
DQDO\VLV<br />
;UD\ÀXRUHVFHQF<br />
1RQGHVWUXFWLYH(';5<br />
PLFURDQDO\VLVZLWKVS<br />
PPWR P3R<br />
PDSSHGLPDJLQJIRUP<br />
IRUHQVLFVSKDUPDJH<br />
DQG:(((5R+6<br />
3DUWLFOHFKDUDFWHUL<br />
7RROVWRPHDVXUHWKH<br />
PPVKDSHVXUIDFH<br />
FKDUJHRISRZGHUVVX<br />
DQGHPXOVLRQV7HFKQ<br />
LQFOXGHODVHUGLIIUDFWLR<br />
OLJKWVFDWWHULQJDFRXV<br />
VSHFWURVFRS\LPDJHD<br />
DQG%(7VXUIDFHDUHD<br />
)RUHQVLFV<br />
&ULPHVFHQHRIFULPH<br />
ODERUDWRU\OLJKWVRXUF<br />
)LQJHUSULQWDQGSDOPS<br />
LGHQWL¿FDWLRQV\VWHPV<br />
,PDJHHQKDQFHPHQW<br />
2SWLFDOVSHFWURVFRS\<br />
0RQRFKURPDWRUV<br />
VSHFWURJUDSKVDUUD\DQG<br />
VLQJOHFKDQQHOGHWHFWRUV<br />
OLJKWVRXUFHVDQGVDPSOH<br />
DFFHVVRULHV<br />
'HWHFWRUV<br />
&&'DQGRWKHUGHWHFWRUVIRU<br />
VSHFWURVFRS\DQGLPDJLQJDSSOLFDWLRQV<br />
&RQWUDFWPDQXIDFWXUHIRU2(0<br />
2(06SHFWURPHWHUVJUDWLQJV<br />
KDQGKHOG5DPDQ<br />
*UDWLQJVPRQRFKURPDWRUV<br />
VSHFWURJUDSKVGHWHFWRUVDFTXLVLWLRQ<br />
HOHFWURQLFVOLJKWVRXUFHVDQGPLQL<br />
5DPDQSUREHVODVHUVDQGV\VWHPVIRU<br />
LQGXVWULDODSSOLFDWLRQV<br />
&XVWRPJUDWLQJVDQG<br />
989EHDPOLQHV<br />
*UDWLQJVIRUKLJKSRZHUODVHUV<br />
VSDFHÀLJKWH[SHULPHQWVDQG<br />
989LQVWUXPHQWV6\QFKURWURQ989<br />
FKDPEHUVPLUURUVDQGEHDPOLQHV<br />
(OOLSVRPHWU\<br />
%HQFKWRSDQGLQVLWXVSHFWURVFRSLF<br />
HOOLSVRPHWHUVDQGVSHFWURVFRSLF<br />
UHÀHFWRPHWHUV1RQGHVWUXFWLYH<br />
FKDUDFWHULVDWLRQRIWKLQ¿OPWKLFNQHVV<br />
DQGRSWLFDOFRQVWDQWV<br />
6XUIDFH3ODVPRQ5HVRQDQFH<br />
,PDJLQJ<br />
6LPXOWDQHRXVPXOWLSUREH635V\VWHPV<br />
DQGVXUIDFHFKHPLVWU\VROXWLRQVIRU<br />
ODEHOIUHHDQDO\VLVRIELRPROHFXOHV<br />
SURYLGLQJLQIRUPDWLRQRQNLQHWLF<br />
SURFHVVHVDVVRFLDWLRQDQGGLVVRFLDWLRQ<br />
ELQGLQJDI¿QLW\DQGUHDOWLPHWDUJHW<br />
PROHFXOHGHWHFWLRQ
8 <strong>Spectroscopy</strong> 25(12) December 2010<br />
www.spectroscopyonline.com<br />
December 2010 Volume 25 Number 12<br />
2011 Corporate Capabilities<br />
32 A2 Technologies<br />
62 Nippon Instruments North<br />
34 ABB Analytical Measurement<br />
36 Amptek, Inc.<br />
38 Applied Photophysics<br />
40 Avantes, Inc.<br />
41 B&W Tek, Inc.<br />
42 BaySpec, Inc.<br />
43 Bruker Corporation<br />
44 CVI Melles Griot<br />
45 Energetiq Technology, Inc.<br />
46 EDAX, Inc.<br />
48 Environmental Express<br />
49 Enwave Optronics, Inc.<br />
51 Harrick Scientific Products, Inc.<br />
52 Hellma USA, Inc.<br />
53 HORIBA Scientific<br />
54 International Centre for Diffraction<br />
Data (ICDD)<br />
55 Inorganic Ventures<br />
56 Innovative Photonic Solutions<br />
58 Iridian Spectral Technologies<br />
59 Newport Corporation<br />
60 Moxtek, Inc.<br />
America<br />
63 OI Analytical<br />
64 Ocean Optics, Inc.<br />
66 OptiGrate Corp.<br />
67 Optometrics Corporation<br />
68 PerkinElmer, Inc.<br />
70 Pair Technologies, LLC<br />
50 Parker Hannifin Corporation<br />
71 Photon etc.<br />
72 PHOTONIS USA<br />
73 PIKE Technologies<br />
74 Polymicro Technologies, A<br />
subsidiary of Molex Incorporated<br />
75 Specac, Inc.<br />
91 <strong>Spectroscopy</strong><br />
76 Shimadzu Scientific Instruments<br />
78 SPEX CertiPrep<br />
80 Spellman High Voltage Electronics<br />
81 Teledyne Leeman Labs<br />
82 Thermo Fisher Scientific<br />
84 WITec GmbH<br />
85 XOS
www.spectroscopyonline.com December 2010 <strong>Spectroscopy</strong> 25(12) 9<br />
Editorial Advisory Board<br />
Ramon M. Barnes University of Massachusetts<br />
Paul N. Bourassa Lifeblood<br />
Chris W. Brown University of Rhode Island<br />
Kenneth L. Busch Wyvern Associates<br />
Ashok L. Cholli University of Massachusetts at Lowell<br />
David M. Coleman Wayne State University<br />
Patricia B. Coleman Ford Motor Company<br />
Bruce Hudson Syracuse University<br />
Kathryn S. Kalasinsky Armed Forces Institute of Pathology<br />
David Lankin University of Illinois at Chicago, College of Pharmacy<br />
Barbara S. Larsen DuPont Central Research and Development<br />
Ian R. Lewis Kaiser Optical Systems<br />
Jeffrey Hirsch Thermo Fisher Scientific<br />
Howard Mark Mark Electronics<br />
R.D. McDowall McDowall Consulting<br />
Linda Baine McGown Rensselaer Polytechnic Institute<br />
Robert G. Messerschmidt Rare Light, Inc.<br />
Nancy Miller-Ihli M–I Research<br />
Francis M. Mirabella Jr. Equistar Technology Center<br />
John Monti Shimadzu Scientific Instruments<br />
Thomas M. Niemczyk University of New Mexico<br />
Anthony J. Nip CambridgeSoft Corp.<br />
John W. Olesik The Ohio State University<br />
Richard J. Saykally University of California, Berkeley<br />
Basil I. Swanson Los Alamos National Laboratory<br />
Jerome Workman Jr. Consultant<br />
Contributing Editors:<br />
Fran Adar Horiba Jobin Yvon<br />
David W. Ball Cleveland State University<br />
Kenneth L. Busch Wyvern Associates<br />
John Coates Coates Consulting<br />
Howard Mark Mark Electronics<br />
Volker Thomsen Consultant<br />
Jerome Workman Jr. Consultant<br />
Process Analysis Advisory Panel:<br />
James M. Brown Exxon Research and Engineering Company<br />
Bruce Buchanan Sensors-2-Information<br />
Lloyd W. Burgess CPAC, University of Washington<br />
James Rydzak Glaxo SmithKline<br />
Robert E. Sherman CIRCOR Instrumentation Technologies<br />
John Steichen DuPont Central Research and Development<br />
D. Warren Vidrine Vidrine Consulting<br />
European Regional Editors:<br />
John M. Chalmers VSConsulting, United Kingdom<br />
David A.C. Compton Industrial Chemicals Ltd.<br />
<strong>Spectroscopy</strong>’s Editorial Advisory Board is a group of distinguished individuals<br />
assembled to help the publication fulfill its editorial mission to promote the effective<br />
use of spectroscopic technology as a practical research and measurement tool.<br />
With recognized expertise in a wide range of technique and application areas, board<br />
members perform a range of functions, such as reviewing manuscripts, suggesting<br />
authors and topics for coverage, and providing the editor with general direction and<br />
feedback. We are indebted to these scientists for their contributions to the publication<br />
and to the spectroscopy community as a whole.
10 <strong>Spectroscopy</strong> 25(12) December 2010<br />
www.spectroscopyonline.com<br />
From the Editor<br />
A New Adventure<br />
Sometimes, even when you enjoy your current work, embarking on a new adventure is just<br />
the thing. That is exactly the position I find myself in, as the new editorial director of<br />
Advanstar Communications’ Analytical Science group, which includes Spectrocopy and<br />
LCGC North America.<br />
I have spent the last five years as the editor in chief of a sister publication, BioPharm<br />
International, focused on biopharmaceutical process development and manufacturing. It was a<br />
wonderful place to be, because the field is fascinating and full of passionate people. Yet when<br />
presented with the opportunity to shift gears and join <strong>Spectroscopy</strong> and LCGC, I could not resist.<br />
Although only officially in the new job for 10 days now, I know already it was a good choice.<br />
Following meetings and phone calls with contributors and members of our editorial advisory<br />
board, as well as two days at the Eastern Analytical Symposium, it is clear to me that the fields<br />
of spectroscopy and chromatography, just like bioprocessing, are really interesting and full of<br />
great, passionate people. Who could ask for anything more?<br />
Well, I could. The thing I will ask for is your input.<br />
The questions I have been addressing with my editorial board are centered on providing you<br />
with the information you need. We are discussing the emerging trends and applications you<br />
should know about, the technological advances that may facilitate your work, and which leading<br />
researchers we want to invite to publish in our journals and speak in our educational web<br />
seminars. Keeping you abreast of the leading edge of spectroscopy is our job, and quite an<br />
enjoyable one at that. At the same time, no one knows better than you what challenges you face<br />
in the laboratory on a daily basis. Which measurements continue to present problems for you?<br />
Are you running into difficulty with a certain application or technique? Not sure what conditions<br />
are ideal for a given analysis? Let us know.<br />
In addition, the transition to a new editor is a perfect time to evaluate not just what<br />
leading-edge and ongoing topics we want to bring you, but also how well we are providing that<br />
information, through the print and digital editions of the journal, our educational web seminars,<br />
and our newsletters. Are there ways you feel we can do this better? Do you have new ideas we<br />
should consider? On the other hand, are there aspects of the magazine, our seminars, or any of our<br />
other digital offerings that you don’t want us to change at all? I encourage all of you to communicate<br />
with us about your interests, concerns, and ideas. Our purpose is to serve you, so we welcome<br />
any thoughts you have on how we can do that better.<br />
Laura Bush is the editorial director of LCGC<br />
North America and <strong>Spectroscopy</strong>,<br />
lbush@advanstar.com.
www.spectroscopyonline.com<br />
News Spectrum<br />
Research<br />
Scientists from the Rollins School of Public<br />
Health at Emory University (Atlanta, Georgia) have<br />
recently developed a new statistical method for liquid<br />
chromatography–mass spectrometry (LC–MS) analysis.<br />
Tianwei Yu and Hesen Peng arrived at this new<br />
estimation model by carrying out a series of<br />
simulations, along with tests on a number of various<br />
real-world samples.<br />
In their report, they explain that peak modeling<br />
represents a core component in preprocessing data<br />
for LC–MS studies. According to Yu and Peng, “To<br />
accurately quantify partially overlapping peaks,<br />
we developed a deconvolution method using the<br />
bi-Gaussian mixture model combined with statistical<br />
model selection.”<br />
This new method eventually may allow more complex<br />
biological samples to be tested, yielding a much more<br />
accurate analysis with LC–MS.<br />
A Japanese research group, led by Professor<br />
Ryusuke Kakigi and Dr. Emi Nakato (National Institute<br />
for Physiological Sciences) and Professor Masami<br />
K. Yamaguchi (Chuo University), has released a<br />
December 2010 <strong>Spectroscopy</strong> 25(12) 11<br />
study that used near-infrared (NIR) spectroscopy to<br />
evaluate which regions of infants’ brains are involved in<br />
processing positive and negative facial expressions. The<br />
study was published in the journal NeuroImage.<br />
In the study, NIR spectroscopy was used to measure<br />
changes in the concentrations of oxyhemoglobin,<br />
deoxyhemoglobin, and total hemoglobin as an index<br />
of neural activation in the superior temporal sulcus<br />
(STS) region of the brain. Neuroimaging studies in<br />
adults have revealed that several areas of the brain,<br />
including the STS, are involved in the processing of<br />
facial expressions. This study examined whether the<br />
STS is involved in such perception in infants as well.<br />
NIR spectroscopy is useful for such studies because it<br />
provides a non-invasive means of estimating cerebral<br />
blood flow and does not require severe constraints of<br />
head-movement.<br />
The study confirmed that the STS is involved in<br />
facial recognition in infants. The study also showed<br />
hemispheric differences: the left temporal area of<br />
infants’ brains was significantly activated for happy<br />
faces, while the right temporal area was activated<br />
for angry faces. According to the research group, the<br />
hemispheric lateralization of neural responses to facial<br />
expressions develops by the age of 6 months. ◾<br />
Market Profile: Handheld and Portable NIR<br />
Demand for portable and handheld near infrared<br />
(NIR) instruments has exploded over the past several<br />
years, mirroring trends in other handheld spectroscopy<br />
techniques. Initially driven by the polymers and plastics<br />
industry, demand for the technique is now becoming<br />
significantly diversified, which should help drive strong<br />
growth for a number of years to come.<br />
Significant technological<br />
advancements have enabled the<br />
development of practical low-cost<br />
and rugged spectrometers over<br />
the past several years, including<br />
NIR-based instruments. Smaller<br />
and more powerful batteries<br />
and improved electronics have<br />
helped, but the application of<br />
micro electromechanical system<br />
(MEMS) technology to the area<br />
Environmental<br />
7%<br />
Pharmaceuticals<br />
18%<br />
Other<br />
10%<br />
was perhaps the most significant of these improvements.<br />
The plastics and polymers industry has accounted<br />
for the largest industrial demand thus far for handheld<br />
NIR instruments, which have seen heavy use in the<br />
classification of used plastics for recycling. Applications<br />
in agriculture and food are becoming increasingly<br />
important to the handheld and portable market,<br />
which is only natural because of the heavy use of other<br />
configurations of NIR spectroscopy in the industry. The<br />
use of portable and handheld NIR also is increasing for<br />
incoming material inspection in the pharmaceutical<br />
industry.<br />
Global demand for handheld and portable NIR<br />
developed from less than $10 million in 2005 to nearly<br />
$40 million in 2008 before being<br />
significantly impacted by the global<br />
Agriculture and food<br />
34%<br />
Polymers and plastics<br />
31%<br />
Portable NIR spectroscopy market in 2009<br />
recession in 2009. However, demand<br />
was expected to rebound strongly in<br />
2010 and should continue on a pace<br />
of double-digit growth for several<br />
years to come.<br />
The foregoing data were<br />
extracted from SDi’s market<br />
analysis and perspectives report<br />
entitled The Global Assessment<br />
Report 11th Edition: The Laboratory Life Science<br />
and Analytical Instrument Industry, October 2010.<br />
For more information, contact Stuart Press, Vice<br />
President, Strategic Directions International, Inc., 6242<br />
Westchester Parkway, Suite 100, Los Angeles, CA 90045,<br />
(310) 641-4982, fax: (310) 641-8851, www.strategicdirections.com.
12 <strong>Spectroscopy</strong> 25(12) December 2010<br />
www.spectroscopyonline.com<br />
The Baseline<br />
Neutron <strong>Spectroscopy</strong><br />
Not all spectroscopy uses light . . .<br />
David W. Ball<br />
Most of us are at least nominally aware that light<br />
(rather, electromagnetic radiation) is not the only<br />
possible probe of matter and its behavior. One type<br />
of analysis uses neutrons as the probe of matter. As such,<br />
this is a form of neutron spectroscopy, or as it is more commonly<br />
called, neutron scattering. Neutron scattering is separated<br />
into two types: elastic neutron scattering and inelastic<br />
neutron scattering. In elastic neutron scattering, the neutrons<br />
have the same energy coming out of a sample as they<br />
did going in, while in inelastic neutron scattering the energy<br />
of the neutrons changes because of their interaction with<br />
matter. Here I will briefly introduce both types of scattering.<br />
Sources of Neutrons<br />
Neutrons are a kind of subatomic particle normally found<br />
in the nucleus of atoms. Hence, production of neutrons<br />
invariably requires nuclear processes. A common source of<br />
neutrons for research (as opposed to power generation) purposes<br />
is a small nuclear reactor that uses low-enriched uranium,<br />
or LEU. LEU is defined as uranium enriched in 235 U<br />
at concentrations less than 20% (natural uranium consists of<br />
0.7% 235 U). According to the International Atomic Energy<br />
Agency’s web site (1), at this writing there are currently 235<br />
reactors around the world that are supplying neutrons for<br />
research purposes.<br />
The other way of generating neutrons is by spallation,<br />
which is the name given to the process by which a target<br />
is hit with a projectile and pieces of the target are ejected<br />
as a result. In nuclear spallation, hydride ions (H – ) are accelerated<br />
by a particle accelerator, then stripped of their<br />
electrons down to the bare proton, which is accelerated<br />
further and directed to a heavy metal (like tantalum or<br />
mercury) target. As many as 20–30 neutrons are given<br />
off by the metal nucleus for each proton that impacts the<br />
nuclei. The neutrons are then directed toward various experiments.<br />
The person who first envisioned nuclear spallation?<br />
Glenn Seaborg.<br />
In many circumstances, neutrons that are produced by<br />
either method are too high in energy, so their energies must<br />
be decreased before they are used; we say that the neutrons<br />
must be moderated. Materials that moderate neutrons include<br />
light and heavy water, beryllium, and graphite.<br />
Neutrons are classified by their energies (expressed<br />
in electron-volts, eV), which are directly related to their<br />
velocities (in meters or kilometers per second) and temperatures<br />
(in kelvins). For a particle the size of a neutron<br />
(1.675 × 10 –27 kg), 1 eV of energy corresponds to a velocity<br />
of 13.8 km/s; keep in mind that the energy of a neutron<br />
depends on the square of the velocity (remember, K = ½<br />
mv 2 ). As such, classification can imply a neutron’s velocity<br />
or its temperature. Fast neutrons have an energy of 0.1–1<br />
MeV (megaelectron-volt), or a velocity of 4000–14,000<br />
km/s. Slow neutrons have an energy of 100 eV or less, corresponding<br />
to a velocity of 138 km/s. (Take these numbers<br />
with a grain of salt; references can differ greatly about the<br />
energy and velocity cutoffs. It should be clear, however,<br />
that fast neutrons are, well, faster and more energetic than<br />
slow neutrons.)<br />
Thermal neutrons have an average temperature of room<br />
temperature, or about 295 K. This corresponds to an energy<br />
of 0.025 eV and a velocity of 2.2 km/s. Neutrons with an<br />
energy/velocity/temperature higher than this are called hot<br />
neutrons, and neutrons with an energy/velocity/temperature<br />
lower than this are called cold neutrons. Even within cold
www.spectroscopyonline.com December 2010 <strong>Spectroscopy</strong> 25(12) 13<br />
neutrons, there are other classifications,<br />
going down to ultracold neutrons,<br />
which have energies in the range<br />
of nanoelectron-volts and velocities on<br />
the order of meters per second.<br />
One other thing to remember is that<br />
neutrons have an equivalent wavelength<br />
given by the de Broglie relation:<br />
λ<br />
λ = h/p = h/mv<br />
where λ is the de Broglie wavelength<br />
in meters, h is Planck’s constant in<br />
units of joule-seconds, m is the mass<br />
of a particle in kilograms, and v is the<br />
velocity of the particle in meters per<br />
second. For a neutron, h and m are<br />
constants (we’re assuming that most<br />
velocities are nonrelativistic, or that<br />
relativistic corrections — which for<br />
these neutrons are on the order of 1.5%<br />
at most — can be ignored), so the de<br />
Broglie relation reduces to<br />
d<br />
2Ө<br />
λ = (3.956 × 10 –7 )/v<br />
Thus, neutron wavelengths range<br />
from 2.8 × 10 –14 m (0.00028 Å) or<br />
smaller for fast neutrons to 1.8 ×<br />
10 –10 m (1.8 Å) for thermal neutrons<br />
to 4.95 × 10 –8 m (495 Å, which is the<br />
same wavelength as extreme ultraviolet<br />
[EUV] light) for ultracold neutrons.<br />
Some forms of neutron scattering<br />
take advantage of the wave nature of<br />
neutrons.<br />
Elastic Neutron Scattering<br />
One application of elastic neutron<br />
scattering is neutron diffraction to<br />
determine structures of solid, liquids,<br />
and gases. Taking advantage of the<br />
neutron’s wave properties, neutron diffraction<br />
is very similar to X-ray diffraction.<br />
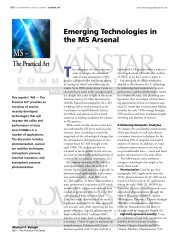
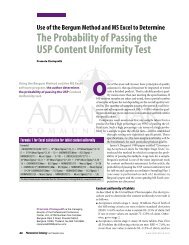
For example, it obeys the Bragg<br />
equation:<br />
nλ = 2d sin Θ<br />
where λ is the de Broglie wavelength<br />
of the neutrons, d is the distance<br />
between adjacent planes of scattering<br />
particles, Θ is the angle between<br />
the incoming neutron source and the<br />
plane of the scattering particles, and<br />
n is an integer called the order of the<br />
diffraction. Diffraction of neutrons<br />
Figure 1: Illustration of the geometry of the Bragg equation.<br />
is based on the production of constructive<br />
interference of the waves, as<br />
shown in Figure 1.<br />
Neutron diffraction has some advantages<br />
over X-ray diffraction. Perhaps<br />
most importantly, neutrons are<br />
diffracted from atomic nuclei rather<br />
than from electron clouds, so exact<br />
atomic positions are more accurately<br />
determined and hydrogen shows up<br />
explicitly (hydrogen atoms do not diffract<br />
X-rays well). Neutrons diffract<br />
better at high angles as well as low<br />
angles, so larger scattering angles can<br />
be probed, again increasing the resolution<br />
of the experiment. Because of<br />
the higher accuracy, neutron diffraction<br />
can be used to study the stress<br />
behavior of solids.<br />
Neutron diffraction suffers by requiring<br />
larger sample sizes, so single<br />
crystal neutron diffraction is rare;<br />
powdered samples are the norm.<br />
Certain atomic nuclei are also strong<br />
absorbers of neutrons, so they are<br />
not strong scatterers. The scattering<br />
vs. absorption of neutrons is isotopedependent,<br />
so different isotopes of the<br />
same element can be noticed.<br />
Elastic neutron scattering can also<br />
be used for reflectometry, which is a<br />
technique used to study thin films.<br />
As with neutron diffraction, neutron<br />
reflectometry provides complementary<br />
information compared to X-ray reflectometry.<br />
Inelastic Neutron Scattering<br />
In inelastic neutron scattering, the<br />
neutrons interact with a sample in such<br />
a way as to change their energies, getting<br />
either more or less energetic. In<br />
this regard, inelastic neutron scattering<br />
is very similar to classic forms of<br />
spectroscopy. Indeed, the experimental<br />
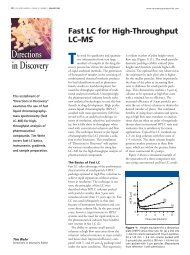
setup is also similar, as shown in Figure<br />
2. Some forms of inelastic neutron<br />
scattering use a monochromator, while<br />
others do not.<br />
In time-of-flight scattering, a polychromatic<br />
neutron pulse is chopped<br />
or monochromated and then sent<br />
through a sample. The sample diffracts<br />
neutrons having certain wavelengths<br />
(that is, certain energies) and at certain<br />
angles. The angles are measured by position-sensitive<br />
detectors, but the wavelengths<br />
(and therefore energies) of the
14 <strong>Spectroscopy</strong> 25(12) December 2010<br />
www.spectroscopyonline.com<br />
Neutron<br />
source<br />
Monochromator<br />
Initial E<br />
Sample<br />
Most neutrons<br />
Some neutrons<br />
Analyzer<br />
Final E<br />
The Nobel Prize in Physics 1994<br />
was awarded “ for pioneering contributions<br />
to the development of neutron<br />
scattering techniques for studies of condensed<br />
matter” jointly with one half to<br />
Bertram N. Brockhouse “ for the development<br />
of neutron spectroscopy” and<br />
with one half to Clifford G. Shull “ for<br />
the development of the neutron diffraction<br />
technique” (3).<br />
This achievement was recently noted<br />
in <strong>Spectroscopy</strong>’s timeline of events in<br />
the history of spectroscopy (4). Shull’s<br />
Wikipedia entry (5) claims that this<br />
was the longest time between the individual<br />
work performed (1946) and the<br />
awarding of the prize to date.<br />
neutrons are determined by measuring<br />
how much time it takes for the neutron<br />
signals to reach a detector. This indicates<br />
the neutron’s velocity, which is<br />
used in de Broglie’s relation to get the<br />
wavelengths of neutrons that are diffracted.<br />
Then the Bragg equation can<br />
be used to determine structural information<br />
of the sample.<br />
Neutron backscattering is a technique<br />
in which “diffraction” is set up<br />
so that the angles of the monochromator<br />
and analyzer are close to 90∘. Fast<br />
neutrons are directed toward a sample<br />
and a portion of them are scattered<br />
back near the source. Because small<br />
nuclei are better at scattering fast neutrons,<br />
an increase in the backscattering<br />
indicates a relatively higher proportion<br />
of smaller atoms like hydrogen.<br />
Neutron backscattering is used to find<br />
water in arid regions and to look for<br />
explosives in unexploded land mines;<br />
it has obvious implications in airport<br />
security.<br />
Neutron spin echo spectroscopy is<br />
an unusual form of spectroscopy that<br />
relies on the precession of a spinning<br />
neutron (spin quantum number = ½),<br />
although it is ultimately a type of timeof-flight<br />
measurement. A polarized<br />
beam of cold, polychromatic neutrons<br />
passes through a magnetic field, where<br />
the number of Larmor precessions of<br />
Detector<br />
Figure 2: Schematic of an inelastic neutron scattering experiment. Note its similarity to a regular<br />
spectroscopic setup.<br />
the neutrons are set depending on the<br />
length and strength of the magnetic<br />
field. The beam then scatters off a<br />
sample and the resulting precessions<br />
after scattering are determined using<br />
a second magnetic field. The difference<br />
in the number of precessions is<br />
an indication of the change in velocity<br />
— and therefore the change in energy<br />
— of the neutrons. In this case, however,<br />
the measurement is not a direct<br />
measure of the energy change, but is<br />
a time-dependent measurement that<br />
can be treated by a Fourier transform<br />
to convert it to the energy domain —<br />
that is, a spectrum. Neutron spin echo<br />
measurements have resolutions on the<br />
order of nanoelectron-volts.<br />
Neutron triple-axis spectrometry<br />
allows for the variations of three<br />
dimensions by being able to rotate<br />
a sample (typically a single crystal),<br />
the monochromator, and the detector<br />
independently (2). Energies probed<br />
include phonon modes of solids.<br />
Amorphous systems, proteins, aggregate<br />
motions of polymers and biological<br />
molecules, and energy transfer<br />
processes in liquids and glasses<br />
can be studied. This technique has<br />
become so useful in the study of the<br />
condensed phases of matter that its<br />
developers were awarded the 1994<br />
Nobel Prize in Physics:<br />
References<br />
(1) International Atomic Energy Agency<br />
website, http://www.iaea.org.<br />
Accessed September 22, 2010.<br />
(2) G. Shirane, S.M. Shapiro, and J.M.<br />
Tranquada, Neutron Scattering with a<br />
Triple-Axis Spectrometer: Basic Techniques<br />
(Cambridge University Press,<br />
2002).<br />
(3) http://nobelprize.org/nobel_prizes/<br />
physics/laureates/1994/. Accessed<br />
October 4, 2010.<br />
(4) H. Mark and S. Brown, <strong>Spectroscopy</strong><br />
25(6), 34–41 (2010).<br />
(5) http://en.wikipedia.org/wiki/Clifford_Shull.<br />
Accessed October 4, 2010.<br />
David W. Ball is a<br />
professor of chemistry at<br />
Cleveland State University<br />
in Ohio. Many of his<br />
“Baseline” columns have<br />
been reprinted in book<br />
form by SPIE Press as The<br />
Basics of <strong>Spectroscopy</strong>, available through<br />
the SPIE Web Bookstore at www.spie.org.<br />
His book Field Guide to <strong>Spectroscopy</strong> was<br />
published in May 2006 and is available<br />
from SPIE Press. He can be reached at<br />
d.ball@csuohio.edu; his website is<br />
academic.csuohio.edu/ball.<br />
For more information on<br />
this topic, please visit:<br />
www.spectroscopyonline.com/ball
www.spectroscopyonline.com December 2010 <strong>Spectroscopy</strong> 25(12) 15<br />
Focus on Quality<br />
Fat Finger, Falsification, or Fraud?<br />
When does human error slide down the slippery slope to falsification and fraud? A central<br />
component of data integrity in any laboratory is the human element — the spectroscopist or<br />
the analytical chemist who will be involved with developing and validating methods or performing<br />
analysis on samples. Mistakes or fat finger moments are part of human nature, but<br />
where is the dividing line between this and falsification or fraud?<br />
R.D. McDowall<br />
So in the title I have suggested that there are three<br />
types of data integrity deviation: fat finger, falsification,<br />
and fraud. Here are my definitions of the terms:<br />
• Fat Finger: An inadvertent mistake made by an analyst<br />
during the course of his or her work that can be made<br />
either on paper or electronically.<br />
• Falsification: An action by an individual who deliberately<br />
writes or enters data or results with the intention to deceive.<br />
• Fraud: Collusion between two or more individuals who<br />
deliberately write or enter data or results with the intention<br />
to deceive.<br />
I have drawn a distinction in the definitions of falsification<br />
and fraud: Falsification is perpetrated by an individual<br />
and fraud by two or more people. However, the<br />
impact of both is the same: the intent to deceive. In writing<br />
this column, I have made the assumptions that each<br />
spectroscopist has a minimum level of scientific and<br />
professional training and will follow the documented<br />
analytical methods and laboratory SOPs. In addition,<br />
the organization the individual works for also has stated<br />
what ethical and professional standards it expects of its<br />
staff at their induction and via regular training sessions<br />
thereafter.<br />
To Err Is Human<br />
Mistakes and fat finger moments? If we are honest, we all<br />
make them. That is why any quality system for laboratories<br />
(for example, ISO 17025, GLP, and GMP) has the four<br />
eyes principle: One individual to perform the work and<br />
a second one to review the data produced to see that the<br />
procedure was carried out correctly and that there are no<br />
typographical errors or mistakes with calculations. Errors<br />
are easy to make; you should see the number I’m making<br />
as I type this column using a new PC that has a slightly<br />
larger keyboard than I am used to.<br />
Many errors and mistakes we make are self corrected.<br />
For example as you enter a number into a spreadsheet cell<br />
or database field, often you will notice that while the brain<br />
tells you to enter “12.3” your fingers actually enter “13.2.”<br />
This is a fat finger moment, but before committing the<br />
number to the cell or database you can correct this as you<br />
can see and have realized your error. The equivalent moment<br />
on paper is when you actually write the wrong numbers<br />
down in your laboratory notebook and then correct<br />
them by striking through the original entry so as not to<br />
obscure it and then entering the correct value along with<br />
your initials, the date, and possibly the reason for change.<br />
This is the paper version of an audit trail.<br />
Some other mistakes that are not noticed by the spectroscopist<br />
can be detected by the software application you<br />
are using, such as a spell checker, or by verification that<br />
the data entered fail to meet certain criteria, such as being<br />
within a predefined range or specific format. So with our<br />
example above, if the data verification range was 11.0–13.0,
16 <strong>Spectroscopy</strong> 25(12) December 2010<br />
www.spectroscopyonline.com<br />
the software would have picked up the<br />
problem even if you had not.<br />
However, that still leaves the<br />
mistakes you don’t realize you have<br />
made. For example, if the entry in the<br />
case above was 11.3, data verification<br />
would be useless and the error would<br />
have been entered without you or the<br />
software realizing that there was a<br />
problem.<br />
Don’t assume that you will spot all<br />
of your mistakes — they are human<br />
mistakes, which is why we need the<br />
second pair of eyes to check the analytical<br />
data and calculated results.<br />
From my experience as a laboratory<br />
manager and an auditor, supervisors<br />
know which members of their staff<br />
are diligent about their work and how<br />
well they check it and which members<br />
are slapdash, and the supervisor will<br />
adjust the review accordingly. So if<br />
you don’t want a dubious reputation<br />
to precede you, be diligent and try<br />
your best to find and correct your<br />
own errors before passing your work<br />
to be checked.<br />
What Is the Fat Finger Rate in a<br />
Laboratory?<br />
To a certain extent, this column is<br />
about airing dirty laundry, which<br />
may not be a particularly interesting<br />
problem to all but is the heart of any<br />
good quality management system: self<br />
audits coupled with effective corrective<br />
and preventative action planning.<br />
Quality is everybody’s problem, and<br />
it is not the sole responsibility of the<br />
quality assurance group to pick up the<br />
errors that the analytical laboratory<br />
has made. However, finding papers<br />
on how often we make mistakes in<br />
an analytical laboratory is difficult<br />
— probably because we don’t really<br />
want to go there. This, however, is the<br />
wrong approach to take and we should<br />
encourage studies to investigate this.<br />
Luckily help is at hand from clinical<br />
chemists working in hospitals<br />
who have published many studies on<br />
error rates in laboratories. For those<br />
that do not know, clinical chemistry<br />
is involved in the analysis of blood,<br />
urine, and other bodily outputs to<br />
help the diagnosis and management<br />
of diseases. Mistakes in this area can<br />
have a critical impact on the health of<br />
a patient and therefore the reduction<br />
in errors is essential.<br />
One paper, entitled “The Blunder<br />
Rate in Clinical Chemistry,” measured<br />
the rate of detected analytical<br />
errors before and after the introduction<br />
of a laboratory information management<br />
system (LIMS) and found<br />
that they were reduced from about 5%<br />
to less than 0.3% following the introduction<br />
of the computer system (1).<br />
Manual transcription errors in patient<br />
records were assessed for blood<br />
results recorded in a critical care setting<br />
by comparing the handwritten<br />
and printed laboratory results in 100<br />
consecutive patients in the intensive<br />
care unit of a UK hospital. Out of<br />
4664 individual values, 67.6% were<br />
complete and accurate, 23.6% were<br />
not transcribed at all, and 8.8% were<br />
inaccurate transcriptions of the results.<br />
Interestingly this study found<br />
that accuracy work was significantly<br />
better in the morning (2).<br />
An Australian study of transcribing<br />
hand-written pathology request<br />
forms to a computer systems and<br />
chemical analysis of the samples<br />
found that error rates were both in<br />
the 1–3% range in the best laboratories.<br />
The worst laboratories, however,<br />
had error rates of up to 39% in<br />
transcription and 26% in analytical<br />
results (3).<br />
So let us extrapolate from the clinical<br />
chemistry laboratory and suggest<br />
that error rates in an analytical<br />
laboratory are in the range of 0.3–3%<br />
depending on the degree of automation<br />
you have. The more manual<br />
input and transcription checking<br />
required, the greater the number of<br />
errors that need to be detected and<br />
captured. Therefore laboratory errors<br />
are expected by external quality audits<br />
and regulatory inspections. Not<br />
finding these detectable errors raises<br />
suspicion of problems with the resultant<br />
delving further into laboratory<br />
records.<br />
The Laboratory Notebook —<br />
Integrity or Falsification?<br />
This brings us to a common issue<br />
that we all have experience with: the<br />
humble laboratory notebook. Typically<br />
this is a bound book with prenumbered<br />
pages, just there to prevent<br />
you tearing out a page to write down<br />
the shopping list or make a paper airplane;<br />
it’s the first stage of ensuring<br />
data integrity in the laboratory. At the<br />
bottom of each page is space for you<br />
to sign and afterward a reviewer–<br />
supervisor–witness–peer to sign after<br />
checking your work and accepting it<br />
as accurate.<br />
OK, here’s the situation: You are<br />
a supervisor and you are checking a<br />
laboratory notebook for some current<br />
work, and in turning the page you<br />
notice that your signature is missing<br />
from when you reviewed some earlier<br />
work. Three out of four pages of the<br />
old work are signed and dated but<br />
you have neglected to sign one of the<br />
pages — so what do you do? Temptation<br />
time! You have the following<br />
options:<br />
1. Ignore the problem and wait for<br />
somebody else to discover it.<br />
2. Sign the page and date it the same<br />
as the other pages.<br />
3. Sign the page but date it with the<br />
current date and add a note that<br />
you have just noticed the problem.<br />
So what are you going to do? It is a<br />
pity that the paper and electronic versions<br />
of this magazine do not come<br />
with the possibility to fit a large hammer<br />
that will hit you over the head<br />
if you pick the wrong options. Most<br />
spectroscopists should reject the first<br />
option, especially if you are working<br />
in a research environment where<br />
product development and especially<br />
patent protection can be crucially<br />
dependent on the date of discovery.<br />
So we’re down to options 2 and 3.<br />
Option 2 is a little voice whispering<br />
in your ear “nobody will know if you<br />
put the same date that the other pages<br />
were signed on.” You can never find a<br />
hammer when you want one! You are<br />
now on the brink of the abyss — on<br />
the plateau is ethics and integrity and<br />
down the slippery slope is falsification<br />
and fraud. May I suggest that<br />
option 3 is the only option worth considering<br />
that will establish credibility<br />
for you and the laboratory? Reiterating<br />
the point in the section above and
www.spectroscopyonline.com December 2010 <strong>Spectroscopy</strong> 25(12) 17<br />
putting my auditor’s hat on: I expect<br />
to see mistakes and if I don’t find any<br />
I become suspicious.<br />
Laboratory Fraud and<br />
Falsification<br />
Now let us move into the murkier<br />
world of falsification and fraud with<br />
the intent to deceive. A place that is<br />
very rich for finding examples dealing<br />
with both these issues is the FDA<br />
warning letters section found at<br />
www.fda.gov. The agency posts warning<br />
letters on its web site under the<br />
US Freedom of Information Act, with<br />
the intent of a name-and-shame approach.<br />
I quote these examples from<br />
the pharmaceutical industry; the FDA<br />
openly publishes this information,<br />
whereas the European regulators or<br />
ISO 17025 accreditation agencies usually<br />
keep it confidential.<br />
Four of the warning letters and<br />
regulatory issues that have emerged<br />
recently in this arena follow:<br />
• The classic fraud case involving<br />
laboratory data is that of Able<br />
Laboratories from 2005 (4). The<br />
company was engaged in a systematic<br />
laboratory fraud to pass<br />
batches of drug product that failed<br />
to meet specifications by changing<br />
weights and conversion factors<br />
and even cutting and pasting chromatograms.<br />
Results that failed were<br />
manipulated and faked until they<br />
passed — an original result for dissolution<br />
testing was ~30% versus a<br />
specification of >85% but after the<br />
magic fingers were applied the final<br />
result was ~89%! The company had<br />
passed several regulatory inspections<br />
until a whistleblower alerted<br />
the FDA to these practices. After a<br />
detailed inspection, the company<br />
withdrew several drug applications,<br />
recalled over 3100 batches of product<br />
and eventually went bankrupt.<br />
There was a subsequent criminal<br />
prosecution of four members of the<br />
company for fraud.<br />
• During an inspection of Ohm<br />
Laboratories in 2009, suspicion<br />
was aroused in the stability testing<br />
laboratory about material that<br />
had been taken out of the stability<br />
chambers for analysis. The material<br />
had been signed out by the stability<br />
coordinator but, as the warning<br />
letter noted, the attendance record<br />
showed that the stability coordinator<br />
was absent from the firm during<br />
those dates in which the coordinator<br />
recorded the withdrawal of<br />
samples from the stability chambers<br />
(5). This is very similar to the<br />
laboratory notebook example we<br />
discussed above.<br />
• A Chinese company, Xian Libang<br />
Pharmaceutical Co. (6), was found<br />
to have used the IR spectra from<br />
one batch of material to support the<br />
release of two subsequent batches.<br />
The warning letter noted that this<br />
practice is unacceptable and raises<br />
serious concerns regarding the integrity<br />
and reliability of the laboratory<br />
analyses conducted by your firm. It<br />
is essential that at least one test be<br />
conducted to verify the identity of<br />
each lot of incoming material. In addition,<br />
the laboratory control records<br />
should include complete documentation<br />
of all raw data generated during<br />
each test, including graphs, charts,<br />
and spectra from laboratory instrumentation.<br />
These records should be<br />
properly identified to demonstrate<br />
that each raw material batch was<br />
tested and met the release specification<br />
before its use in production.<br />
. . . A cursory review of records is<br />
not sufficient to ensure that other<br />
personnel did not manipulate or<br />
inaccurately report test data. It is<br />
interesting to note that after finding<br />
falsification in one analysis, the<br />
agency, quite rightly, casts doubt on<br />
the whole laboratory.<br />
• There was a further citation about<br />
the lack of controls to prevent<br />
manipulation of raw data during<br />
routine analytical testing and how<br />
measures would be put in place to<br />
stop unauthorized changes being<br />
made to data in the future. The<br />
agency wanted to see a process to<br />
prevent omissions in data, but also<br />
for recording any changes made to<br />
existing data, which should include<br />
the date of change, the identity of<br />
the person who made the change,<br />
and an explanation or reason for the<br />
change. All changes to existing data<br />
Handheld and Benchtop<br />
Raman Instruments<br />
for field and Process<br />
applications<br />
Experience the 1064nm<br />
difference today!<br />
Figure: Comparision of Raman 785nm<br />
and 1064nm on micro-algae biofuels<br />
Ideal for:<br />
- Biofuel research<br />
- Crime scene<br />
materials ID<br />
- Homeland<br />
Security<br />
- Medical<br />
diagnostics<br />
- Counterfeit/<br />
Legal Drug ID<br />
- Pharmaceuticals ID<br />
- Biomedical research<br />
- PAT QA/QC/QM<br />
- Meat & Food quality control<br />
- Laboratory chemicals ID<br />
- Real-time chemical bonding<br />
Measure it fast<br />
Measure it accurately<br />
Measure it repeatedly<br />
What do<br />
you need<br />
to measure<br />
today?<br />
Pervasive Spectal Sensing<br />
www.bayspec.com | info@bayspec.com<br />
+1(408)512-5928<br />
Visit booth #8513 at BIOS &<br />
booth #513 at SPIE Photonics West
18 <strong>Spectroscopy</strong> 25(12) December 2010<br />
www.spectroscopyonline.com<br />
should be made in accordance with<br />
an established procedure.<br />
• My last example is recent and cost<br />
a European generic drug manufacturer<br />
a loss of $3.3 million earlier<br />
this year (7). Acino, a Swiss generic<br />
drug manufacturer, contracted<br />
Glochem, an Indian company, to<br />
supply clopidogrel, which is the active<br />
ingredient of Plavix. Following<br />
a visit by European inspectors to<br />
the Indian company, they found<br />
more than 70 original batch records<br />
in a dumpster at the site; all<br />
the records had been rewritten to<br />
be perfect with no errors, in total<br />
contradiction of Good Manufacturing<br />
Practice (GMP). The inspectors,<br />
again quite rightly, classified this as<br />
fraud and this triggered a recall of<br />
the material. In response, the company<br />
thought that the inspector’s<br />
response was excessive and commissioned<br />
an extensive third-party<br />
analysis to demonstrate that the<br />
material met specifications. However,<br />
as the batch records had been<br />
copied and the originals were in the<br />
process of being destroyed, the inspectors<br />
held to their original view.<br />
You can see from these few examples<br />
that by being diligent, honest,<br />
and professional you can avoid the<br />
problems faced by these companies.<br />
The fourth example also illustrates<br />
that if a company outsources to a<br />
third party, the first company is still<br />
accountable for the quality of the material<br />
going into its own supply chain<br />
Proactive auditing will help prevent<br />
these issues.<br />
How Should We Prevent Fraud<br />
and Falsification?<br />
There are a number of ways that we<br />
can avoid the problems of fraud and<br />
falsification. The first is to develop<br />
clear written policies and procedures of<br />
what is expected when work is carried<br />
out in any laboratory; the integrity of<br />
the data generated in the laboratory is<br />
paramount and must not be compromised.<br />
Coupled with this is the need to<br />
provide initial and on-going training<br />
in this area. The training should start<br />
when new spectroscopists join the laboratory<br />
and should continue as part of<br />
their ongoing training over the course<br />
of their careers.<br />
To help training staff we need to<br />
know the basics of laboratory data<br />
integrity. The main criteria are listed<br />
below. Data must be:<br />
• Attributable — Who acquired the<br />
data or performed an action and<br />
when?<br />
• Legible — Can you read the data and<br />
any laboratory notebook entries?<br />
• Contemporaneous — Documented<br />
at the time of the activity.<br />
• Original — A written printout or observation<br />
or a certified copy thereof.<br />
• Accurate — No errors or editing<br />
without documented amendments.<br />
• Complete — All data including any<br />
repeat or reanalysis performed on<br />
the sample.<br />
• Consistent — All elements of the<br />
analysis such as the sequence of<br />
events follow on and are date or time<br />
stamped in the expected sequence.<br />
• Enduring — Not recorded on the<br />
back of envelopes, cigarette packets,<br />
sticky notes, or the sleeves of<br />
a laboratory coat but in laboratory<br />
notebooks or electronic media in<br />
the data systems of instruments and<br />
LIMS.<br />
• Available — Can be accessed for<br />
review and audit or inspection over<br />
the lifetime of the record.<br />
Spectroscopists need to understand<br />
these criteria and apply them in their<br />
respective analytical methods.<br />
To support human work, we should<br />
also provide automation in the form<br />
of integrated laboratory instrumentation<br />
with data handling systems and<br />
LIMS as necessary to perform the<br />
work. In any laboratory this integration<br />
needs to include effective audit<br />
trails to help maintain data integrity<br />
and monitor changes to data. Supervisors<br />
and quality personnel need to<br />
monitor these audit trails to assess the<br />
quality of data being produced in a<br />
laboratory; if necessary a key performance<br />
indicator (KPI) or measurable<br />
metric could be produced. Finally, if<br />
all else fails, disciplinary procedures<br />
need to be in place and should be<br />
used to resolve any problem, because<br />
the reputation of the laboratory is of<br />
prime importance.<br />
Conclusions<br />
In this column I have looked at errors<br />
caused by fat finger moments that are<br />
normal and why we need a second<br />
person to check our data and ensure<br />
that they are correct. These errors<br />
can be reduced by using automation<br />
to transfer data automatically and<br />
eliminate the need for manual entry<br />
of data followed by transcription<br />
error checking. We have also looked<br />
at falsification and fraud with ways<br />
of ensuring that none occur in your<br />
laboratory.<br />
References<br />
(1) A.M. Chambers, J. Elder, and D. St. J.<br />
O’Reilly, Annals Clinical Biochemistry<br />
23, 470–473 (1986).<br />
(2) R. Black, P. Woolman, and J. Kinsella,<br />
presented at American Society of Anaesthesiologists<br />
Annual Meeting, New<br />
Orleans, LA, October 2001.<br />
(3) M. Khoury, L. Burnett, and M.A.<br />
Mackay, The Medical Journal of Australia<br />
165, 128–130 (1996) (http://<br />
www.mja.com.au/).<br />
(4) R.D. McDowall, Quality Assurance<br />
Journal 10, 15–20 (2006).<br />
(5) Ohm Laboratories, Warning Letter<br />
(December 2009).<br />
(6) Xian Libang Pharmaceutical Company,<br />
Warning Letter (January 2010).<br />
(7) J.-F. Tremblay, Chemical & Engineering<br />
News 88(34), 23 (August 23,<br />
2010).<br />
R.D. McDowall<br />
is principal of Mc-<br />
Dowall Consulting<br />
and director of R.D.<br />
McDowall Limited,<br />
and the editor of the<br />
“Questions of Quality”<br />
column for LCGC<br />
Europe, <strong>Spectroscopy</strong>’s sister magazine. Address<br />
correspondence to him at 73 Murray<br />
Avenue, Bromley, Kent, BR1 3DJ, UK.<br />
For more information on<br />
this topic, please visit:<br />
www.spectroscopyonline.com/mcdowall
www.spectroscopyonline.com December 2010 <strong>Spectroscopy</strong> 25(12) 19<br />
<strong>Spectroscopy</strong> Market:<br />
Weathering the Storm and<br />
on the Path to Recovery<br />
The spectroscopy market is expected to rebound from 2009 and surge toward<br />
market-high revenues, with technical developments and product innovation<br />
driving the growth.<br />
Sivakumar Narayanaswamy<br />
After weathering the economic downturn of 2009,<br />
the analytical instrumentation industry’s business<br />
appears to have made a U-turn in 2010, primarily<br />
due to the burgeoning requirements of the life sciences<br />
and pharmaceutical industries and substantial demands<br />
from the chemical and petrochemical industries, in addition<br />
to growing environmental concerns. The analytical<br />
instrumentation industry managed the economic downturn<br />
better than most other industries even though some of its<br />
primary revenue streams, such as the replacement market,<br />
were hurt by procurement postponements.<br />
Competition in the process analytical instrumentation<br />
market is intense, with large conglomerates competing<br />
among themselves and with niche market participants.<br />
With multinational participants accounting for more than<br />
half the revenue shares in this market, consolidation due to<br />
mergers and acquisition is set to further augment competition<br />
among key participants in this mature market. This<br />
results in declining prices affecting market revenues and<br />
vendor profit margins. The market participants should consider<br />
strategies to overcome this challenge in this highly<br />
competitive market by investing in research and development<br />
(R&D). This would result in new product innovations<br />
that could offer greater accuracy and reliability, besides<br />
being price competitive.<br />
The spectroscopy market segment accounts for approximately<br />
35.0% of total analytical instrumentation market<br />
revenues and is currently witnessing significant changes,<br />
with many new product introductions. This helps manufacturers<br />
provide better solutions that meet customer demands.<br />
This sector caters to many specialized applications<br />
across several end-users including chemical and petrochemical,<br />
oil and gas, life sciences (includes pharmaceutical<br />
and biotechnology), food safety, forensics, and so forth.<br />
With numerous technologies present in this market, it can<br />
be broken down into molecular spectroscopy, atomic spectroscopy,<br />
and mass spectrometry markets, with further<br />
classifications in each of them.<br />
The spectroscopy market can also be broadly split into<br />
laboratory and process (online and in-situ) types depending<br />
on the location and usage of these instruments. The<br />
laboratory spectroscopy market is driven by adoption of<br />
these instruments for offline analysis. By combining many<br />
aspects of a laboratory instrument and a process control<br />
instrument, process spectroscopy enables process monitoring<br />
for improved product quality and efficient process control.<br />
At the beginning of the economic recession in 2009,<br />
several end-user industries started emphasizing the need<br />
to increase process throughput and efficiency by reducing<br />
delays in reporting. This need led to an increase in uptake<br />
of process spectroscopy instruments that provide more<br />
comprehensive, precise, and accurate information, faster<br />
than other laboratory instruments.<br />
Mass Spectrometry Market to Lead Recovery<br />
In the molecular spectroscopy market, product sales of<br />
infrared, near-infrared (NIR), and Raman instrumentation<br />
have picked up considerably in 2010, aided by stimulus<br />
packages, academic and research institutions, and<br />
government defense and homeland security spending. In<br />
2009, nuclear magnetic resonance (NMR) spectroscopy,<br />
the largest segment in this molecular spectroscopy mar-
20 <strong>Spectroscopy</strong> 25(12) December 2010<br />
www.spectroscopyonline.com<br />
ket, witnessed a decline in revenues<br />
mainly due to customers refraining<br />
from purchasing this high-cost product.<br />
Historically, revenues from this<br />
segment are mainly attributed to replacement<br />
sales, solely because of its<br />
high installed base population. Ultraviolet–visible<br />
(UV–vis) spectrometers<br />
and Fourier-transform infrared (FT-<br />
IR) spectrometers and other molecular<br />
spectroscopy market segments are<br />
expected to support the growth of this<br />
market in the next few years.<br />
The atomic spectroscopy market is<br />
projected to expand significantly in<br />
the near term due mainly to demand<br />
from the life sciences sector with significant<br />
contribution from the X-ray<br />
diffraction product type. Revenues in<br />
the atomic absorption (AA) spectroscopy<br />
market in 2009 were supported<br />
by strong environmental sector sales,<br />
which balanced the decrease in sales<br />
in the global minerals and <strong>metals</strong> sector<br />
that pulled down market revenues.<br />
Mass spectrometry products contribute<br />
a significant portion of revenues<br />
in the spectroscopy market. In 2010,<br />
revenues were estimated to be $1.8<br />
billion and the market is expected to<br />
grow at a compounded annual growth<br />
rate of 4.0% for the period 2010–2014.<br />
The use of these products in tandem<br />
with chromatographic separation techniques<br />
such as gas chromatography–<br />
mass spectrometry (GC–MS), liquid<br />
chromatography–mass spectrometry<br />
(LC–MS) and ion mobility spectrometry–mass<br />
spectrometry (IMS–MS)<br />
has resulted in their widespread use<br />
due to increased capabilities. These<br />
combination instruments, also referred<br />
to as hyphenated systems, have<br />
shown remarkable growth rates in the<br />
recent past and are expected to grow at<br />
a steady pace. Also, inductively coupled<br />
plasma mass spectrometry (ICP-MS) is<br />
expected to replace inductively coupled<br />
plasma optical emission spectrometry<br />
(ICP-OES) because of its robustness,<br />
linear range, and matrix tolerance.<br />
Into its fourth decade, ICP-MS<br />
serves as a valuable tool in the multielement<br />
analysis that is used in a<br />
wide range of applications, including<br />
metallomics, bioimaging, proteomics,<br />
speciation analysis, and nanoscience<br />
(1). In 2009, underwhelming market<br />
trends hurt revenues in the ICP-MS<br />
market. But since Q3 of 2010, new<br />
product introductions and ICP’s<br />
scope as a replacement product for<br />
other atomic spectroscopy instruments<br />
provided vendors in the ICP<br />
market ample opportunities resulting<br />
in higher revenue earnings in this<br />
product segment. Moreover, its application<br />
in elemental trace analysis and<br />
its higher price/performance ratio, in<br />
addition to its ease-of-use, drive sales<br />
of this product. Also, for its ability<br />
to provide a more detailed elemental<br />
analysis it scores high against AA<br />
spectroscopy, which is a cheaper alternative<br />
but is capable of performing a<br />
more limited elemental analysis.<br />
Because spectroscopic techniques<br />
enable rapid, nondestructive analysis of<br />
samples, the pharmaceutical industry<br />
remains a key end-user. Nondispersive<br />
NIR spectroscopy is ideal for pharmaceutical<br />
tablets as it enables sampling<br />
by volume. As new pharmaceutical<br />
regulations require accurate analysis of<br />
finished pharmaceutical products such<br />
as tablets and capsules, analysts need<br />
spectrometers to verify and analyze<br />
compliance of their products with the<br />
required quantity of active ingredient.<br />
Traditionally, this analysis was performed<br />
with a high performance liquid<br />
chromatography (HPLC) system. Currently,<br />
the NIR spectroscopy technique<br />
is rapidly being used in this industry<br />
due to its implementation flexibility<br />
and accurate analysis capability.<br />
Life Science and Petrochemical<br />
to Boost Revenues<br />
The life science sector was one of the<br />
saviors of the spectroscopy market<br />
in 2009. Constant demand from this<br />
industry cushioned the impact of the<br />
downturn, positioning the spectroscopy<br />
market for a quick recovery as<br />
the economy gradually climbs out of<br />
recession. With support from the two<br />
main sectors within life sciences —<br />
namely pharmaceutical and medical<br />
biotechnology — the spectroscopy<br />
market is likely to witness increased<br />
demand in the next couple years.<br />
The importance of environmental<br />
applications also is growing, as process<br />
spectrometers are increasingly<br />
being used to monitor wastewater and<br />
process water for contaminants. This<br />
increase in demand for process spectrometers<br />
is due to the need to keep<br />
environmental degradation in check<br />
by monitoring effluents and process<br />
and potable water.<br />
Petroleum demand in North America,<br />
particularly in the United States,<br />
continues to increase through 2010<br />
after the economic stagnation in 2009.<br />
With the economy recovering well and<br />
resulting in a positive impact on enduser<br />
industries, especially the chemical<br />
and petrochemical industries, the<br />
increased industrial activity is aiding<br />
in the growth of the analytical instrumentation<br />
market. The spectroscopy<br />
market is expected to gain from this<br />
sector’s improved performance with<br />
an increase in mass spectrometry segment<br />
revenues expected in the next<br />
couple of years.<br />
In 2010, the outlook for the semiconductor<br />
industry looks bright with<br />
industry reports highlighting consistently<br />
increasing sales volumes. This<br />
augurs well for the ICP segment of<br />
the spectrometry market because this<br />
technique typically addresses the sensitivity<br />
factor of measurement, which<br />
is expected to drive growth in the next<br />
couple of years.<br />
An important consumer of AA<br />
spectroscopy products is the mines<br />
and minerals industry, the growth of<br />
which has declined since mid 2008,<br />
hurting spectroscopy revenues from<br />
this industry. Only regional environmental<br />
regulations provided a certain<br />
level of buoyancy for this market,<br />
which reported a growth of 3.2% in<br />
2009. The year 2010, however, witnessed<br />
renewed interest in the minerals<br />
and mines industry, which usually<br />
supports high end products resulting<br />
in increased sales and a higher growth<br />
rate. It is expected that at the turn of<br />
the year the revenues of the AA spectroscopy<br />
market segment will reach<br />
$1.9 billion and would report a growth<br />
rate of 4.5%.<br />
Asia Pacific: The Leading Light<br />
Traditionally, the United States and<br />
Europe along with Japan contribute
www.spectroscopyonline.com December 2010 <strong>Spectroscopy</strong> 25(12) 21<br />
a major part of the revenues of the<br />
total spectroscopy market. In Europe,<br />
the United Kingdom leads in the life<br />
science industry with about 600 and<br />
780 companies in the pharmaceutical<br />
and medical biotechnology sector<br />
that have a combined annual turnover<br />
of around £19.8 billion, which<br />
represents about 4.5% of the global<br />
turnover and 15.7% of the total European<br />
turnover (2). However, even<br />
though several key indicators such<br />
as industrial production and capacity<br />
utilization have shown increasing<br />
trends since the beginning of 2010,<br />
several issues such as the European<br />
debt crisis are likely to affect growth<br />
in the short term.<br />
Asia Pacific is growing the fastest,<br />
with major contributions from China<br />
and India where a huge demand for<br />
spectrometers is generated from<br />
greenfield projects that are being set<br />
up in various end-user industries.<br />
The region’s life science industry is<br />
robust and is expected to contribute<br />
hugely to spectroscopy market growth<br />
in the coming years.<br />
Consolidation to Determine the<br />
Leader<br />
The public and private funding bodies<br />
in the European Union support<br />
investments in clinical and molecular<br />
research resulting in the continued<br />
growth of this market over the next<br />
couple of years. This is likely to result<br />
in steady growth for the spectroscopy<br />
market. The technique’s capability to<br />
analyze proteins and metabolites results<br />
in the increased usage of spectrometers<br />
in the fields of medical research<br />
and clinical diagnostics and is<br />
likely to be complemented by the rapid<br />
implementation of this technique in<br />
the medical field.<br />
LC–MS instruments are widely<br />
used in pharmaceutical manufacturing<br />
processes, including process<br />
development research, manufacturing,<br />
and quality control. These instruments<br />
rode out the wave of the<br />
pharmaceutical industry’s slower<br />
performance in 2009, following which<br />
2010 has been a better year. Besides<br />
pharmaceutical applications, these<br />
instruments are also applied in biotechnology,<br />
food safety, chemical,<br />
petrochemical, forensics, homeland<br />
security, environmental, academic,<br />
and government markets.<br />
Consolidation in this market is<br />
not as vigorous as in the overall<br />
analytical instrumentation market,<br />
although Bruker’s acquisition of the<br />
laboratory GC, GC–MS-MS, and<br />
ICP-MS product lines of Varian Inc.<br />
in 2010 enabled Bruker to expand<br />
its mass spectrometry portfolio into<br />
the chemical analysis markets. In the<br />
short and medium terms such inorganic<br />
growth options are likely to<br />
lead to more market consolidation.<br />
In particular, the pharmaceutical<br />
industry’s process analytical technology<br />
(PAT) initiative, global green<br />
environment initiatives supported<br />
by regional regulations and demand<br />
from the chemical and petrochemical<br />
industries are likely to drive the demand<br />
for process spectroscopy instruments<br />
over the next couple of years.<br />
Another growth area in the spectroscopy<br />
market is the handheld or<br />
the portable type. This reflects the<br />
trend toward miniaturization in all<br />
products in all industrial products.<br />
Innovative Market Participants<br />
to Succeed<br />
The spectroscopy market is mainly<br />
technology oriented and the market<br />
rankings of market participants are<br />
likely to be governed by the innovations<br />
and annual R&D allocations<br />
made each year. New product introductions<br />
have occurred even during<br />
the economic recession as many of<br />
the participants spend considerable<br />
amounts of money on R&D activities.<br />
Some of the key participants in this<br />
market include Agilent Technologies<br />
Inc., Applied Biosystems Group,<br />
Bruker Daltonics Inc., JEOL Ltd.,<br />
PerkinElmer Inc., Shimadzu Corporation,<br />
Thermo Fisher Scientific, and<br />
Waters Corporation. Most of these<br />
participants are headquartered in<br />
the United States or Europe and have<br />
sales and marketing operations in<br />
Asia Pacific and rest-of-world (RoW)<br />
regions.<br />
With higher demand in the developing<br />
countries in Asia Pacific and<br />
RoW regions, the vendors in this<br />
market are already strengthening<br />
their presence in these regions with<br />
improved distribution networks in<br />
addition to setting up manufacturing<br />
units, which is likely to result<br />
in long-term returns beyond 2010.<br />
For example, in 2010, Agilent Technologies<br />
started manufacturing mass<br />
spectrometer products in Singapore<br />
to increase its focus in this region.<br />
Conclusion<br />
The current economic environment<br />
promises to aid growth across most<br />
end-user industries in the spectroscopy<br />
market. In 2010 and beyond, it is<br />
expected that this market will recover<br />
from the dip witnessed in 2009 and<br />
surge toward market high revenues.<br />
Technical developments and product<br />
innovation are expected to drive<br />
the market along the growth curve.<br />
The molecular spectroscopy and mass<br />
spectrometry markets are expected to<br />
witness higher growth rates and improve<br />
their share in the process analytical<br />
instrumentation market.<br />
With many pharmaceutical and<br />
biotechnology companies relocating<br />
their manufacturing and R&D activities<br />
to China and India, these two<br />
growth engines of Asia are poised to<br />
improve their contributions. The next<br />
few years will see Asia Pacific emerging<br />
as significant markets for spectroscopy<br />
products.<br />
References<br />
(1) C. Engelhard, Anal. Bioanal. Chem.<br />
(epub ahead of print, October 29,<br />
2010).<br />
(2) Life Science 2010: Delivering the Blueprint,<br />
Department of Business, Innovation<br />
and Skills, UK (January 2010).<br />
Sivakumar Narayanaswamy is<br />
an Industry Analyst for Frost & Sullivan’s<br />
Measurement & Instrumentation Group.<br />
For more information on this topic,<br />
please visit our homepage at:<br />
www.spectroscopymag.com
22 <strong>Spectroscopy</strong> 25(12) December 2010<br />
www.spectroscopyonline.com<br />
May 2010 Volume 25 Number 5 www.spectroscopyonline.com<br />
November 2010 Volume 25 Number 11 www.spectroscopyonline.com<br />
e 25 Number 6 www.spectroscopyonline.com<br />
Volume 25, 2010<br />
0 Volume 25 Number 11<br />
spectroscop<br />
opyon<br />
2010 Editorial Index<br />
AUTHORS<br />
A<br />
Adar, Fran. “Analysis of Lignin and Cellulose in Biological<br />
Energy Sources by Raman Microscopy,” in<br />
Molecular <strong>Spectroscopy</strong> Workbench. February, p. 18.<br />
Adar, Fran. “Depth Resolution of the Raman Microscope:<br />
Optical Limitations and Sample Characteristics,”<br />
in Molecular <strong>Spectroscopy</strong> Workbench.<br />
March, p. 16.<br />
Adar, Fran. “Thoughts About ICORS 2010 and Where<br />
Raman <strong>Spectroscopy</strong> Is Headed,” in Molecular <strong>Spectroscopy</strong><br />
Workbench. October, p. 16.<br />
Adjei-Bekoe, Gloria. See Martin, John E.<br />
Ahn, Joomi; Ivleva, Vera; Skilton, St John; and Yu,<br />
Yingqing. Branching Out: Mass Spectrometry and<br />
the Shape of Biotherapeutics. Current Trends in Mass<br />
Spectrometry, May, p. 28.<br />
Akao, Ken-ichi. See Larsen, Richard A.<br />
Almeida, Manuel; Rury, Maura; Condon, John; and<br />
Brown, Peter. Determination of Trace Elements<br />
in Over-the-Counter Cough Syrup by Inductively<br />
Coupled Plasma–Optical Emission <strong>Spectroscopy</strong>. Applications<br />
of ICP & ICP-MS Techniques for Today’s<br />
Spectroscopists, November, p. 12.<br />
Anderson Smith, Lea L. See Martin, John E.<br />
Atkins, Patricia; Ernyei, Laszlo; Sivakumar, Vanaja;<br />
and Obenauf, Ralph. A Common Sense Laboratory<br />
Guide to Reducing Errors and Contamination in<br />
ICP and ICP-MS Analysis. Applications of ICP &<br />
ICP-MS Techniques for Today’s Spectroscopists,<br />
November, p. 42.<br />
B<br />
Ball, David W. “Group Theory and Symmetry, Part II:<br />
Groups,” in The Baseline. January, p. 18.<br />
Ball, David W. “Group Theory and Symmetry, Part III:<br />
Representations and Character Tables,” in The Baseline.<br />
April, p. 16.<br />
Ball, David W. “Group Theory and Symmetry, Part IV:<br />
Great or Grand, We’ve Got GOT,” in The Baseline.<br />
September, p. 18.<br />
Ball, David W. “Happy Sesquicentennial, <strong>Spectroscopy</strong>,”<br />
in The Baseline. June, p. 16.<br />
Ball, David. “Neutron <strong>Spectroscopy</strong>,” in The Baseline.<br />
December, p. 12.<br />
Baum, Andreas; Lu, Yao; Muccio, Zeland; Jackson,<br />
Glen P.; and Harrington, Peter B. Differentiation Between<br />
Origins of Extra Virgin Olive Oils by GC–C-<br />
IRMS Using Principal Component Analysis, Linear<br />
Discriminant Analysis, and Hierarchical Cluster<br />
Analysis. February, p. 40.<br />
Begley, Benjamin. See Thakur, Rohan A.<br />
Bettmer, Jörg. See Hamester, Meike.<br />
Binkley, Joe; and Libarondi, Mark. Comparing the Capabilities<br />
of Time-of-Flight and Quadrupole Mass<br />
Spectrometers. Current Trends in Mass Spectrometry,<br />
July, p. 28.<br />
Boquet, Don. See Rodgers, James.<br />
Bowerbank, Christopher R. See Lee, Edgar D.<br />
Bradley, Mike; and Hirsch, Jeffrey. Improved FT-IR<br />
Instrumentation and Software for Complete Confidence<br />
in QA/QC Testing. FT-IR Technology for<br />
Today’s Spectroscopists, August, p. 24.<br />
Briggs, Jenni L. Hollow Waveguides: The Next Generation<br />
of Mid-IR Remote Sampling Accessories.<br />
FT-IR Technology for Today’s Spectroscopists, August,<br />
p. 36.<br />
Brown, Christopher D. See Green, Robert L.<br />
Brown, Peter. See Almeida, Manuel.<br />
Brown, Steve. See Mark, Howard.<br />
Buckley, Steve. See Eichenholz, Jason.
www.spectroscopyonline.com December 2010 <strong>Spectroscopy</strong> 25(12) 23<br />
Bukowski, Nick. TOF-MS: A Viable<br />
Solution for Crude Oil Extract<br />
Analysis. Current Trends in Mass<br />
Spectrometry, May, p. 22.<br />
Busch, Kenneth L. “A Random Walk<br />
Through the Web of Mass Spectrometry,”<br />
in Mass Spectrometry<br />
Forum. March, p. 24.<br />
Busch, Kenneth L. “Derivatization<br />
in Mass Spectrometry,” in Mass<br />
Spectrometry Forum. November,<br />
p. 18.<br />
Busch, Kenneth L. “Ion Burn and<br />
the Dirt of Mass Spectrometry,”<br />
in Mass Spectrometry Forum.<br />
September, p. 32.<br />
Busch, Kenneth L. “Mass Spectral<br />
Libraries: The Next Generation,”<br />
in Mass Spectrometry Forum.<br />
January, p. 24.<br />
Busch, Kenneth L. “Mass Spectrometry–Mass<br />
Spectrometry Retrospective,”<br />
in Mass Spectrometry<br />
Forum. July, p. 14.<br />
C<br />
Cassap, Matthew. Using ICP-OES<br />
for Accurate Monitoring of Metallic<br />
Contaminants in Water<br />
According to U.S. EPA Method<br />
200.7. May, p. 64.<br />
Chang, James S. See Zhang, Allen.<br />
Christesen, Steven D. See Emmons,<br />
Erik D.<br />
Churley, Melissa. See Macherone,<br />
Anthony.<br />
Clawson, Ernest. See Rodgers,<br />
James.<br />
Cognard, Emmanuelle. See Jenkins,<br />
Tim J.<br />
Condon, John. See Almeida, Manuel.<br />
Countryman, Sky. See Sanchez, Carl.<br />
Coutinho, Carlos Augusto. See<br />
Thomsen, Volker.<br />
Cui, Xiaoliang. See Rodgers, James.<br />
Curtis, Matthew. See Sparkman, O.<br />
David.<br />
D<br />
David, Frank. See Vanhoenacker,<br />
Gerd.<br />
Davidonis, Gayle. See Rodgers,<br />
James.<br />
Dey, Dipankar. See Taday, Philip F.<br />
Dickson, Hazel. “Atomic Absorption:<br />
Feeding the Food Safety Market,” in<br />
Atomic Perspectives. July, p. 26.<br />
Dieing, T. See Schmidt, U.<br />
Dodds, Walter K. See Murdock,<br />
Justin N.<br />
Dong, Dahai. See Thakur, Rohan A.<br />
Dowd, Mick. See Hirsch, Jeffrey.<br />
Drapcho, David; Zlatkin, Igor; Inscore,<br />
Frank; Shende, Chetan;<br />
Sengupta, Atanu; Huang,<br />
Hermes; and Farquharson, Stuart.<br />
High-Throughput Trace Analysis<br />
Using SERS-Active Microtiter<br />
Plates with a Raman Plate Reader.<br />
Raman Technology for Today’s<br />
Spectroscopists, June, p. 42.<br />
E<br />
Eichenholz, Jason; Kaye, Kevin;<br />
and Buckley, Steve. Laser-Based<br />
Technologies Target Terrorists.<br />
Defense and Homeland Security,<br />
April, p. 26.<br />
Emmons, Erik D.; Tripathi, Ashish;<br />
Guicheteau, Jason A.; Christesen,<br />
Steven D.; and Fountain III, Augustus<br />
W. Raman Chemical Imaging<br />
of Explosive Contaminated<br />
Fingerprints for Forensic Applications.<br />
Defense and Homeland<br />
Security, April, p. 8.<br />
Ernyei, Laszlo. See Atkins, Patricia.<br />
Evans, Christopher A. See Plumb,<br />
Robert S.<br />
Evans, Megan. 58th ASMS Conference<br />
Review. Current Trends in<br />
Mass Spectrometry, July, p. 44.<br />
Evans, Megan. 2010 Salary Survey:<br />
A Year of Pluses and Minuses.<br />
March, p. 36.<br />
Evans, Michael. See Taday, Philip F.<br />
F<br />
Fahrenholz, Timothy M. See Rahman,<br />
G.M. Mizanur.<br />
Farquharson, Stuart. See Drapcho,<br />
David.<br />
Ferguson, Jim. See Ghobarah, Hesham.<br />
Fortier, Chanel. See Rodgers, James.<br />
Fountain III, Augustus W. See Emmons,<br />
Erik D.<br />
G<br />
Gerhards, Petra; Schanen, Pierre;<br />
and Horner, Gerhard. Using<br />
Novel TOF-MS to Increase Sensitivity<br />
and Confidently Detect<br />
Drugs of Abuse in Urine. Current<br />
EQUIPMENT FOR<br />
QuEChERS<br />
KNIFE MILLS<br />
GRINDOMIX GM 300/200<br />
■ Perfect, rapid homogenization of<br />
samples with and without dry ice<br />
■ Autoclavable grinding tools<br />
www.retsch-us.com/gm300<br />
SAMPLE DIVIDER<br />
PT 100<br />
■ Convenient, precise<br />
preparation of salt<br />
mix for purification<br />
■ Up to 10 samples<br />
at a time<br />
www.retsch-us.com/pt100<br />
MIXER MILL MM 400<br />
■ Efficient, reproducible fine grinding<br />
of sample/salt mix prior to HPLC<br />
www.retsch-us.com/mm400<br />
www.retsch-us.com/superheroes<br />
1-866-4-RETSCH
24 <strong>Spectroscopy</strong> 25(12) December 2010<br />
www.spectroscopyonline.com<br />
Trends in Mass Spectrometry, October,<br />
p. 18.<br />
Ghobarah, Hesham; Ramagiri,<br />
Suma; and Ferguson, Jim. Increasing<br />
Productivity of ADME<br />
Studies Using Accurate Mass<br />
Technology. Current Trends in<br />
Mass Spectrometry, October, p.<br />
39.<br />
Goshawk, Jeff. See Yu, Kate.<br />
Green, Robert L.; Hargreaves, Michael<br />
D.; and Brown, Christopher<br />
D. Handheld FT-IR and Raman<br />
as Tools in the Analysis of Improvised<br />
Explosive Materials.<br />
Defense and Homeland Security,<br />
April, p. 14.<br />
Gu, Christine. See Zhang, Allen.<br />
Gu, Ming. Enhancing Mass Spectral<br />
Formula Determination by<br />
Heuristic Rules. Current Trends<br />
in Mass Spectrometry, May, p. 42.<br />
Gudihal, Ravindra. See Waddell,<br />
Keith.<br />
Guicheteau, Jason A. See Emmons,<br />
Erik D.<br />
Gygi, Steven P. Phosphorylation Site<br />
Localization Using Probability-<br />
Based Scoring. Current Trends<br />
in Mass Spectrometry, October,<br />
p. 28.<br />
H<br />
Hamester, Meike; McSheehy, Shona;<br />
Kutscher, Daniel J.; Konz, Tobias;<br />
and Bettmer, Jörg. Reliable<br />
and Efficient Sulfur Detection in<br />
Proteins Using ICP-MS with Capillary<br />
LC. Current Trends in Mass<br />
Spectrometry, October, p. 21.<br />
Hancock, Peter. See Jenkins, Tim J.<br />
Hargreaves, Michael D. See Green,<br />
Robert L.<br />
Harrington, Peter B. See Baum, Andreas.<br />
Heim, John; and Staples, Doug.<br />
Using Comprehensive GC×GC–<br />
TOF-MS for Enhanced Detection<br />
and Separation in Antidoping<br />
Control Screening. Current<br />
Trends in Mass Spectrometry,<br />
May, p. 16.<br />
Heim, John. Analyzing Small Molecule<br />
Metabolite Profiles of<br />
Diabetic and Nondiabetic Urine<br />
Samples Using GC×GC–TOF-<br />
MS and Statistical Software as a<br />
Data Mining Strategy. Current<br />
Trends in Mass Spectrometry,<br />
March, p. 30.<br />
Hinrichs, Joachim. See Oki, Tomoko.<br />
Hirsch, Jeffrey; Lowry, Steven R.;<br />
and Dowd, Mick. X-Ray Fluorescence<br />
and FT-IR Identification<br />
of Strontium and Carbonate in<br />
Domestic and Imported Gypsum<br />
Drywall. July, p. 30.<br />
Hirsch, Jeffrey. See Bradley, Mike.<br />
Hollricher, O. See Schmidt, U.<br />
Horner, Gerhard. See Gerhards,<br />
Petra.<br />
Huang, Hermes. See Drapcho,<br />
David.<br />
Hwang, J. David. See Rahman, G.M.<br />
Mizanur.<br />
I<br />
Inscore, Frank. See Drapcho, David.<br />
Ivleva, Vera. See Ahn, Joomi.<br />
J<br />
Jackson, Glen P. See Baum, Andreas.<br />
Jauss, A. See Schmidt, U.<br />
Jenkins, Tim J.; Worrall, Keith;<br />
Hancock, Peter; Morphet, James;<br />
Cognard, Emmanuelle; and Ortelli,<br />
Didier. Advancing TOF-MS–<br />
Based Screening for Food Safety<br />
Residue Analysis with a Positive<br />
Approach. Current Trends in<br />
Mass Spectrometry, March, p. 25.<br />
Jones, Patrick R. See Sparkman, O.<br />
David.<br />
Ju, June-Sik. See Kim, Seung-Hyun.<br />
K<br />
Kang, Sho Yeung. See Rodgers,<br />
James.<br />
Kaufmann, Ken. “CMOS Technology<br />
for Scientific Imaging,” in Laser<br />
and Optics Interface. July, p. 20.<br />
Kaye, Kevin. See Eichenholz, Jason.<br />
Kim, Ho-Dong. See Kim, Seung-<br />
Hyun.<br />
Kim, Seung-Hyun; Ju, June-Sik;<br />
Shin, Hee-Sung; Kim, Ho-Dong;<br />
and Yee, Ki-Ju. A Quantitative<br />
Analysis of Neodymium and<br />
Samarium at Low Pressure by<br />
Laser-Induced Breakdown <strong>Spectroscopy</strong>.<br />
November, p. 38.<br />
Kingston, H.M. Skip. See Rahman,<br />
G. M. Mizanur.<br />
Koerner, Philip J. See Sanchez, Carl.<br />
Koetzner, Lee. See Thakur, Rohan A.<br />
Koleto, Michael. See Thakur,<br />
Rohan A.<br />
Konz, Tobias. See Hamester, Meike.<br />
Koshoubu, Jun. See Larsen,<br />
Richard A.<br />
Kutscher, Daniel J. See Hamester,<br />
Meike.<br />
L<br />
Larsen, Richard A.; Akao, Ken-ichi;<br />
Koshoubu, Jun; and Sugiyama,<br />
Hiroshi. Using FT-IR Microscope<br />
ATR Objectives to Resolve Complex<br />
Samples. FT-IR Technology<br />
for Today’s Spectroscopists, August,<br />
p. 42.<br />
Later, Douglas W. See Lee, Edgar D.<br />
Lee, Edgar D.; Smith, Philip A.;<br />
Bowerbank, Christopher R.; and<br />
Later, Douglas W. Rapid Chemical<br />
Threat Identification by<br />
SPME-GC–TMS. Defense and<br />
Homeland Security, April, p. 30.<br />
Lee, Eunah; and Adar, Fran. Transmission<br />
Raman: A Method for<br />
Quantifying Bulk Materials.<br />
Raman Technology for Today’s<br />
Spectroscopists, June, p. 6.<br />
Leona, Marco. See Tague Jr., Thomas<br />
J.<br />
Li, Yaping; Li, Qingbo; and Zhang,<br />
Guangjun. Near-Infrared Spectrophotometric<br />
Analysis of<br />
Human Blood Glucose: Influence<br />
of Repeating Errors on Prediction<br />
Accuracy. June, p. 46.<br />
Libarondi, Mark. See Binkley, Joe.<br />
Lindemann, Torsten. See Oki, Tomoko.<br />
Litchfield, David W. See Zhang,<br />
Cunjie.<br />
Lowry, Steven R. See Hirsch, Jeffrey.<br />
Lu, Yao. See Baum, Andreas.<br />
M<br />
Macherone, Anthony; Churley,<br />
Melissa; and White, Robert. Ultralow<br />
Detection of Estrogenic<br />
Compounds by GC–NCI-MS-MS.<br />
Current Trends in Mass Spectrometry,<br />
May, p. 10.<br />
Macho, Jorge. Low-Resolution<br />
Raman <strong>Spectroscopy</strong> in Science<br />
Education. Raman Technology<br />
for Today’s Spectroscopists,<br />
June, p. 12.
www.spectroscopyonline.com December 2010 <strong>Spectroscopy</strong> 25(12) 25<br />
MacRae, Michael. <strong>Spectroscopy</strong><br />
Uncensored: An Insider’s Story<br />
of the First 15 Years. June, p. 26.<br />
Magarini, Riccardo. Trace Elemental<br />
Determination in Residual<br />
Fuel Oils Using ICP-MS. Applications<br />
of ICP & ICP-MS Techniques<br />
for Today’s Spectroscopists,<br />
November, p. 30.<br />
Mark, Howard; and Brown, Steve.<br />
Milestones in <strong>Spectroscopy</strong>. June,<br />
p. 34.<br />
Mark, Howard; and Workman, Jerome.<br />
“Classical Least Squares,<br />
Part I: Mathematical Theory,” in<br />
Chemometrics in <strong>Spectroscopy</strong>.<br />
May, p. 16.<br />
Mark, Howard; and Workman, Jerome.<br />
“Classical Least Squares,<br />
Part II: Mathematical Theory<br />
Continued,” in Chemometrics in<br />
<strong>Spectroscopy</strong>. June, p. 20.<br />
Mark, Howard; and Workman, Jerome.<br />
“Classical Least Squares,<br />
Part III: Spectroscopic Theory,”<br />
in Chemometrics in <strong>Spectroscopy</strong>.<br />
October, p. 22.<br />
Mark, Howard. Pittcon 2010 New<br />
Product Review. May, p. 32.<br />
Martin, John E.; Anderson Smith,<br />
Lea L.; Adjei-Bekoe, Gloria; and<br />
Thomas, Robert. Comparison<br />
of Different Sample Preparation<br />
Procedures for the Determination<br />
of RoHS/WEEE Regulated Elements<br />
in Printed Circuit Boards<br />
and Electrical Components by<br />
EDXRF. April, p. 40.<br />
McCurdy, Ed; Sugiyama, Naoki; and<br />
Wilbur, Steven M. Optimizing<br />
Performance for a Collision/Reaction<br />
Cell ICP-MS System Operating<br />
in Helium Collision Mode.<br />
Applications of ICP & ICP-MS<br />
Techniques for Today’s Spectroscopists,<br />
November, p. 20.<br />
McCurdy, Ed. See Wilbur, Steven M.<br />
McDonald, Stephen. See Yu, Kate.<br />
McDowall, R.D. “Dear Esteemed<br />
Vendor?” in Focus on Quality.<br />
September, p. 22.<br />
McDowall, R.D. “Fat Finger, Falsification,<br />
or Fraud?” in Focus on<br />
Quality. December, p. 15.<br />
McDowall, R.D. “Understanding<br />
and Interpreting the GAMP 5<br />
Life Cycle Models for Software,”<br />
in Focus on Quality. April, p. 22.<br />
McDowall, R.D. “Where Are We<br />
Now with USP ?” in Focus<br />
on Quality. November, p. 24.<br />
McGinley, Michael; and Sanchez,<br />
Carl. Development of a High-<br />
Throughput LC–MS Assay for<br />
Drugs of Abuse from Biological<br />
Matrices. Current Trends in Mass<br />
Spectrometry, October, p. 24.<br />
McGinley, Michael; and Sanchez,<br />
Carl. Translating HPLC Performance<br />
Gains of Core-Shell Media<br />
to LC–MS Applications. Current<br />
Trends in Mass Spectrometry,<br />
May, p. 36.<br />
McSheehy, Shona. See Hamester,<br />
Meike.<br />
Millar, Alan. See Yu, Kate.<br />
Morphet, James. See Jenkins, Tim J.<br />
Morris, Robert. “How Optical Advances<br />
Helped Deliver the Promise<br />
of Miniature Spectrometers,”<br />
in Laser and Optics Interface.<br />
January, p. 30.<br />
Muccio, Zeland. See Baum, Andreas.<br />
Murdock, Justin N.; Dodds, Walter<br />
K.; Reffner, John A.; and Wetzel,<br />
David L. Measuring Cellular-<br />
Scale Nutrient Distribution in<br />
Algal Biofilms with Synchrotron<br />
Confocal Infrared Microspectroscopy.<br />
October, p. 32.<br />
Murphy, Brian. See Yu, Kate.<br />
N<br />
Narayanaswamy, Sivakumar. <strong>Spectroscopy</strong><br />
Market: Weathering the<br />
Storm and on the Path to Recovery.<br />
December, p. 19.<br />
Neubauer, Kenneth. “Reducing the<br />
Effects of Interferences in Quadrupole<br />
ICP-MS,” in Atomic Perspectives.<br />
November, p. 30.<br />
O<br />
Obenauf, Ralph. See Atkins, Patricia.<br />
Oki, Tomoko; Wills, Julian D.;<br />
McSheehy, Shona; Hamester,<br />
Meike; Lindemann, Torsten;<br />
and Hinrichs, Joachim. Direct,<br />
Automated Analysis of Organic<br />
Solvents Using Quadrupole ICP-<br />
MS Coupled with a Dual Syringe<br />
Pump Sample System. Applications<br />
of ICP & ICP-MS Techniques<br />
for Today’s Spectroscopists, November,<br />
p. 6.<br />
Oppermann, Uwe; and Schram, Jürgen.<br />
Interference-Free Drinking<br />
Water Analysis Using ICP-OES.<br />
Applications of ICP & ICP-MS<br />
Techniques for Today’s Spectroscopists,<br />
November, p. 36.<br />
Ortelli, Didier. See Jenkins, Tim J.<br />
P<br />
Pace, Nadia. See Schreiber, André.<br />
Pamuku, Matt. See Rahman, G. M.<br />
Mizanur.<br />
Pettigrew, William. See Rodgers,<br />
James.<br />
Plumb, Robert S.; Rainville, Paul<br />
D.; and Evans, Christopher A.<br />
Bioanalysis Using Dried Blood<br />
Spots: The Biggest Advancement<br />
in Bioanalysis Since LC–MS-MS?<br />
Current Trends in Mass Spectrometry,<br />
July, p. 22.<br />
R<br />
Rahman, G.M. Mizanur; Fahrenholz,<br />
Timothy M.; Kingston, H.<br />
M. Skip; Pamuku, Matt; Hwang,<br />
J. David; and Young, Lyman A.<br />
Speciation of Mercury in Crude<br />
Oil Using Speciated Isotope Dilution<br />
Mass Spectrometry. January,<br />
p. 36.<br />
Rainville, Paul D. See Plumb, Robert<br />
S.<br />
Ramagiri, Suma. See Ghobarah,<br />
Hesham.<br />
Reffner, John A. See Murdock, Justin N.<br />
Reffner, John; Smith, Shay; and<br />
Adar, Fran. Characterizing Colored<br />
Fibers by FT-IR and Raman<br />
<strong>Spectroscopy</strong>. FT-IR Technology<br />
for Today’s Spectroscopists, August,<br />
p. 6.<br />
Roberts, Gareth M. The Use of Novel<br />
Software for the Identification of<br />
Trace Compounds in Complex<br />
Mixtures. Current Trends in Mass<br />
Spectrometry, July, p. 16.<br />
Rodgers, James; Kang, Sho Yeung; Fortier,<br />
Chanel; Cui, Xiaoliang; Davidonis,<br />
Gayle; Clawson, Ernest; Boquet,<br />
Don; and Pettigrew, William.<br />
Preliminary Field Measurement of<br />
Cotton Fiber Micronaire by Portable<br />
NIR. September, p. 38.<br />
Rury, Maura. See Almeida, Manuel.
26 <strong>Spectroscopy</strong> 25(12) December 2010<br />
Y<br />
Yee, Ki-Ju. See Kim, Seung-Hyun.<br />
Yeung, Ken K.-C. See Zhang, Cunjie.<br />
Young, Lyman A. See Rahman, G.<br />
M. Mizanur.<br />
Yu, Kate; Millar, Alan; Shion, Henry;<br />
McDonald, Stephen; Goshawk,<br />
Jeff; and Murphy, Brian. Qualitative<br />
and Quantitative Metabowww.spectroscopyonline.com<br />
S<br />
Sanchez, Carl; Koerner, Philip J.;<br />
and Countryman, Sky. Development<br />
of a High-Throughput LC–<br />
MS-MS Assay for 13 Commonly<br />
Prescribed Pain Management<br />
Drugs from Urine with Cleanup<br />
Using Solid-Phase Extraction.<br />
Current Trends in Mass Spectrometry,<br />
July, p. 34.<br />
Sanchez, Carl. See McGinley, Michael.<br />
Sanders, Mark. See Zhang, Allen.<br />
Sandra, Pat. See Vanhoenacker,<br />
Gerd.<br />
Schanen, Pierre. See Gerhards,<br />
Petra.<br />
Schmid, Lawrence S. <strong>Spectroscopy</strong><br />
Bounces Back. March, p. 40.<br />
Schmidt, U.; Jauss, A.; Dieing, T.;<br />
and Hollricher, O. Confocal<br />
Raman AFM Imaging of Paper.<br />
Raman Technology for Today’s<br />
Spectroscopists, June, p. 32.<br />
Schram, Jürgen. See Oppermann,<br />
Uwe.<br />
Schreiber, André; and Pace, Nadia.<br />
LC–MS-MS–Based Strategies for<br />
the Targeted and Nontargeted<br />
Screening of Contaminants<br />
in Food, Environmental, and<br />
Forensic Samples. Current Trends<br />
in Mass Spectrometry, March,<br />
p. 34.<br />
Sengupta, Atanu. See Drapcho,<br />
David.<br />
Shen, Yaochun. See Taday, Philip F.<br />
Shende, Chetan. See Drapcho,<br />
David.<br />
Shin, Hee-Sung. See Kim, Seung-<br />
Hyun.<br />
Shion, Henry. See Yu, Kate.<br />
Sivakumar, Vanaja. See Atkins, Patricia.<br />
Skilton, St John. See Ahn, Joomi.<br />
Smith, Philip A. See Lee, Edgar D.<br />
Smith, Shay. See Reffner, John.<br />
Sparkman, O. David; Curtis, Matthew;<br />
and Jones, Patrick R. Interaction<br />
of Dichloromethane<br />
Solvent with n-Alkylamines<br />
Analyzed by Electron Ionization<br />
GC–MS. Current Trends in Mass<br />
Spectrometry, March, p. 8.<br />
Staples, Doug. See Heim, John.<br />
Stevens, Joan; and Szelewski, Mike.<br />
Meeting the Surge in Demand for<br />
Seafood Screening on the Gulf<br />
Coast. Current Trends in Mass<br />
Spectrometry, October, p. 8.<br />
Sugiyama, Hiroshi. See Larsen,<br />
Richard A.<br />
Sugiyama, Naoki. See McCurdy, Ed.<br />
Szelewski, Mike. See Stevens, Joan.<br />
T<br />
Taday, Philip F.; Evans, Michael;<br />
Zeitler, Axel; Shen, Yaochun; and<br />
Dey, Dipankar. “Terahertz Technology:<br />
Moving from the Laboratory<br />
into the Process World,”<br />
in Laser and Optics Interface.<br />
April, p. 32.<br />
Tague Jr., Thomas J.; Leona, Marco;<br />
and Wang, Peng. Raman <strong>Spectroscopy</strong><br />
of Documents. Defense<br />
and Homeland Security, April,<br />
p. 20.<br />
Thakur, Rohan A.; Koleto, Michael;<br />
Dong, Dahai; Begley, Benjamin;<br />
and Koetzner, Lee. Dried Blood<br />
Spots and High-Resolution Mass<br />
Spectrometry for Discovery Fast<br />
PK Bioanalysis. Current Trends<br />
in Mass Spectrometry, October,<br />
p. 14.<br />
Thakur, Rohan. A Study of Matrix<br />
Effects on Multiply Charged<br />
Compounds. Current Trends in<br />
Mass Spectrometry, March, p. 21.<br />
Thomas, Robert. See Martin, John E.<br />
Thomsen, Volker; and Coutinho,<br />
Carlos Augusto. “Electron Transitions<br />
in Optical Emission and<br />
X-Ray Fluorescence Spectrometry,”<br />
in Atomic Perspectives.<br />
March, p. 30.<br />
Thomsen, Volker; and Coutinho,<br />
Carlos Augusto. Spectrometers<br />
for Elemental Spectrochemical<br />
Analysis, Part II: X-Ray Fluorescence<br />
Spectrometers. July, p. 38.<br />
Thomsen, Volker. Assessing Accuracy.<br />
February, p. 32.<br />
Thomsen, Volker. Spectrometers<br />
for Elemental Analysis, Part I:<br />
The Basic Spectrometer. January,<br />
p. 46.<br />
Thomsen, Volker. Spectrometers<br />
for Elemental Spectrochemical<br />
Analysis, Part III: Arc/Spark<br />
Optical Emission Spectrometers.<br />
October, p. 42.<br />
Tripathi, Ashish. See Emmons, Erik D.<br />
Tsuchibuchi, Tsuyoshi. Handling<br />
Spectra from FT-IR Foreign Matter<br />
Analysis. FT-IR Technology for<br />
Today’s Spectroscopists, August,<br />
p. 16.<br />
V<br />
Vanhoenacker, Gerd; David, Frank;<br />
and Sandra, Pat. Ultralow Quantification<br />
of Pesticides in Baby<br />
Food. Current Trends in Mass<br />
Spectrometry, July, p. 10.<br />
W<br />
Waddell, Keith; and Gudihal, Ravindra.<br />
Comprehensive Characterization<br />
of Monoclonal Antibodies<br />
Using a Microfluidic Chip-Q-<br />
TOF Platform. Current Trends in<br />
Mass Spectrometry, March, p. 15.<br />
Walsh, David. <strong>Spectroscopy</strong> Moves<br />
into the Digital Age. June, p. 42.<br />
Wang, Peng. See Tague Jr., Thomas J.<br />
Wetzel, David L. See Murdock,<br />
Justin N.<br />
White, Robert. See Macherone,<br />
Anthony.<br />
Wieboldt, Dick. Understanding<br />
Raman Spectrometer Parameters.<br />
Raman Technology for Today’s<br />
Spectroscopists, June, p. 20.<br />
Wilbur, Steven; and McCurdy, Ed.<br />
“Using Qualifier Ions to Validate<br />
Multielement ICP-MS Data<br />
in Complex Samples,” in Atomic<br />
Perspectives. May, p. 22.<br />
Wilbur, Steven M. See McCurdy, Ed.<br />
Wills, Julian D. See Oki, Tomoko.<br />
Workman, Jerome; and Mark, Howard.<br />
“Statistics and Chemometrics<br />
for Clinical Data Reporting,<br />
Part III: Using Excel for Data<br />
Plotting,” in Chemometrics in<br />
<strong>Spectroscopy</strong>. February, p. 24.<br />
Workman, Jerome. See Mark,<br />
Howard.<br />
Worrall, Keith. See Jenkins, Tim J.
www.spectroscopyonline.com December 2010 <strong>Spectroscopy</strong> 25(12) 27<br />
lite Identification for Verapamil<br />
in Rat Plasma by Sub-2-μm LC<br />
Coupled with Quadrupole TOF-<br />
MS. Current Trends in Mass Spectrometry,<br />
October, p. 32.<br />
Yu, Yingqing. See Ahn, Joomi.<br />
Z<br />
Zeitler, Axel. See Taday, Philip F.<br />
Zhang, Allen; Chang, James S.; Gu,<br />
Christine; and Sanders, Mark.<br />
Nontargeted Screening and Accurate<br />
Mass Confirmation of<br />
Pesticides Using High-Resolution<br />
LC–Orbital Trap Mass Spectrometry.<br />
Current Trends in Mass Spectrometry,<br />
July, p. 40.<br />
Zhang, Cunjie; Zhang, Haixia; Litchfield,<br />
David W.; and Yeung,<br />
Ken K.-C. CHCA or DHB? Systematic<br />
Comparison of the Two<br />
Most Commonly Used Matrices<br />
for Peptide Mass Fingerprint<br />
Analysis with MALDI-MS. February,<br />
p. 48.<br />
Zhang, Guangjun. See Li, Yaping.<br />
Zhang, Haixia. See Zhang, Cunjie.<br />
Zlatkin, Igor. See Drapcho, David.<br />
SUBJECTS<br />
ATOMIC PERSPECTIVES<br />
COLUMN<br />
“Atomic Absorption: Feeding the<br />
Food Safety Market,” in Atomic<br />
Perspectives. Hazel Dickson. July,<br />
p. 26.<br />
“Electron Transitions in Optical<br />
Emission and X-Ray Fluorescence<br />
Spectrometry,” in Atomic<br />
Perspectives. Volker Thomsen<br />
and Carlos Augusto Coutinho.<br />
March, p. 30.<br />
“Reducing the Effects of Interferences<br />
in Quadrupole ICP-MS,”<br />
in Atomic Perspectives. Kenneth<br />
Neubauer. November, p. 30.<br />
“Using Qualifier Ions to Validate<br />
Multielement ICP-MS Data in<br />
Complex Samples,” in Atomic<br />
Perspectives. Steve Wilbur and<br />
Ed McCurdy. May, p. 22.<br />
ATOMIC SPECTROSCOPY<br />
“Atomic Absorption: Feeding the Food<br />
Safety Market,” in Atomic Perspectives.<br />
Hazel Dickson. July, p. 26.<br />
“Electron Transitions in Optical<br />
Emission and X-Ray Fluorescence<br />
Spectrometry,” in Atomic<br />
Perspectives. Volker Thomsen<br />
and Carlos Augusto Coutinho.<br />
March, p. 30.<br />
A Quantitative Analysis of Neodymium<br />
and Samarium at Low Pressure<br />
by Laser-Induced Breakdown<br />
<strong>Spectroscopy</strong>. Seung-Hyun Kim,<br />
June-Sik Ju, Hee-Sung Shin, Ho-<br />
Dong Kim, and Ki-Ju Yee. November,<br />
p. 38.<br />
“Reducing the Effects of Interferences<br />
in Quadrupole ICP-MS,”<br />
in Atomic Perspectives. Kenneth<br />
Neubauer. November, p. 30.<br />
Spectrometers for Elemental Analysis,<br />
Part I: The Basic Spectrometer.<br />
Volker Thomsen. January, p. 46.<br />
Spectrometers for Elemental Spectrochemical<br />
Analysis, Part III:<br />
Arc/Spark Optical Emission<br />
Spectrometers. Volker Thomsen.<br />
October, p. 42.<br />
Using ICP-OES for Accurate Monitoring<br />
of Metallic Contaminants<br />
in Water According to U.S. EPA<br />
Method 200.7. Matthew Cassap.<br />
May, p. 64.<br />
“Using Qualifier Ions to Validate<br />
Multielement ICP-MS Data in<br />
Complex Samples,” in Atomic<br />
Perspectives. Steve Wilbur and<br />
Ed McCurdy. May, p. 22.<br />
BASELINE COLUMN<br />
“Group Theory and Symmetry, Part<br />
II: Groups,” in The Baseline.<br />
David W. Ball. January, p. 18.<br />
“Group Theory and Symmetry, Part<br />
III: Representations and Character<br />
Tables,” in The Baseline.<br />
David W. Ball. April, p. 16.<br />
“Group Theory and Symmetry, Part<br />
IV: Great or Grand, We've Got<br />
GOT,” in The Baseline. David W.<br />
Ball. September, p. 18.<br />
“Happy Sesquicentennial, <strong>Spectroscopy</strong>,”<br />
in The Baseline. David W.<br />
Ball. June, p. 16.<br />
“Neutron <strong>Spectroscopy</strong>,” in The Baseline.<br />
David Ball. December, p. 12.<br />
BIOLOGICAL AND MEDICAL<br />
ANALYSIS<br />
"Analysis of Lignin and Cellulose<br />
in Biological Energy Sources by<br />
Raman Microscopy,” in Molecular<br />
<strong>Spectroscopy</strong> Workbench.<br />
Fran Adar. February, p. 18.<br />
CHCA or DHB? Systematic Comparison<br />
of the Two Most Commonly<br />
Used Matrices for Peptide<br />
Mass Fingerprint Analysis<br />
with MALDI-MS. Cunjie Zhang,<br />
Haixia Zhang, David W. Litchfield,<br />
and Ken K.-C. Yeung. February,<br />
p. 48.<br />
Measuring Cellular-Scale Nutrient<br />
Distribution in Algal Biofilms<br />
with Synchrotron Confocal Infrared<br />
Microspectroscopy. Justin N.<br />
Murdock, Walter K. Dodds, John<br />
A. Reffner, and David L. Wetzel.<br />
October, p. 32.<br />
Near-Infrared Spectrophotometric<br />
Analysis of Human Blood Glucose:<br />
Influence of Repeating Errors<br />
on Prediction Accuracy. Yaping<br />
Li, Qingbo Li, and Guangjun<br />
Zhang. June, p. 46.<br />
CHEMOMETRICS IN<br />
SPECTROSCOPY COLUMN<br />
“Classical Least Squares, Part I: Mathematical<br />
Theory,” in Chemometrics<br />
in <strong>Spectroscopy</strong>. Howard Mark and<br />
Jerome Workman. May, p. 16.<br />
“Classical Least Squares, Part II:<br />
Mathematical Theory Continued,”<br />
in Chemometrics in <strong>Spectroscopy</strong>.<br />
Howard Mark and Jerome<br />
Workman. June, p. 20.<br />
“Classical Least Squares, Part III:<br />
Spectroscopic Theory,” in Chemometrics<br />
in <strong>Spectroscopy</strong>. Howard<br />
Mark and Jerome Workman.<br />
October, p. 22.<br />
“Statistics and Chemometrics for<br />
Clinical Data Reporting, Part III:<br />
Using Excel for Data Plotting,” in<br />
Chemometrics in <strong>Spectroscopy</strong>.<br />
Jerome Workman and Howard<br />
Mark. February, p. 24.<br />
DATA ANALYSIS<br />
Assessing Accuracy. Volker Thomsen.<br />
February, p. 32.<br />
“Classical Least Squares, Part I:<br />
Mathematical Theory,” in Chemometrics<br />
in <strong>Spectroscopy</strong>.<br />
Howard Mark and Jerome Workman.<br />
May, p. 16.
28 <strong>Spectroscopy</strong> 25(12) December 2010<br />
www.spectroscopyonline.com<br />
“Classical Least Squares, Part II:<br />
Mathematical Theory Continued,”<br />
in Chemometrics in <strong>Spectroscopy</strong>.<br />
Howard Mark and Jerome<br />
Workman. June, p. 20.<br />
“Classical Least Squares, Part III:<br />
Spectroscopic Theory,” in Chemometrics<br />
in <strong>Spectroscopy</strong>. Howard<br />
Mark and Jerome Workman.<br />
October, p. 22.<br />
Differentiation Between Origins of<br />
Extra Virgin Olive Oils by GC–<br />
C-IRMS Using Principal Component<br />
Analysis, Linear Discriminant<br />
Analysis, and Hierarchical<br />
Cluster Analysis. Andreas Baum,<br />
Yao Lu, Zeland Muccio, Glen P.<br />
Jackson, and Peter B. Harrington.<br />
February, p. 40.<br />
“Statistics and Chemometrics for<br />
Clinical Data Reporting, Part III:<br />
Using Excel for Data Plotting,” in<br />
Chemometrics in <strong>Spectroscopy</strong>.<br />
Jerome Workman and Howard<br />
Mark. February, p. 24.<br />
FOCUS ON QUALITY COLUMN<br />
“Dear Esteemed Vendor?” in Focus<br />
on Quality. R.D. McDowall. September,<br />
p. 22.<br />
“Fat Finger, Falsification, or Fraud?”<br />
in Focus on Quality. R.D. Mc-<br />
Dowall. December, p. 15.<br />
“Understanding and Interpreting<br />
the GAMP 5 Life Cycle Models<br />
for Software,” in Focus on Quality.<br />
R.D. McDowall. April, p. 22.<br />
“Where Are We Now with USP<br />
?" in Focus on Quality.<br />
R.D. McDowall. November, p. 24.<br />
FOOD AND BEVERAGE<br />
ANALYSIS<br />
Differentiation Between Origins of<br />
Extra Virgin Olive Oils by GC–<br />
C-IRMS Using Principal Component<br />
Analysis, Linear Discriminant<br />
Analysis, and Hierarchical<br />
Cluster Analysis. Andreas Baum,<br />
Yao Lu, Zeland Muccio, Glen P.<br />
Jackson, and Peter B. Harrington.<br />
February, p. 40.<br />
HISTORY<br />
“Happy Sesquicentennial, <strong>Spectroscopy</strong>,”<br />
in The Baseline. David W.<br />
Ball. June, p. 16.<br />
“Mass Spectrometry–Mass Spectrometry<br />
Retrospective,” in Mass<br />
Spectrometry Forum. Kenneth L.<br />
Busch. July, p. 14.<br />
Milestones in <strong>Spectroscopy</strong>. Howard<br />
Mark and Steve Brown. June, p.<br />
34.<br />
Spectrometers for Elemental Analysis,<br />
Part I: The Basic Spectrometer.<br />
Volker Thomsen. January,<br />
p. 46.<br />
<strong>Spectroscopy</strong> Moves into the Digital<br />
Age. David Walsh. June, p. 42.<br />
<strong>Spectroscopy</strong> Uncensored: An Insider's<br />
Story of the First 15 Years.<br />
Michael MacRae. June, p. 26.<br />
HYPHENATED TECHNIQUES<br />
Differentiation Between Origins of<br />
Extra Virgin Olive Oils by GC–<br />
C-IRMS Using Principal Component<br />
Analysis, Linear Discriminant<br />
Analysis, and Hierarchical<br />
Cluster Analysis. Andreas Baum,<br />
Yao Lu, Zeland Muccio, Glen P.<br />
Jackson, and Peter B. Harrington.<br />
February, p. 40.<br />
ICP AND ICP-MS<br />
“Reducing the Effects of Interferences<br />
in Quadrupole ICP-MS,”<br />
in Atomic Perspectives. Kenneth<br />
Neubauer. November, p. 30.<br />
Speciation of Mercury in Crude Oil<br />
Using Speciated Isotope Dilution<br />
Mass Spectrometry. G.M. Mizanur<br />
Rahman, Timothy M. Fahrenholz,<br />
H.M. Skip Kingston, Matt<br />
Pamuku, J. David Hwang, and<br />
Lyman A. Young. January, p. 36.<br />
Using ICP-OES for Accurate Monitoring<br />
of Metallic Contaminants<br />
in Water According to U.S. EPA<br />
Method 200.7. Matthew Cassap.<br />
May, p. 64.<br />
“Using Qualifier Ions to Validate<br />
Multielement ICP-MS Data in<br />
Complex Samples,” in Atomic<br />
Perspectives. Steven Wilbur and<br />
Ed McCurdy. May, p. 22.<br />
IMAGING AND MICROSCOPY<br />
“Analysis of Lignin and Cellulose<br />
in Biological Energy Sources by<br />
Raman Microscopy,” in Molecular<br />
<strong>Spectroscopy</strong> Workbench.<br />
Fran Adar. February, p. 18.<br />
“CMOS Technology for Scientific<br />
Imaging,” in Laser and Optics<br />
Interface. Ken Kaufmann. July,<br />
p. 20.<br />
“Depth Resolution of the Raman Microscope:<br />
Optical Limitations and<br />
Sample Characteristics,” in Molecular<br />
<strong>Spectroscopy</strong> Workbench.<br />
Fran Adar. March, p. 16.<br />
Measuring Cellular-Scale Nutrient<br />
Distribution in Algal Biofilms<br />
with Synchrotron Confocal Infrared<br />
Microspectroscopy. Justin N.<br />
Murdock, Walter K. Dodds, John<br />
A. Reffner, and David L. Wetzel.<br />
October, p. 32.<br />
INFRARED SPECTROSCOPY<br />
Measuring Cellular-Scale Nutrient<br />
Distribution in Algal Biofilms<br />
with Synchrotron Confocal Infrared<br />
Microspectroscopy. Justin N.<br />
Murdock, Walter K. Dodds, John<br />
A. Reffner, and David L. Wetzel.<br />
October, p. 32.<br />
X-Ray Fluorescence and FT-IR Identification<br />
of Strontium and Carbonate<br />
in Domestic and Imported<br />
Gypsum Drywall. Jeffrey Hirsch,<br />
Steven R. Lowry, and Mick Dowd.<br />
July, p. 30.<br />
LASER AND OPTICS INTERFACE<br />
COLUMN<br />
“CMOS Technology for Scientific<br />
Imaging,” in Laser and Optics<br />
Interface. Ken Kaufmann. July,<br />
p. 20.<br />
“How Optical Advances Helped Deliver<br />
the Promise of Miniature<br />
Spectrometers,” in Laser and<br />
Optics Interface. Robert Morris.<br />
January, p. 30.<br />
“Terahertz Technology: Moving<br />
from the Laboratory into the<br />
Process World,” in Laser and<br />
Optics Interface. Philip F. Taday,<br />
Michael Evans, Axel Zeitler, Yaochun<br />
Shen, and Dipankar Dey.<br />
April, p. 32.<br />
LASERS<br />
A Quantitative Analysis of Neodymium<br />
and Samarium at Low<br />
Pressure by Laser-Induced Breakdown<br />
<strong>Spectroscopy</strong>. Seung-Hyun<br />
Kim, June-Sik Ju, Hee-Sung Shin,
www.spectroscopyonline.com December 2010 <strong>Spectroscopy</strong> 25(12) 29<br />
Ho-Dong Kim, and Ki-Ju Yee.<br />
November, p. 38.<br />
MARKET ANALYSIS<br />
<strong>Spectroscopy</strong> Bounces Back. Lawrence<br />
S. Schmid. March, p. 40.<br />
<strong>Spectroscopy</strong> Market: Weathering<br />
the Storm and on the Path to Recovery.<br />
Sivakumar Narayanaswamy.<br />
December, p. 19.<br />
2010 Salary Survey: A Year of Pluses<br />
and Minuses. Megan Evans.<br />
March, p. 36.<br />
MASS SPECTROMETRY FORUM<br />
COLUMN<br />
“Derivatization in Mass Spectrometry,”<br />
in Mass Spectrometry<br />
Forum. Kenneth L. Busch. November,<br />
p. 18.<br />
“Ion Burn and the Dirt of Mass Spectrometry,”<br />
in Mass Spectrometry<br />
Forum. Kenneth L. Busch. September,<br />
p. 32.<br />
“Mass Spectral Libraries: The Next<br />
Generation,” in Mass Spectrometry<br />
Forum. Kenneth L. Busch.<br />
January, p. 24.<br />
“Mass Spectrometry–Mass Spectrometry<br />
Retrospective,” in Mass<br />
Spectrometry Forum. Kenneth L.<br />
Busch. July, p. 14.<br />
“A Random Walk Through the Web<br />
of Mass Spectrometry,” in Mass<br />
Spectrometry Forum. Kenneth L.<br />
Busch. March, p. 24.<br />
MASS SPECTROMETRY<br />
CHCA or DHB? Systematic Comparison<br />
of the Two Most Commonly<br />
Used Matrices for Peptide<br />
Mass Fingerprint Analysis<br />
with MALDI-MS. Cunjie Zhang,<br />
Haixia Zhang, David W. Litchfield,<br />
and Ken K.-C. Yeung. February,<br />
p. 48.<br />
“Derivatization in Mass Spectrometry,”<br />
in Mass Spectrometry<br />
Forum. Kenneth L. Busch. November,<br />
p. 18.<br />
Differentiation Between Origins of<br />
Extra Virgin Olive Oils by GC–<br />
C-IRMS Using Principal Component<br />
Analysis, Linear Discriminant<br />
Analysis, and Hierarchical<br />
Cluster Analysis. Andreas Baum,<br />
Yao Lu, Zeland Muccio, Glen P.<br />
Jackson, and Peter B. Harrington.<br />
February, p. 40.<br />
“Ion Burn and the Dirt of Mass Spectrometry,”<br />
in Mass Spectrometry<br />
Forum. Kenneth L. Busch. September,<br />
p. 32.<br />
“Mass Spectral Libraries: The Next<br />
Generation,” in Mass Spectrometry<br />
Forum. Kenneth L. Busch.<br />
January, p. 24.<br />
“Mass Spectrometry–Mass Spectrometry<br />
Retrospective,” in Mass<br />
Spectrometry Forum. Kenneth L.<br />
Busch. July, p. 14.<br />
“A Random Walk Through the Web<br />
of Mass Spectrometry,” in Mass<br />
Spectrometry Forum. Kenneth L.<br />
Busch. March, p. 24.<br />
Speciation of Mercury in Crude Oil<br />
Using Speciated Isotope Dilution<br />
Mass Spectrometry. G.M. Mizanur<br />
Rahman, Timothy M. Fahrenholz,<br />
H.M. Skip Kingston, Matt<br />
Pamuku, J. David Hwang, and<br />
Lyman A. Young. January, p. 36.<br />
MEETING REPORTS<br />
Pittcon 2010 New Product Review.<br />
Howard Mark. May, p. 32.<br />
“Thoughts About ICORS 2010 and<br />
Where Raman <strong>Spectroscopy</strong> Is<br />
Headed,” in Molecular <strong>Spectroscopy</strong><br />
Workbench. Fran Adar. October,<br />
p. 16.<br />
MOLECULAR SPECTROSCOPY<br />
WORKBENCH COLUMN<br />
“Analysis of Lignin and Cellulose<br />
in Biological Energy Sources by<br />
Raman Microscopy,” in Molecular<br />
<strong>Spectroscopy</strong> Workbench.<br />
Fran Adar. February, p. 18.<br />
“Depth Resolution of the Raman Microscope:<br />
Optical Limitations and<br />
Sample Characteristics,” in Molecular<br />
<strong>Spectroscopy</strong> Workbench.<br />
Fran Adar. March, p. 16.<br />
“Thoughts About ICORS 2010 and<br />
Where Raman <strong>Spectroscopy</strong> Is<br />
Headed,” in Molecular <strong>Spectroscopy</strong><br />
Workbench. Fran Adar. October,<br />
p. 16.<br />
NEAR-IR SPECTROSCOPY<br />
Near-Infrared Spectrophotometric<br />
Analysis of Human Blood Glucose:<br />
Influence of Repeating Errors<br />
on Prediction Accuracy. Yaping<br />
Li, Qingbo Li, and Guangjun<br />
Zhang. June, p. 46.<br />
Preliminary Field Measurement<br />
of Cotton Fiber Micronaire by<br />
Portable NIR. James Rodgers,<br />
Sho Yeung Kang, Chanel Fortier,<br />
Xiaoliang Cui, Gayle Davidonis,<br />
Ernest Clawson, Don Boquet, and<br />
William Pettigrew. September, p.<br />
38.<br />
OPTICS<br />
“Depth Resolution of the Raman Microscope:<br />
Optical Limitations and<br />
Sample Characteristics,” in Molecular<br />
<strong>Spectroscopy</strong> Workbench.<br />
Fran Adar. March, p. 16.<br />
“How Optical Advances Helped Deliver<br />
the Promise of Miniature<br />
Spectrometers,” in Laser and<br />
Optics Interface. Robert Morris.<br />
January, p. 30.<br />
RAMAN SPECTROSCOPY<br />
“Analysis of Lignin and Cellulose<br />
in Biological Energy Sources by<br />
Raman Microscopy,” in Molecular<br />
<strong>Spectroscopy</strong> Workbench.<br />
Fran Adar. February, p. 18.<br />
“Depth Resolution of the Raman Microscope:<br />
Optical Limitations and<br />
Sample Characteristics,” in Molecular<br />
<strong>Spectroscopy</strong> Workbench.<br />
Fran Adar. March, p. 16.<br />
“Thoughts About ICORS 2010 and<br />
Where Raman <strong>Spectroscopy</strong> Is<br />
Headed,” in Molecular <strong>Spectroscopy</strong><br />
Workbench. Fran Adar. October,<br />
p. 16.<br />
SAMPLE PREPARATION AND<br />
INTRODUCTION<br />
Comparison of Different Sample<br />
Preparation Procedures for the<br />
Determination of RoHS/WEEE<br />
Regulated Elements in Printed<br />
Circuit Boards and Electrical<br />
Components by EDXRF. John E.<br />
Martin, Lea L. Anderson Smith,<br />
Gloria Adjei-Bekoe, and Robert<br />
Thomas. April, p. 40.<br />
SPECTROSCOPIC THEORY<br />
“Classical Least Squares, Part I:<br />
Mathematical Theory,” in Chemometrics<br />
in <strong>Spectroscopy</strong>.
30 <strong>Spectroscopy</strong> 25(12) December 2010<br />
www.spectroscopyonline.com<br />
Howard Mark and Jerome Workman.<br />
May, p. 16.<br />
“Classical Least Squares, Part II:<br />
Mathematical Theory Continued,”<br />
in Chemometrics in <strong>Spectroscopy</strong>.<br />
Howard Mark and Jerome<br />
Workman. June, p. 20.<br />
“Classical Least Squares, Part III:<br />
Spectroscopic Theory,” in Chemometrics<br />
in <strong>Spectroscopy</strong>. Howard<br />
Mark and Jerome Workman.<br />
October, p. 22.<br />
“Electron Transitions in Optical<br />
Emission and X-Ray Fluorescence<br />
Spectrometry,” in Atomic<br />
Perspectives. Volker Thomsen<br />
and Carlos Augusto Coutinho.<br />
March, p. 30.<br />
“Group Theory and Symmetry, Part<br />
II: Groups,” in The Baseline.<br />
David W. Ball. January, p. 18.<br />
“Group Theory and Symmetry, Part<br />
III: Representations and Character<br />
Tables,” in The Baseline.<br />
David W. Ball. April, p. 16.<br />
“Group Theory and Symmetry, Part<br />
IV: Great or Grand, We've Got<br />
GOT,” in The Baseline. David W.<br />
Ball. September, p. 18.<br />
Spectrometers for Elemental Analysis,<br />
Part I: The Basic Spectrometer.<br />
Volker Thomsen. January,<br />
p. 46.<br />
SUPPLEMENT: APPLICATIONS<br />
OF ICP & ICP-MS<br />
TECHNIQUES FOR TODAY’S<br />
SPECTROSCOPISTS<br />
A Common Sense Laboratory Guide<br />
to Reducing Errors and Contamination<br />
in ICP and ICP-MS<br />
Analysis. Patricia Atkins, Laszlo<br />
Ernyei, Vanaja Sivakumar, and<br />
Ralph Obenauf. November, p. 42.<br />
Determination of Trace Elements in<br />
Over-the-Counter Cough Syrup<br />
by Inductively Coupled Plasma–<br />
Optical Emission <strong>Spectroscopy</strong>.<br />
Manuel Almeida, Maura Rury,<br />
John Condon, and Peter Brown.<br />
November, p. 12.<br />
Direct, Automated Analysis of Organic<br />
Solvents Using Quadrupole<br />
ICP-MS Coupled with a Dual Syringe<br />
Pump Sample System. Tomoko<br />
Oki, Julian D. Wills, Shona<br />
McSheehy, Meike Hamester, Torsten<br />
Lindemann, and Joachim<br />
Hinrichs. November, p. 6.<br />
Interference-Free Drinking Water<br />
Analysis Using ICP-OES. Uwe<br />
Oppermann and Jürgen Schram.<br />
November, p. 36.<br />
Optimizing Performance for a Collision/Reaction<br />
Cell ICP-MS System<br />
Operating in Helium Collision<br />
Mode. Ed McCurdy, Naoki<br />
Sugiyama, and Steven M. Wilbur.<br />
November, p. 20.<br />
Trace Elemental Determination in<br />
Residual Fuel Oils Using ICP-<br />
MS. Riccardo Magarini. November,<br />
p. 30.<br />
SUPPLEMENT: DEFENSE AND<br />
HOMELAND SECURITY<br />
Handheld FT-IR and Raman as<br />
Tools in the Analysis of Improvised<br />
Explosive Materials. Robert<br />
L. Green, Michael D. Hargreaves,<br />
and Christopher D. Brown. April,<br />
p. 14.<br />
Laser-Based Technologies Target<br />
Terrorists. Jason Eichenholz,<br />
Kevin Kaye, and Steve Buckley.<br />
April, p. 26.<br />
Raman Chemical Imaging of Explosive<br />
Contaminated Fingerprints<br />
for Forensic Applications. Erik D.<br />
Emmons, Ashish Tripathi, Jason<br />
A. Guicheteau, Steven D. Christesen,<br />
and Augustus W. Fountain<br />
III. April, p. 8.<br />
Raman <strong>Spectroscopy</strong> of Documents.<br />
Thomas J. Tague Jr., Marco Leona,<br />
and Peng Wang. April, p. 20.<br />
Rapid Chemical Threat Identification<br />
by SPME-GC–TMS. Edgar<br />
D. Lee, Philip A. Smith, Christopher<br />
R. Bowerbank, and Douglas<br />
W. Later. April, p. 30.<br />
SUPPLEMENT: FT-IR<br />
TECHNOLOGY FOR TODAY’S<br />
SPECTROSCOPISTS<br />
Characterizing Colored Fibers by<br />
FT-IR and Raman <strong>Spectroscopy</strong>.<br />
John Reffner, Shay Smith, and<br />
Fran Adar. August, p. 6.<br />
Handling Spectra from FT-IR Foreign<br />
Matter Analysis. Tsuyoshi<br />
Tsuchibuchi. August, p. 16.<br />
Hollow Waveguides: The Next Generation<br />
of Mid-IR Remote Sampling<br />
Accessories. Jenni L. Briggs.<br />
August, p. 36.<br />
Improved FT-IR Instrumentation<br />
and Software for Complete Confidence<br />
in QA/QC Testing. Mike<br />
Bradley and Jeffrey Hirsch. August,<br />
p. 24.<br />
Using FT-IR Microscope ATR Objectives<br />
to Resolve Complex Samples.<br />
Richard A. Larsen, Ken-ichi<br />
Akao, Jun Koshoubu, and Hiroshi<br />
Sugiyama. August, p. 42.<br />
SUPPLEMENT: CURRENT<br />
TRENDS IN MASS<br />
SPECTROMETRY<br />
Advancing TOF-MS–Based Screening<br />
for Food Safety Residue Analysis<br />
with a Positive Approach.<br />
Tim J. Jenkins, Keith Worrall,<br />
Peter Hancock, James Morphet,<br />
Emmanuelle Cognard, and Didier<br />
Ortelli. March, p. 25.<br />
Analyzing Small Molecule Metabolite<br />
Profiles of Diabetic and Nondiabetic<br />
Urine Samples Using<br />
GC×GC–TOF-MS and Statistical<br />
Software as a Data Mining Strategy.<br />
John Heim. March, p. 30.<br />
Bioanalysis Using Dried Blood<br />
Spots: The Biggest Advancement<br />
in Bioanalysis Since LC–MS-MS?<br />
Robert S. Plumb, Paul D. Rainville,<br />
and Christopher A. Evans.<br />
July, p. 22.<br />
Branching Out: Mass Spectrometry<br />
and the Shape of Biotherapeutics.<br />
Joomi Ahn, Vera Ivleva, St John<br />
Skilton, and Yingqing Yu. May,<br />
p. 28.<br />
Comparing the Capabilities of<br />
Time-of-Flight and Quadrupole<br />
Mass Spectrometers. Joe Binkley,<br />
and Mark Libarondi. July, p. 28.<br />
Comprehensive Characterization of<br />
Monoclonal Antibodies Using a<br />
Microfluidic Chip-Q-TOF Platform.<br />
Keith Waddell, and Ravindra<br />
Gudihal. March, p. 15.<br />
Development of a High-Throughput<br />
LC–MS Assay for Drugs of Abuse<br />
from Biological Matrices. Michael<br />
McGinley and Carl Sanchez. October,<br />
p. 24.<br />
Development of a High-Throughput<br />
LC–MS-MS Assay for 13<br />
Commonly Prescribed Pain
www.spectroscopyonline.com December 2010 <strong>Spectroscopy</strong> 25(12) 31<br />
Management Drugs from Urine<br />
with Cleanup Using Solid-Phase<br />
Extraction. Carl Sanchez, Philip<br />
J. Koerner, and Sky Countryman.<br />
July, p. 34.<br />
Dried Blood Spots and High-Resolution<br />
Mass Spectrometry for Discovery<br />
Fast PK Bioanalysis. Rohan<br />
A. Thakur, Michael Koleto, Dahai<br />
Dong, Benjamin Begley, and Lee<br />
Koetzner. October, p. 14.<br />
Enhancing Mass Spectral Formula<br />
Determination by Heuristic Rules.<br />
Ming Gu. May, p. 42.<br />
58th ASMS Conference Review.<br />
Megan Evans. July, p. 44.<br />
Increasing Productivity of ADME<br />
Studies Using Accurate Mass<br />
Technology. Hesham Ghobarah,<br />
Suma Ramagiri, and Jim Ferguson.<br />
October, p. 39.<br />
Interaction of Dichloromethane<br />
Solvent with n-Alkylamines Analyzed<br />
by Electron Ionization<br />
GC–MS. O. David Sparkman,<br />
Matthew Curtis, and Patrick R.<br />
Jones. March, p. 8.<br />
LC–MS-MS–Based Strategies for the<br />
Targeted and Nontargeted Screening<br />
of Contaminants in Food, Environmental,<br />
and Forensic Samples.<br />
André Schreiber and Nadia<br />
Pace. March, p. 34.<br />
Meeting the Surge in Demand for<br />
Seafood Screening on the Gulf<br />
Coast. Joan Stevens and Mike<br />
Szelewski. October, p. 8.<br />
Nontargeted Screening and Accurate<br />
Mass Confirmation of Pesticides<br />
Using High-Resolution LC–Orbital<br />
Trap Mass Spectrometry.<br />
Allen Zhang, James S. Chang,<br />
Christine Gu, and Mark Sanders.<br />
July, p. 40.<br />
Phosphorylation Site Localization<br />
Using Probability-Based Scoring.<br />
Steven P. Gygi. October, p. 28.<br />
Qualitative and Quantitative Metabolite<br />
Identification for Verapamil<br />
in Rat Plasma by Sub-2-μm LC<br />
Coupled with Quadrupole TOF-<br />
MS. Kate Yu, Alan Millar, Henry<br />
Shion, Stephen McDonald, Jeff<br />
Goshawk, and Brian Murphy. October,<br />
p. 32.<br />
Reliable and Efficient Sulfur Detection<br />
in Proteins Using ICP-MS<br />
with Capillary LC. Meike Hamester,<br />
Shona McSheehy, Daniel J.<br />
Kutscher, Tobias Konz, and Jörg<br />
Bettmer. October, p. 21.<br />
A Study of Matrix Effects on Multiply<br />
Charged Compounds. Rohan<br />
Thakur. March, p. 21.<br />
TOF-MS: A Viable Solution for<br />
Crude Oil Extract Analysis. Nick<br />
Bukowski. May, p. 22.<br />
Translating HPLC Performance<br />
Gains of Core-Shell Media to LC–<br />
MS Applications. Michael McGinley<br />
and Carl Sanchez. May, p. 36.<br />
Ultralow Detection of Estrogenic<br />
Compounds by GC–NCI-MS-<br />
MS. Anthony Macherone, Melissa<br />
Churley, and Robert White. May,<br />
p. 10.<br />
Ultralow Quantification of Pesticides<br />
in Baby Food. Gerd Vanhoenacker,<br />
Frank David, and Pat<br />
Sandra. July, p. 10.<br />
The Use of Novel Software for the<br />
Identification of Trace Compounds<br />
in Complex Mixtures.<br />
Gareth M. Roberts. July, p. 16.<br />
Using Comprehensive GC×GC–<br />
TOF-MS for Enhanced Detection<br />
and Separation in Antidoping<br />
Control Screening. John Heim<br />
and Doug Staples. May, p. 16.<br />
Using Novel TOF-MS to Increase<br />
Sensitivity and Confidently Detect<br />
Drugs of Abuse in Urine.<br />
Petra Gerhards, Pierre Schanen,<br />
and Gerhard Horner. October, p.<br />
18.<br />
SUPPLEMENT: RAMAN<br />
TECHNOLOGY FOR TODAY’S<br />
SPECTROSCOPISTS<br />
Confocal Raman AFM Imaging of<br />
Paper. U. Schmidt, A. Jauss, T.<br />
Dieing, and O. Hollricher. June,<br />
p. 32.<br />
High-Throughput Trace Analysis<br />
Using SERS-Active Microtiter<br />
Plates with a Raman Plate Reader.<br />
David Drapcho, Igor Zlatkin,<br />
Frank Inscore, Chetan Shende,<br />
Atanu Sengupta, Hermes Huang,<br />
and Stuart Farquharson. June,<br />
p. 42.<br />
Low-Resolution Raman <strong>Spectroscopy</strong><br />
in Science Education. Jorge<br />
Macho. June, p. 12.<br />
Transmission Raman: A Method<br />
for Quantifying Bulk Materials.<br />
Eunah Lee and Fran Adar.<br />
June, p. 6.<br />
Understanding Raman Spectrometer<br />
Parameters. Dick Wieboldt. June,<br />
p. 20.<br />
TUTORIALS<br />
Spectrometers for Elemental Analysis,<br />
Part I: The Basic Spectrometer.<br />
Volker Thomsen. January,<br />
p. 46.<br />
Spectrometers for Elemental Spectrochemical<br />
Analysis, Part II:<br />
X-Ray Fluorescence Spectrometers.<br />
Volker Thomsen and Carlos<br />
Augusto Coutinho. July, p. 38.<br />
Spectrometers for Elemental Spectrochemical<br />
Analysis, Part III:<br />
Arc/Spark Optical Emission Spectrometers.<br />
Volker Thomsen. October,<br />
p. 42.<br />
X-RAY SPECTROSCOPY<br />
Comparison of Different Sample<br />
Preparation Procedures for the<br />
Determination of RoHS/WEEE<br />
Regulated Elements in Printed<br />
Circuit Boards and Electrical<br />
Components by EDXRF. John E.<br />
Martin, Lea L. Anderson Smith,<br />
Gloria Adjei-Bekoe, and Robert<br />
Thomas. April, p. 40.<br />
“Electron Transitions in Optical<br />
Emission and X-Ray Fluorescence<br />
Spectrometry,” in Atomic<br />
Perspectives. Volker Thomsen<br />
and Carlos Augusto Coutinho.<br />
March, p. 30.<br />
Spectrometers for Elemental Spectrochemical<br />
Analysis, Part II:<br />
X-Ray Fluorescence Spectrometers.<br />
Volker Thomsen and Carlos<br />
Augusto Coutinho. July, p. 38.<br />
X-Ray Fluorescence and FT-IR Identification<br />
of Strontium and Carbonate<br />
in Domestic and Imported<br />
Gypsum Drywall. Jeffrey Hirsch,<br />
Steven R. Lowry, and Mick Dowd.<br />
July, p. 30.<br />
For more information on<br />
this topic, please visit:<br />
www.spectroscopyonline.com
32 SPECTROSCOPY CORPORATE CAPABILITIES DECEMBER 2010<br />
A2 Technologies<br />
www.spectroscopyonline.com<br />
A2 Technologies<br />
14 Commerce Drive<br />
Danbury, Connecticut 06810<br />
TELEPHONE<br />
(203) 312-1100<br />
FAX<br />
(203) 312-1058<br />
E-MAIL<br />
info@a2technologies.com<br />
WEB SITE<br />
www.a2technologies.com<br />
NUMBER OF EMPLOYEES<br />
USA: 26<br />
Elsewhere: 3<br />
YEAR FOUNDED<br />
2007<br />
Company Description<br />
A2 Technologies develops, manufactures, and markets miniaturized,<br />
hand held, portable, and benchtop high performance<br />
FTIR spectrometers and FTIR analyzers. Our customers are<br />
typically chemists, qc/qa personnel, engineers, spectroscopists,<br />
and analytical service personnel. A2’s products are used in a<br />
broad range of industries and applications such as aerospace,<br />
power generation, industrial qa/qc, as well as in academia.<br />
A2’s principal owners pioneered out-of-laboratory FTIR measurements<br />
and today we continue to focus on bringing FTIR<br />
to more and more diverse applications and end users. Our<br />
systems are designed to enable experienced FTIR users to develop<br />
dedicated methods, and then for those methods to be<br />
deployed with our analyzers in out-of-lab environments.<br />
Chief Spectroscopic Techniques Supported<br />
⦁ FTIR<br />
Major Products/Services<br />
A2 Technologies products include: the ML spectrometer, a<br />
compact bench top FTIR spectrometer; the MLp, a portable<br />
FTIR spectrometer for out-of-lab use; The PAL FTIR analyzer for<br />
measuring key components in oil, lubricating fluids, and fuels;<br />
Exoscan, the handheld FTIR spectrometer, which is designed<br />
to be used in the lab or at-site in the field and features interchangeable<br />
ATR, diffuse reflection, specular reflection, and<br />
grazing angle reflection sampling interfaces; and FlexScan, a<br />
handheld, portable FTIR analyzer for dedicated use in out-oflab<br />
sites.<br />
Facilities<br />
Headquartered in Danbury Connecticut,<br />
A2 Technologies is ISO compliant and has<br />
a direct sales force in the U.S. Our international<br />
sales office is located in the UK and<br />
we have an extensive group of world-wide<br />
distributors.
34 SPECTROSCOPY CORPORATE CAPABILITIES DECEMBER 2010<br />
ABB Analytical Measurement<br />
www.spectroscopyonline.com<br />
ABB Analytical<br />
Measurement<br />
585 boul. Charest E.<br />
suite 300<br />
Quebec, QC<br />
G1K 9H4<br />
Canada<br />
TELEPHONE<br />
(418) 877-2944<br />
FAX<br />
(418) 877-2834<br />
E-MAIL<br />
ftir@ca.abb.com<br />
WEB SITE<br />
www.abb.com/analytical<br />
NUMBER OF EMPLOYEES<br />
200<br />
YEAR FOUNDED<br />
1973<br />
Company Description<br />
Founded in 1973 as Bomem Inc., the Analytical Measurement<br />
Business Unit of ABB enables scientists around the world to<br />
perform through excellence in infrared spectroscopy. ABB is<br />
a market leader in Fourier Transform Infrared (FT-IR and FT-<br />
NIR) in terms of reliability and reproducibility. ABB Analytical<br />
designs, manufactures, and markets high-performance, affordable<br />
spectrometers as well as turnkey analytical solutions and<br />
spectroradiometers for remote sensing. ABB Analytical capabilities<br />
encompass one of the largest portfolios in the world for<br />
laboratory, at-line, and process FT-IR analyzers. They perform<br />
real-time analysis of the chemical composition and/or physical<br />
properties of a process sample stream.<br />
Chief Spectroscopic Techniques Supported<br />
⦁ FT-IR<br />
⦁ FT-NIR<br />
⦁ Spectroradiometry and Remote Sensing<br />
⦁ Dedicated team of engineers offering simple and<br />
dependable solutions with reliable instruments<br />
⦁ Local point of contact for field service and technical<br />
support in most countries around the world with<br />
inventories for parts on all continents<br />
Markets Served<br />
⦁ Laboratory and Academic<br />
⦁ Life Sciences<br />
⦁ Pharmaceutical<br />
⦁ Fine Chemicals, Specialty Chemicals, and Commodity<br />
Chemicals<br />
⦁ Refining and Petrochemicals<br />
⦁ Metallurgical<br />
⦁ Semiconductor<br />
⦁ Original Equipment Manufacturer (OEM)<br />
⦁ Remote Sensing and Aerospace<br />
Major Products/Services<br />
ABB’s advanced solutions combine<br />
analyzers, advanced process control, data<br />
management, and process and application<br />
knowledge to improve the operational performance,<br />
productivity, capacity, and safety<br />
of industrial processes for customers. For all<br />
laboratory or process needs, ABB can be<br />
your partner and single-source provider of<br />
simple, low-cost, high performance, general-purpose<br />
FT-IR and FT-NIR spectrometers.<br />
The company also markets analyzers<br />
for hydrogen and inclusion<br />
measurement in liquid aluminum.<br />
Facility<br />
Our manufacturing facility located in<br />
Quebec City, Canada, employs more than<br />
200 people, including R&D, manufacturing,<br />
marketing, sales, and administrative<br />
groups. The ABB Group of companies<br />
operates in around 100 countries and<br />
employs about 117,000 people.
HERO<br />
N 0 412<br />
David, senior automation engineer.<br />
A single FT-IR / NIR solution he trusts.<br />
FT-IR Optimizing Productivity. David oversees the quality analysis of recycled<br />
materials used by a multinational chemical company in its manufacturing<br />
process. Responsible for a multi-site environment, David appreciates that<br />
ABB FT-IR and FT-NIR spectrometers deliver proven calibration transfer without<br />
adjustment. As he and his company are committed to a sustainable environment,<br />
David also appreciates that ABB spectrometers ensure consistent, high-quality<br />
products while eliminating the use of chemical agents. Learn how ABB Analytical<br />
helped David overcome technical challenges at www.abb.com/analytical<br />
ABB Analytical<br />
Phone: +1 418-877-2944<br />
1 800 858-3847 (North America)<br />
E-mail: ftir@ca.abb.com
36 SPECTROSCOPY CORPORATE CAPABILITIES DECEMBER 2010<br />
Amptek, Inc.<br />
www.spectroscopyonline.com<br />
Amptek, Inc.<br />
14 DeAngelo Drive<br />
Bedford, MA 01730<br />
TELEPHONE<br />
(781) 275-2242<br />
FAX<br />
(781) 275-3470<br />
E-MAIL<br />
sales@amptek.com<br />
WEB SITE<br />
www.amptek.com<br />
NUMBER OF EMPLOYEES<br />
29<br />
YEAR FOUNDED<br />
1977<br />
Company Description<br />
Amptek, Inc. is a recognized world leader in the design and<br />
manufacture of state-of-the-art X-ray and gamma ray detectors,<br />
preamplifiers, instrumentation, and components for portable<br />
instruments, laboratories, satellites, and analytical purposes.<br />
These products provide the user with high performance and<br />
high reliability together with small size and low power.<br />
Chief Spectroscopic Techniques Supported<br />
⦁ X-ray fluorescence (EDXRF)<br />
⦁ Direct spectral measurements<br />
⦁ SEM<br />
⦁ PIXE<br />
⦁ TXRF<br />
Markets Served<br />
Amptek serves wherever X-ray detection is used; for example,<br />
hand-held and table-top XRF analyzers produced by OEMs;<br />
research facilities in universities, commercial enterprises, and<br />
the military; nuclear medicine; space; museums; environmental<br />
monitoring; and geological analysis of soils and minerals.<br />
Major Products/Services<br />
Models XR-100CR and Super XR-100SDD are high-performance<br />
X-ray detector systems using a thermoelectric cooler<br />
and no liquid nitrogen, featuring a wide range of detection<br />
areas and efficiency and resolution of 127 eV FWHM.<br />
Power and shaping are provided by the PX4 Digital Pulse<br />
Processor. The XR-100 successfully analyzed the rocks and<br />
soil on Mars.<br />
The X-123 is a complete X-ray detector system in one<br />
small box that fits in your hand. The X-123 incorporates<br />
either the Amptek Si-Pin Diode Detector or Super Silicon<br />
Drift Detector; Charge Sensitive Preamplifier; the Amptek<br />
DP5 Digital Pulse Processor and MCA; and the Amptek PC5<br />
Power Supply. This small, low power,<br />
easy to operate, high-performance instrument<br />
is ideal for both the laboratory<br />
and OEM industries.<br />
Completing Amptek’s XRF portable<br />
solutions for exact measurements are<br />
the new, USB controlled Mini-X X-ray<br />
tube and the XRF-FP quantitative analysis<br />
software. Please visit our web site for<br />
complete specifications.<br />
Applications<br />
⦁ X-Ray Fluorescence<br />
⦁ Process Control<br />
⦁ OEM Instrumentation<br />
⦁ RoHS/WEEE Compliance Testing<br />
⦁ Nondestructive Analysis with XRF<br />
⦁ Restricted Metals Detection<br />
⦁ Environmental Monitoring<br />
⦁ Medical and Nuclear Electronics<br />
⦁ Heavy Metals in Plastics<br />
⦁ Lead Detectors<br />
⦁ Toxic Dump Site Monitoring<br />
⦁ Semiconductor Processing<br />
⦁ Nuclear Safeguards Verification<br />
⦁ Plastic & Metal Separation<br />
⦁ Coal & Mining Operations<br />
⦁ Sulfur in Oil and Coal Detection<br />
⦁ Smoke Stack Analysis<br />
⦁ Plating Thickness<br />
⦁ Oil Logging<br />
⦁ Electro-Optical Systems<br />
⦁ Research Experiments & Teaching<br />
⦁ Art and Archaeology<br />
⦁ Jewelry Analysis
X-Ray Detectors<br />
• No Liquid Nitrogen • USB Controlled<br />
• Low Cost<br />
• Easy to Use<br />
Complete XRF System<br />
PROVEN PERFORMANCE<br />
NEW SUPER SDD<br />
5.9<br />
keV<br />
127 eV FWHM<br />
25 mm 2 x 500 Mm<br />
11.2 Ms peaking time<br />
P/B Ratio: 8000/1<br />
55<br />
Fe<br />
Energy (keV)<br />
Complete X-Ray Spectrometer<br />
INCLUDES<br />
1 X-Ray Detector and Preamplifier<br />
2 Digital Pulse Processor and MCA<br />
3 Power Supply<br />
Counts<br />
Si-PIN<br />
149 eV FWHM<br />
6 mm 2 x 500 Mm<br />
25.6 Ms peaking time<br />
P/B Ratio: 6200/1<br />
5.9<br />
keV<br />
55<br />
Fe<br />
Energy (keV)<br />
OEM Components for XRF<br />
PA-210 Preamplifier<br />
inside optional<br />
heat sink<br />
AXR X-Ray<br />
Detector<br />
DP5 Digital<br />
Pulse Processor,<br />
Pulse Shaping,<br />
+ MCA<br />
PC5 Power<br />
Supply<br />
APPLICATIONS<br />
• OEM<br />
• X-Ray Fluorescence<br />
• RoHS-WEEE Compliance Testing<br />
• Process Control<br />
• Restricted Metals Detection<br />
• Heavy Metals in Plastic<br />
• Lead Detectors<br />
• Environmental Monitoring<br />
• Art & Archaeology<br />
• Jewelry Analysis<br />
• Plating Thickness<br />
Our OEM Technology<br />
Your Products<br />
• Table-top XRF Analyzers<br />
• Hand-held XRF Analyzers<br />
AMPTEK Inc.<br />
www.amptek.com
38 SPECTROSCOPY CORPORATE CAPABILITIES DECEMBER 2010<br />
Applied Photophysics<br />
www.spectroscopyonline.com<br />
Applied Photophysics<br />
21 Mole Business Park<br />
Leatherhead<br />
Surrey KT22 7AG<br />
United Kingdom<br />
TELEPHONE<br />
+44 (0) 1372 386537<br />
Toll-free (from USA only)<br />
1-800 543 4130<br />
E-MAIL<br />
Sales Department: sales@<br />
photophysics.com<br />
Technical Support: techsup@<br />
photophysics.com<br />
WEB SITE<br />
www.photophysics.com<br />
YEAR FOUNDED<br />
1971<br />
Company Description<br />
Applied Photophysics is a world-leading manufacturer and<br />
supplier of precision spectrometers to researchers working<br />
in pharmaceutical, biotechnology, and academic environments.<br />
Our instruments are used to determine structural,<br />
thermodynamic, and kinetics properties of a wide range of<br />
samples in solution. Established in 1971, Applied Photophysics<br />
has an enviable reputation for outstanding performance<br />
and innovative technology.<br />
Chief Spectroscopic Techniques Supported<br />
⦁ Circular Dichroism (CD) spectroscopy<br />
⦁ Stopped-flow spectroscopy<br />
⦁ Laser-flash spectroscopy<br />
Markets Served<br />
Applied Photophysics offers precision spectrometers to academic<br />
and industrial markets, The Chirascan spectrometers<br />
are now the CD instruments of choice in pharmaceutical<br />
and biotechnology markets for use in drug development,<br />
formulation testing, and quality control. The SX20 and<br />
LKS.60 spectrometers are established leaders for stoppedflow<br />
and laser-flash research in the academic market, addressing<br />
applications in protein structure, folding, and conformation,<br />
together with biomolecular reaction kinetics and<br />
the study of chemical reaction mechanisms.<br />
Major Products/Services<br />
Chirascan , Chirascan -plus and Chirascan -plus ACD<br />
spectrometers (CD)<br />
Outstanding sensitivity, novel detection technology, powerful<br />
software and now automation combine to make these<br />
CD spectrometers the world’s most advanced.<br />
SX20 stopped-flow spectrometer<br />
The SX20 is the market-leading stopped-flow reaction analyser<br />
capable of measuring fast reactions with a minimum of<br />
material.<br />
LKS.60 nanosecond laser-flash photolysis<br />
spectrometer<br />
The LKS.60 offers unmatched sensitivity<br />
for single and multiwavelength kinetics<br />
of very short-lived species, such as free<br />
radicals and excited-state species.<br />
RX.2000 rapid-mixing stopped-flow<br />
unit<br />
Adds stopped-flow rapid reaction kinetics<br />
to any UV-visible spectrometer or fluorometer.<br />
Pro-Data software<br />
All our products use a common software<br />
suite giving cross-platform compatibility.<br />
Accessories<br />
With all products, a wide range of accessories<br />
is available to expand the system<br />
as research interests evolve.<br />
Customer Support<br />
Support is provided for the lifetime of<br />
the product and every instrument comes<br />
with a warranty of at least 12 months<br />
that can be easily extended. A worldclass<br />
service team is on hand for support<br />
and applications advice.<br />
Facilities<br />
Headquartered close to London, UK. See<br />
www.photophysics.com/agents.php for<br />
worldwide distribution network.
40 SPECTROSCOPY CORPORATE CAPABILITIES DECEMBER 2010<br />
Avantes, Inc.<br />
www.spectroscopyonline.com<br />
Avantes, Inc.<br />
9769 W. 119th Ave, Suite 4<br />
Broomfield, CO 80021<br />
TELEPHONE<br />
(303) 410-8668<br />
FAX<br />
(303) 410-8669<br />
E-MAIL<br />
infoUSA@avantes.com<br />
WEB SITE<br />
www.avantes.com<br />
NUMBER OF EMPLOYEES<br />
40<br />
YEAR FOUNDED<br />
1993<br />
Company Description<br />
Avantes is a leading innovator<br />
in the development and<br />
application of miniature<br />
spectrometers. Avantes<br />
continues to develop and<br />
introduce new instruments<br />
for fiber optic spectroscopy<br />
to meet our customer’s application<br />
needs. Avantes instruments<br />
and accessories<br />
are also deployed into a<br />
variety of OEM applications<br />
in a variety of industries in<br />
markets throughout the world. With more than 15 years of<br />
experience in fiber optic spectroscopy and thousands of instruments<br />
in the field, Avantes is eager to help our customers<br />
find their Solutions in <strong>Spectroscopy</strong> ® .<br />
Chief Spectroscopic Techniques Supported<br />
⦁ UV/VIS/NIR <strong>Spectroscopy</strong><br />
⦁ Process Control<br />
⦁ Absorbance/Transmittance/Reflectance<br />
⦁ Laser-Induced Breakdown <strong>Spectroscopy</strong><br />
⦁ CIE Color <strong>Spectroscopy</strong><br />
⦁ Portable Spectrometers<br />
⦁ Fluorescence <strong>Spectroscopy</strong><br />
⦁ Custom Applications<br />
⦁ Irradiance<br />
⦁ Raman <strong>Spectroscopy</strong><br />
⦁ OEM Application Development<br />
Markets Served<br />
Avantes works with customers in a variety of markets, including<br />
chemical, biomedical, aerospace, semiconductor,<br />
gemological, paper, pharmaceutical, and food processing<br />
technology. Additionally, Avantes works with research organizations<br />
and universities, aiding in developing research,<br />
and teaching opportunities. Our OEM program is designed<br />
to work with our customers to identify needs and customize<br />
an Avantes’ spectroscopy solution based on our customer’s<br />
needs and Avantes technical experience. Avantes’<br />
continued growth is based upon a commitment to<br />
providing exceptional technology and superb customer<br />
satisfaction.<br />
Major Products/Services<br />
Low-cost, high-resolution, miniature fiber optic spectrometers:<br />
System solutions and OEM instruments for applications<br />
from 185 nm to 2,500 nm.<br />
Detector choices: PDA, CMOS, CCD,<br />
back-thinned CCD, and InGaAs.<br />
Optical benches with focal lengths of 45,<br />
50 or 75 mm: revolutionary new ultra-low<br />
straylight optimized optical bench (ULS)<br />
and a new high sensitivity optical bench.<br />
Other features: 14 and 16 bit A/D converters,<br />
TE cooling, multi-channel instrument<br />
configurations enabling simultaneous<br />
signal acquisition, USB2 communication,<br />
support for multiple instruments from a<br />
single computer, and 14 programmable<br />
digital I/O ports.<br />
Standard Application Solutions:<br />
Irradiance and LED measurements, gemology,<br />
chemometric analysis, thin-film<br />
measurement, color, fluorescence, laserinduced<br />
breakdown spectroscopy, Raman<br />
spectroscopy, and process control.<br />
Light Sources:<br />
Tungsten-halogen, deuterium, LED, xenon,<br />
calibration sources for wavelength, and<br />
irradiance.<br />
<strong>Spectroscopy</strong> Accessories:<br />
Standard and custom fiber optic cables<br />
and probes, integrating spheres, cuvette<br />
holders, flow cells, collimating lenses, cosine<br />
correctors, vacuum feedthroughs, and<br />
fiber optic multiplexer.<br />
Facilities<br />
Avantes engineering manufacturing, sales,<br />
and service headquarters is in the Netherlands.<br />
The company also operates direct<br />
offices in China and North America. In addition,<br />
Avantes has a growing worldwide<br />
distribution network of more than 35<br />
qualified distributors to meet our customer’s<br />
needs worldwide.
www.spectroscopyonline.com DECEMBER 2010 SPECTROSCOPY CORPORATE CAPABILITIES 41<br />
B&W Tek, Inc.<br />
⦁ Lab Grade & Field Portable Raman<br />
Systems<br />
⦁ Customized design & development<br />
services<br />
⦁ Customized photonic instrumentation<br />
manufacturing<br />
Facilities<br />
B&W Tek, Inc. has 3 facilities in the<br />
United States, and 4 facilities in various<br />
international locations.<br />
Company Description<br />
B&W Tek, Inc. is an advanced instrumentation company<br />
producing optical spectroscopy and laser instrumentation<br />
for biomedical, physical, chemical, and research communities.<br />
With a strong vertical integration capability, B&W Tek,<br />
Inc. also provides custom product development, design, and<br />
manufacturing.<br />
B&W Tek, Inc.<br />
19 Shea Way<br />
Newark, DE 19713<br />
TELEPHONE<br />
(302) 368-7824<br />
FAX<br />
(302) 368-7830<br />
E-MAIL<br />
sales@bwtek.com<br />
WEB SITE<br />
www.bwtek.com<br />
NUMBER OF EMPLOYEES<br />
USA: 80<br />
Elsewhere: 100<br />
YEAR FOUNDED<br />
1997<br />
Chief Spectroscopic Techniques Supported<br />
⦁ UV<br />
⦁ Visible<br />
⦁ NIR<br />
⦁ Raman<br />
⦁ Laser<br />
⦁ Microscopy<br />
Markets Served<br />
B&W Tek, Inc. provides solutions for analytical, industrial,<br />
medical, biophotonic, and diagnostic applications. The<br />
markets we serve include: universities, research labs,<br />
industries, oil and refining facilities, paper production,<br />
optical products manufacturers, drug and agricultural,<br />
health care, process analysis, and gemological research<br />
and development.<br />
Major Products/Services<br />
⦁ Fiber Coupled Spectrometer Modules<br />
⦁ DPSS Lasers
42 SPECTROSCOPY CORPORATE CAPABILITIES DECEMBER 2010<br />
BaySpec, Inc.<br />
www.spectroscopyonline.com<br />
BaySpec, Inc.<br />
1101 McKay Drive,<br />
San Jose, CA 95131<br />
TELEPHONE<br />
(408) 512-5928<br />
FAX<br />
(408) 512-5929<br />
E-MAIL<br />
sales@bayspec.com<br />
WEB SITE<br />
www.bayspec.com<br />
NUMBER OF EMPLOYEES<br />
USA: 50-100<br />
YEAR FOUNDED<br />
1999<br />
Company Description<br />
BaySpec, Inc., founded in 1999 with 100% manufacturing in<br />
the USA (San Jose, California), is a vertically integrated spectral<br />
sensing company. The company designs, manufactures,<br />
and markets advanced spectral instruments, from UV-VIS-NIR<br />
spectrometers to handheld and portable NIR and Raman<br />
analyzers for a diverse customer base around the world.<br />
The telecommunication market “boom and bust” has produced<br />
an array of components and technologies, which collectively<br />
for the first time in instrumentation history, realized<br />
the dream of a low-cost yet highly accurate spectral device.<br />
Out of the ashes comes new growth. Stemming from Bay-<br />
Spec’s revolutionary Volume Phase Gratings (VPG ® ) -based<br />
telecom modules, customers in optical test & measurement,<br />
fiber sensing, UV-VIS-NIR and Raman spectroscopy, are benefiting<br />
and building innovative systems to meet the world’s<br />
most current optical system challenges.<br />
While our customer base already spans from the traditional<br />
areas of optical telecommunication and NIR spectroscopy,<br />
we are changing and revolutionizing the way of Raman, Fluorescence,<br />
absorption/reflection, handheld, and OCT spectroscopic<br />
instruments are applied.<br />
Chief Spectroscopic Techniques Supported<br />
⦁ UV-VIS-NIR spectroscopy<br />
⦁ Raman spectroscopy<br />
Markets Served<br />
⦁ Biomedical<br />
⦁ Pharmaceuticals<br />
⦁ Chemical<br />
⦁ Food<br />
⦁ Semiconductor<br />
⦁ Industrial controls<br />
⦁ Homeland security<br />
⦁ Fiber sensing<br />
⦁ Optical telecommunications<br />
Major Products/Services<br />
⦁ The SuperGamut spectrometer series<br />
employ high efficiency volume phase<br />
grating (VPG) as the spectral dispersion<br />
element and high sensitivity detector<br />
arrays. Customized wavelength ranges<br />
are available from 190–2500 nm.<br />
⦁ BaySpec’s Raman products include<br />
OEM spectrographs, narrowband light<br />
sources, deep-cooled detector arrays,<br />
and wavelength optimized probes.<br />
Raman Micro<strong>Spectroscopy</strong> offerings include<br />
the Nomadic 3-wavelength (532,<br />
785, 1064 nm) microscope and the<br />
cost-effective MovingLab portable Raman<br />
microscope.<br />
⦁ UV-VIS-NIR spectrographs and spectrometers<br />
⦁ Handheld/Portable/Benchtop Raman<br />
Instruments<br />
⦁ Narrowband and Wideband Light<br />
Sources<br />
⦁ Fiber Optic Probes<br />
⦁ Fiber Optic Accessories<br />
⦁ Raman microscopes<br />
⦁ Hyperspectral imaging<br />
Facilities<br />
48,000 sq. ft,. facility in San Jose, California<br />
(Silicon Valley).
www.spectroscopyonline.com DECEMBER 2010 SPECTROSCOPY CORPORATE CAPABILITIES 43<br />
Bruker Corporation<br />
⦁ Electron paramagnetic resonance<br />
(EPR)<br />
⦁ Magnetic resonance imaging (MRI)<br />
⦁ Low resolution benchtop NMR<br />
analyzers<br />
⦁ X-ray crystallography (SC-XRD)<br />
⦁ X-ray diffraction (XRD)<br />
⦁ X-ray fluorescence (XRF)<br />
⦁ Handheld X-ray (XRF) spectrometers<br />
⦁ X-ray microanalysis (EDS, EBSD)<br />
⦁ Optical emission spectroscopy (OES)<br />
⦁ CS/ONH-Analysis<br />
⦁ Atomic force microscopy (AFM)<br />
⦁ Scanning probe microscopy (SPM)<br />
⦁ Stylus and optical metrology<br />
Bruker Corporation<br />
40 Manning Road<br />
Billerica, MA 01821<br />
TELEPHONE<br />
(978) 663-3660<br />
FAX<br />
(978) 667-5993<br />
E-MAIL<br />
info@bruker.com<br />
WEB SITE<br />
www.bruker.com<br />
Company Description<br />
The Bruker name has become synonymous with the excellence,<br />
innovation, and quality that characterizes our comprehensive<br />
range of scientific instrumentation. Our solutions<br />
encompass a wide number of analytical techniques ranging<br />
from magnetic resonance to mass spectrometry, to optical<br />
and X-ray spectroscopy.<br />
These market- and technology-leading products are driving<br />
and facilitating many key application areas such as life<br />
science research, pharmaceutical analysis, applied analytical<br />
chemistry applications, materials research and nanotechnology,<br />
clinical research, molecular diagnostics, and homeland<br />
defense.<br />
Visit our website to discover more about our technologies<br />
and solutions.<br />
Bruker — Innovation with Integrity!<br />
Chief Spectroscopic Techniques Supported<br />
⦁ FT-infrared spectroscopy and microscopy (FT-IR)<br />
⦁ FT-near infrared spectroscopy (FT-NIR)<br />
⦁ Raman spectroscopy and microscopy<br />
⦁ Terahertz spectroscopy and imaging<br />
⦁ Liquid chromatography–mass spectrometry (LC–MS)<br />
⦁ FT-mass spectrometry (FTMS)<br />
⦁ MALDI-TOF (/TOF) mass spectrometry<br />
⦁ Inductively coupled plasma mass spectrometry (ICP-MS)<br />
⦁ Gas chromatography–mass spectrometry (GC–MS)<br />
⦁ Ion mobility spectrometry (OMS)<br />
⦁ Nuclear magnetic resonance (NMR)
44 SPECTROSCOPY CORPORATE CAPABILITIES DECEMBER 2010<br />
CVI Melles Griot<br />
www.spectroscopyonline.com<br />
CVI Melles Griot Lasers<br />
2051 Palomar Airport Road, 200<br />
Carlsbad, CA 92011<br />
TELEPHONE<br />
(760) 438-2131<br />
E-MAIL<br />
lasers@cvimellesgriot.com<br />
CVI Melles Griot<br />
Optics & Assemblies:<br />
200 Dorado Place SE<br />
Albuquerque, NM 87123<br />
TELEPHONE<br />
(505) 296-9541<br />
E-MAIL<br />
optics@cvimellesgriot.com<br />
WEB SITE<br />
www.cvimellesgriot.com<br />
ASIA<br />
+81 3 3407-3614<br />
EUROPE<br />
+31 316 333 041<br />
Company<br />
Description<br />
CVI Melles Griot is a<br />
leading global supplier of<br />
OEM and fast turn catalog<br />
photonics products<br />
including lasers at over<br />
38 wavelengths, optics,<br />
coatings covering the<br />
deep ultraviolet to the<br />
infrared, opto-mechanics,<br />
and positioning equip-<br />
ment. The company’s unique breadth of manufacturing and<br />
design expertise in electronics, lasers, optics, coatings, and<br />
thermal management is evident in everything from simple<br />
components to precision integrated electro-optic assemblies.<br />
Chief Spectroscopic Techniques Supported<br />
⦁ <strong>Spectroscopy</strong>; Microscopy<br />
⦁ Capillary electrophoresis<br />
⦁ Biotech/Medical<br />
⦁ Laser-induced fluorescence<br />
⦁ Pharmaceutical<br />
⦁ Particle characterization<br />
⦁ Semiconductor<br />
⦁ Non-contact inspection<br />
⦁ Industrial<br />
⦁ Interferometry<br />
⦁ Environmental<br />
⦁ Velocimetry<br />
⦁ Government/Military<br />
Markets Served<br />
⦁ Design, development, and manufacturing on 3 continents<br />
⦁ Lasers, optics, thin films, mechanics, drive electronics<br />
⦁ Over 39 years of volume production<br />
⦁ Over 2.9 million lasers and 120 million optics shipped<br />
⦁
www.spectroscopyonline.com DECEMBER 2010 SPECTROSCOPY CORPORATE CAPABILITIES 45<br />
Energetiq Technology, Inc.<br />
Major Products/Services<br />
UV-vis, broadband<br />
⦁ Ultra-high brightness, long-life, LDLS<br />
Laser-Driven Light Sources:<br />
EQ-99 (compact, economical, high<br />
brightness)<br />
EQ-1000 (high power, high brightness)<br />
EQ-1500/1510 (extreme high brightness)<br />
Energetiq Technology, Inc.<br />
7 Constitution Way<br />
Woburn, MA 01801<br />
TELEPHONE<br />
(781) 939-0763<br />
FAX<br />
(781) 939-0769<br />
E-MAIL<br />
info@energetiq.com<br />
WEB SITE<br />
www.energetiq.com<br />
YEAR FOUNDED<br />
2004<br />
Company Description<br />
Energetiq Technology is a developer and manufacturer of<br />
ultrahigh-brightness light sources that enable the manufacture<br />
and analysis of nano-scale structures and products. Used<br />
in complex scientific and engineering applications such as<br />
analytical instrumentation and leading edge semiconductor<br />
manufacture, Energetiq’s light products are based on new<br />
technology that features broadband output from 170 nm in<br />
the deep UV, through visible and into the infrared.<br />
Energetiq was founded in 2004 by an experienced technology<br />
development team with deep understanding of the high<br />
power plasma physics needed for high performance light<br />
products. This expertise enables Energetiq to provide light<br />
sources with the highest levels of brightness, performance,<br />
and reliability as well as long operating life.<br />
Chief Spectroscopic Techniques Supported<br />
⦁ UV-vis spectrometry<br />
⦁ Soft X-ray microscopy<br />
⦁ Circular dichroism spectroscopy<br />
⦁ High performance liquid chromatography (HPLC)<br />
⦁ Water-window microscopy<br />
Markets Served<br />
Energetiq’s light sources are used for: analytical spectroscopy,<br />
microscopy, and biological imaging in the life-sciences;<br />
lithography, metrology, inspection, resist and thin-film processing<br />
of semiconductors, displays, and storage devices; soft<br />
X-ray microscopy; and a variety of R&D applications where traditional<br />
arc-lamps and synchrotron radiation have commonly<br />
been used.<br />
Facilities<br />
Energetiq Technology provides local sales<br />
and service support through its technical<br />
staff in the Woburn, Massachusetts headquarters<br />
and representatives and distributors<br />
in Asia, ensuring quick turnaround for<br />
customers. In addition, the Massachusetts<br />
location has a clean manufacturing facility<br />
that provides Class 1000 assembly capability<br />
for optics assembly and manufacturing<br />
for LDLS products.
46 SPECTROSCOPY CORPORATE CAPABILITIES DECEMBER 2010<br />
EDAX, Inc.<br />
www.spectroscopyonline.com<br />
EDAX, Inc.<br />
91 McKee Drive<br />
Mahwah, NJ 07430<br />
TELEPHONE<br />
(201) 529-4880<br />
FAX<br />
(201) 529-3156<br />
E-MAIL<br />
info.edax@ametek.com<br />
WEB SITE<br />
www.edax.com<br />
YEAR FOUNDED<br />
1962<br />
Company Description<br />
EDAX, Inc. is an ISO-9001 certified manufacturer with over<br />
45 years of experience building instrumentation for the<br />
elemental and structural analysis of materials. EDAX’s founding<br />
technology was the detection and measurement of<br />
fluorescent X-rays for qualitative and quantitative elemental<br />
analysis — for example, elemental analysis on electron beam<br />
microscopes. Since that time, EDAX has sought to expand<br />
our product offering through new technologies and complementary<br />
techniques to provide our customers with the latest<br />
analytical instrumentation available. EDAX continues to be<br />
the world leader in the X-ray microanalysis market while<br />
providing new products for micro X-ray fluorescence and<br />
electron backscatter diffraction.<br />
Chief Spectroscopic Techniques Supported<br />
⦁ Energy Dispersive <strong>Spectroscopy</strong><br />
⦁ Energy Dispersive X-ray Fluorescence<br />
⦁ Electron Back Scatter Diffraction<br />
⦁ Wavelength Dispersive <strong>Spectroscopy</strong><br />
Markets Served<br />
EDAX instrumentation for elemental and structural analysis<br />
is found in a broad spectrum of industrial, academic, and<br />
government applications from the field or warehouse to the<br />
most advanced research & development laboratory. Typical<br />
markets served include semiconductor and microelectronics,<br />
academic, and industrial R&D laboratories,<br />
ROHS/WEEE, renewable energy,<br />
pharmaceuticals, mining, security, forensics,<br />
catalysts, petrochemicals, metallurgy,<br />
and manufacturing operations.<br />
Major Products/Services<br />
⦁ Energy Dispersive X-ray Fluorescence:<br />
EDAX manufactures micro XRF<br />
analyzers for the laboratory.<br />
⦁ Electron BackScatter Diffraction:<br />
EDAX supplies instrumentation for<br />
materials structural analysis on SEM<br />
electron-beam microscopes.<br />
⦁ Energy Dispersive <strong>Spectroscopy</strong>:<br />
EDAX provides a full range of EDS<br />
products for elemental analysis on<br />
SEM and TEM electron-beam microscopes.<br />
⦁ Wavelength Dispersive <strong>Spectroscopy</strong>:<br />
EDAX offers parallel beam WDS<br />
products for elemental analysis on<br />
SEM electron-beam microscopes.<br />
⦁ Fluorescent X-ray Detectors: EDAX supplies<br />
Si(Li) Detectors and Silicon Drift<br />
Detectors, which are capable of<br />
handling count rates of over<br />
1,000,000 cps and parallel beam<br />
wavelength dispersive spectrometers.<br />
Facilities<br />
EDAX headquarters is located in Mahwah,<br />
New Jersey, housing sales, technical<br />
support, and manufacturing operations.<br />
EDAX is committed to providing the best<br />
possible support for our customers worldwide<br />
with sales, service, and applications<br />
support offices located in Japan, China,<br />
Singapore, The Netherlands, Germany,<br />
UK, and the United States.
Orbis Puts a New Spin on<br />
Micro XRF Analysis Versatility<br />
Non-Destructive<br />
Micro to Millimeter<br />
Spot Elemental Analysis<br />
Using Primary Beam<br />
Filters on a Wide Range<br />
of Sample Types<br />
Forensics<br />
Trace Evidence, Solids, Residues,<br />
Powders, Liquids<br />
Industrial<br />
RoHS-WEEE, Quality Control, Failure Analysis,<br />
Coating Thickness/Composition<br />
Antiquities/Museum<br />
Artifact Authentication, Gemstones, Documents<br />
For more information on the Orbis Micro-XRF System<br />
visit our web site at www.EDAX.com/newxrf<br />
or call 1-800-535-EDAX.
48 SPECTROSCOPY CORPORATE CAPABILITIES DECEMBER 2010<br />
Environmental Express<br />
www.spectroscopyonline.com<br />
Environmental Express<br />
490 Wando Park Boulevard<br />
Mount Pleasant, SC 29464<br />
TELEPHONE<br />
1 (800) 343-5319<br />
(843) 881-6560<br />
FAX<br />
(843) 881-3964<br />
E-MAIL<br />
info@environmentalexpress.com<br />
WEB SITE<br />
www.environmentalexpress.com<br />
NUMBER OF EMPLOYEES<br />
50<br />
YEAR FOUNDED<br />
1988<br />
Company Description<br />
Environmental Express is a leading developer, manufacturer,<br />
and distributor of environmental laboratory equipment<br />
and consumable supplies for commercial, governmental,<br />
industrial, and academic laboratories worldwide.<br />
The company provides an entire range of laboratory products<br />
used in applications such as water/wastewater analysis,<br />
oil and grease analysis, <strong>metals</strong> analysis, and hazardous<br />
waste analysis. We pride ourselves on providing innovative<br />
products, superior technical support, knowledgeable customer<br />
service, and same day shipping.<br />
Chief Spectroscopic Techniques Supported<br />
Various EPA Methodologies for GC, GC-MS and HPLC analytical<br />
techniques.<br />
Markets Served<br />
⦁ Organics Laboratories<br />
⦁ Academic Laboratories<br />
⦁ Metals Laboratories<br />
⦁ Pharmaceutical<br />
⦁ Life Sciences<br />
⦁ Refining and Petrochemicals<br />
Major Products/Services<br />
Environmental Express offers a full line<br />
of equipment and consumables to<br />
support EPA methodologies to include<br />
soil and liquid extraction equipment and<br />
analytical consumables.<br />
⦁ StepSaver for solid phase extraction<br />
⦁ Soil Extraction Cell, an alternative to<br />
the microwave for EPA Method 3546<br />
using a HotBlock and stainless steel<br />
Soil Extraction Cells<br />
⦁ SGE syringes, columns, inlet liners,<br />
and electron multipliers<br />
⦁ MicroLiter AutoSampler Vials<br />
⦁ Soxhlet Extraction Thimbles<br />
⦁ 3m Empore Disks<br />
⦁ Color-Coded Surrogates for BNAs<br />
⦁ Field Sampling Kits<br />
⦁ Organic Standards<br />
Facilities<br />
Our manufacturing and distribution facility<br />
occupies three buildings in Mount<br />
Pleasant, South Carolina. The campus<br />
also houses our sales and marketing,<br />
customer service, research and development,<br />
finance and executive teams.
www.spectroscopyonline.com DECEMBER 2010 SPECTROSCOPY CORPORATE CAPABILITIES 49<br />
Enwave Optronics, Inc.<br />
⦁ MicroSense Series for Raman microscopy<br />
applications<br />
⦁ Frequency-Stabilized Lasers<br />
⦁ Customized Raman Solutions<br />
⦁ OEM Products<br />
Facilities<br />
Enwave’s engineering, sales, manufacturing,<br />
and services office is located in<br />
Irvine, California. We also have partners<br />
and distributors in North America, Europe,<br />
Asia, Latin America, and Australia<br />
to meet the needs of our international<br />
customers.<br />
Enwave Optronics, Inc.<br />
18200 W. McDurmott Street,<br />
Suite A<br />
Irvine, CA 92614<br />
TELEPHONE<br />
(949) 955-0258<br />
FAX<br />
(949) 955-0259<br />
E-MAIL<br />
info@enwaveopt.com<br />
WEB SITE<br />
www.enwaveopt.com<br />
NUMBER OF EMPLOYEES<br />
US: 8<br />
Outside the US: 15<br />
YEAR FOUNDED<br />
2003<br />
Company Description<br />
Enwave Optronics, Inc. is an innovative leader in high performance<br />
and affordable Raman spectroscopy solutions.<br />
The Enwave engineering team has extensive knowledge<br />
in diode laser optical systems and Raman spectroscopy<br />
instrumentation. We specialize in providing solutions for<br />
Raman applications that other vendors are unable to solve.<br />
We provide full design, prototyping, R&D, manufacturing,<br />
and technical support. We are committed to assisting you<br />
resolve your most challenging application needs and to<br />
providing you with the best performance and quality solutions<br />
at the most affordable prices.<br />
Chief Spectroscopic Techniques Supported<br />
⦁ Raman spectroscopy<br />
Markets Served<br />
Enwave’s instruments can be found and utilized for a wide<br />
range of applications and in a variety of industries such<br />
as: education, research, environmental, semiconductor,<br />
pharmaceutical, forensics, chemical, paper and pulp, food<br />
and beverage, biotechnology and life sciences, gemology/<br />
mineralogy, and much more!<br />
Major Products/Services<br />
⦁ EZRaman Series for laboratory and field Raman applications<br />
⦁ ProRaman Series for laboratory, on-line process monitoring,<br />
and other applications requiring high sensitivity
50 SPECTROSCOPY CORPORATE CAPABILITIES DECEMBER 2010<br />
Parker Hannifin Corporation<br />
Filtration and Separation Division<br />
www.spectroscopyonline.com<br />
Parker Hannifin<br />
Corporation<br />
Filtration and Separation<br />
Division<br />
242 Neck Road<br />
Haverhill, MA 01835<br />
TELEPHONE<br />
(978) 858-0505<br />
FAX<br />
(978) 556-7501<br />
WEB SITE<br />
www.labgasgenerators.com<br />
NUMBER OF EMPLOYEES<br />
55,000<br />
YEAR FOUNDED<br />
1924<br />
Company Description<br />
Safety: Parker Balston gas generators completely eliminate<br />
the safety hazards involved with handling high-pressure gas<br />
cylinders. Enjoy hassle-free automation with no tanks to<br />
change and no downtime.<br />
Reliability: Thousands of laboratories worldwide have Parker<br />
Balston gas generators in routine use. Parker Balston gas<br />
generators are recommended and used by major instrument<br />
manufacturers. We offer the best technology at an affordable<br />
price from the brand you trust.<br />
Quality: Each Parker Balston gas generator is manufactured<br />
under a strict total quality management program. We have a<br />
world-class ISO 9001–certified manufacturing facility in the<br />
United States. All Parker Balston gas generators are backed by<br />
a complete satisfaction guarantee.<br />
Products: Hydrogen gas generators produce 99.99999% pure<br />
hydrogen for gas chromatographs. Zero air generators produce<br />
zero grade air for gas chromatographs. UHP nitrogen generators<br />
produce 99.9999% pure nitrogen for GCs or ICP spectrometers.<br />
FTIR gas generators produce dry, CO 2<br />
-free purge gas<br />
for FTIR spectrometers. Pure air and nitrogen generators produce<br />
dry, ultrapure compressed gas for laboratory instruments,<br />
including LC–MS instruments.<br />
Chief Spectroscopic Techniques Supported<br />
⦁ Optical<br />
⦁ Atomic<br />
⦁ Infrared<br />
⦁ Mass universal<br />
⦁ Hyphenated techniques<br />
Markets Served<br />
⦁ Agriculture<br />
⦁ Biotechnology<br />
⦁ Chemicals<br />
⦁ Chemical and explosives detection<br />
⦁ Energy<br />
⦁ Environmental<br />
⦁ Inorganic chemicals<br />
⦁ Instrument development<br />
⦁ Life science<br />
⦁ Organic chemicals<br />
⦁ Paints and coatings<br />
⦁ Petrochemicals<br />
⦁ Pharmaceuticals<br />
⦁ Plastics<br />
Major Products/Services<br />
Gas generators for the following analytical<br />
instruments:<br />
⦁ Gas chromatographs<br />
⦁ LC–MS<br />
⦁ FTIR spectrometers<br />
⦁ ICP emission spectrometers<br />
⦁ TOC analyzers<br />
⦁ Atomic absorption spectrophotometers<br />
⦁ Nuclear magnetic resonance (NMR)<br />
⦁ Rheometers/thermal analyzers<br />
⦁ Sample evaporators/concentrators<br />
Facilities<br />
Parker Hannifin manufactures all gas<br />
generator products in Haverhill, Massachusetts.<br />
All Parker Balston products are manufactured<br />
in accordance with a strict Total<br />
Quality Management Program, ensuring<br />
top performance and long-term reliability.<br />
Distribution points stretch across the<br />
United States and worldwide, including<br />
Canada, the UK, China, India, Germany,<br />
France, Japan, and Singapore.
www.spectroscopyonline.com DECEMBER 2010 SPECTROSCOPY CORPORATE CAPABILITIES 51<br />
Harrick Scientific Products, Inc.<br />
Harrick Scientific<br />
Products, Inc.<br />
141 Tompkins Ave,<br />
2nd Floor<br />
Pleasantville, NY 10570<br />
TELEPHONE<br />
(800) 248-3847<br />
FAX<br />
(914) 747-7209<br />
E-MAIL<br />
info@harricksci.com<br />
WEB SITE<br />
www.harricksci.com<br />
NUMBER OF EMPLOYEES<br />
21<br />
YEAR FOUNDED<br />
1969<br />
Company Description<br />
Harrick Scientific Products specializes in designing and<br />
manufacturing instruments for optical spectroscopy. Since<br />
being established in 1969, Harrick Scientific has advanced<br />
the frontiers of optical spectroscopy through its innovations<br />
in all spectroscopic techniques. The founder of the company,<br />
Dr. N.J. Harrick, pioneered ATR (attenuated total reflection)<br />
spectroscopy and became the principal developer of this<br />
technique. Harrick Scientific offers a complete selection of<br />
sampling accessories, including both standard and custom designs,<br />
as well as an extensive line of optical elements.<br />
Chief Spectroscopic Techniques Supported<br />
⦁ Transmission<br />
⦁ Specular reflection<br />
⦁ Diffuse reflection<br />
⦁ ATR<br />
⦁ Fiberoptics<br />
Markets Served<br />
Harrick Scientific serves analytical markets worldwide. Harrick’s<br />
customers typically are from research or quality control<br />
laboratories of industrial, governmental, research, and academic<br />
institutions throughout the world. Industries served<br />
include chemical, electronic, pharmaceutical, forensics, and<br />
biomedical.<br />
Major Products/Services<br />
Harrick Scientific offers the most complete<br />
line of spectroscopy sampling products,<br />
including:<br />
⦁ Video Meridian — a diamond micro ATR<br />
accessory with built-in camera<br />
⦁ MVP Pro Star — an affordable<br />
monolithic diamond ATR accessory<br />
⦁ Praying Mantis — a diffuse reflectance<br />
accessory available with environmental<br />
chambers/reaction cells<br />
⦁ Seagull — a variable angle specular<br />
reflection and ATR accessory<br />
⦁ VariGATR — a variable angle grazing<br />
angle ATR accessory for monolayers on<br />
Gold and Silicon substrates<br />
⦁ FiberMate 2 — an interface between<br />
spectrometers and fiberoptic applications<br />
⦁ MultiLoop, Omni-Diff, and<br />
Omni-Spec — fiberoptic probes for ATR,<br />
diffuse reflection, and specular<br />
reflection<br />
⦁ A variety of liquid and gas transmission<br />
cells<br />
⦁ Custom design development<br />
Facilities<br />
Harrick Scientific Products is located 30<br />
miles north of New York City in Pleasantville,<br />
New York. Our products are also<br />
available through FT-IR and UV-Vis spectrometer<br />
manufacturers, as well as distributors<br />
in the United States and throughout<br />
the world.
52 SPECTROSCOPY CORPORATE CAPABILITIES DECEMBER 2010<br />
Hellma USA, Inc.<br />
www.spectroscopyonline.com<br />
Hellma USA, Inc.<br />
80 Skyline Drive<br />
Plainview, NY 11803<br />
TELEPHONE<br />
(516) 939-0888<br />
WEB SITE<br />
www.hellmausa.com<br />
YEAR FOUNDED<br />
1922<br />
Company Description<br />
Hellma GmbH & Co., founded in<br />
1922, is the world market leader in<br />
cells, fiber optic probes, and optical<br />
components made of glass or quartz<br />
which are used for modern optical<br />
analysis. Hellma products are available<br />
worldwide through a network<br />
of Hellma sister companies and additional<br />
distribution agents.<br />
Major Products/Services<br />
Custom Designed Products<br />
In addition to the large range of<br />
standard products, Hellma also<br />
manufactures special cells and other<br />
precision optical parts according<br />
to customer’s specifications. Hellma has more than 85 years<br />
experience in the field of glass machining and fabrication. Our<br />
specialists can carry out complex tasks and give full and competent<br />
advice regarding design ideas and any alternative possibilities.<br />
Analysis in space — processing at the cutting edge<br />
of technology<br />
A close collaboration with research institutes, universities,<br />
and scientific institutions is important for Hellma’s outstanding<br />
engineering competence. Based on this extensive<br />
know-how in processing techniques, Hellma is able to find<br />
unique solutions. Excellent examples of achievements are the<br />
individually designed, custom-made cells being used in the<br />
International Space Station (ISS) or those which were used in<br />
physics research that led to the winning of the Nobel Prize in<br />
1997 and 2001.<br />
The TrayCell — Fiber-optic ultra-micro cells for UV/Vis analysis<br />
Even in classical analysis the specialists at Hellma are always setting<br />
new standards. One of the most recent examples: the fiberoptic<br />
ultra-micro measuring cell “TrayCell,” which allows accurate<br />
analysis of DNA, RNA, or proteins in sample volumes of as low as<br />
0.7 μl. The dimensions of the TrayCell are equivalent to a standard<br />
cell in order to work in all common spectrophotometers.<br />
Features:<br />
⦁ Unique fiber optic ultra-micro measuring cell<br />
⦁ Works with 0.7–5 μl sample volume<br />
⦁ A single drop measuring sample is sufficient<br />
⦁ High precision and reproducibility<br />
⦁ Dilution is not necessary<br />
accredited DKD calibration laboratory<br />
of Hellma<br />
With the accreditation according to DIN<br />
EN ISO 17025, Hellma is one of the leading<br />
accredited calibration laboratories<br />
that produce and certify liquid and glass<br />
calibration filters made for testing spectrophotometers.<br />
Increased security and quality<br />
demands among laboratories require<br />
an improved traceability of measurement<br />
results to an internationally approved standard.<br />
An accreditation according to DIN EN<br />
ISO 17025 ensures the traceability of calibrations<br />
carried out to references of the<br />
NIST, by which an international correlation<br />
of measurement results is assured. Thus<br />
procedures in laboratories gain greater<br />
transparency and improved protection of<br />
their measurement results.<br />
Modern Flow Cytometry requires<br />
highest standards<br />
The heart of every flow cytometer is a<br />
small quartz glass flow channel providing<br />
reliable stability of the fluidic system and<br />
precise optical analysis of single cells. Due<br />
to sophisticated technologies Hellma is<br />
able to manufacture customer specified<br />
channel dimensions down to 50 μm ×<br />
50 μm with any outside dimension and<br />
highly polished surfaces.<br />
Fiber–optical systems<br />
The development of fiber-optical systems<br />
has caused a small revolution in chemical<br />
analysis. This technology makes it possible<br />
to carry out photometric measurements<br />
not only under laboratory conditions with<br />
cells, but also outside the lab. Through<br />
the development of fiber-optic probes,<br />
analysis has moved directly to the process<br />
for measurements with continuous measurements<br />
possible without sampling. This<br />
allows for better control of ongoing processes<br />
with much less effort.<br />
Complete traceability and excellent reliability of measurement<br />
results — with UV/Vis calibration standards from the
www.spectroscopyonline.com DECEMBER 2010 SPECTROSCOPY CORPORATE CAPABILITIES 53<br />
HORIBA Scientific<br />
⦁ Metals, plastics, polymers, etc.<br />
⦁ Optoelectronics<br />
⦁ Petroleum<br />
⦁ Pharmaceuticals<br />
⦁ Semiconductors<br />
HORIBA Scientific<br />
3880 Park Avenue<br />
Edison, NJ 08820<br />
TELEPHONE<br />
(732) 494-8660<br />
FAX<br />
(732) 494-5125<br />
E-MAIL<br />
info.sci@horiba.com<br />
WEB SITE<br />
www.horiba.com/scientific<br />
NUMBER OF EMPLOYEES<br />
USA: 600<br />
Elsewhere: 5000<br />
YEAR FOUNDED<br />
1819<br />
Company Description<br />
HORIBA Scientific is a leading manufacturer of innovative<br />
spectroscopic systems and components, and we are committed<br />
to serving our customers with superior products and<br />
technical support in optical spectroscopy.<br />
HORIBA Scientific is part of the HORIBA Group, which employs<br />
5,000 people worldwide, with annual sales in excess of<br />
$1.5 billion. HORIBA Jobin Yvon, Sofie, Dilor, Spex®, and IBH<br />
are some of our well-known and respected brand names.<br />
Chief Spectroscopic Techniques Supported<br />
⦁ Molecular fluorescence spectroscopy<br />
⦁ Optical spectroscopy<br />
⦁ Raman spectroscopy and microscopy<br />
⦁ Ellipsometry and thin-film analysis<br />
⦁ Atomic emission spectroscopy<br />
⦁ Fluorescence<br />
⦁ Forensic science<br />
Markets Served<br />
⦁ Academia<br />
⦁ Coatings<br />
⦁ Environmental<br />
⦁ Forensic science<br />
⦁ Life sciences<br />
⦁ Medical<br />
Major Products/Services<br />
⦁ <strong>Spectroscopy</strong> and analysis<br />
⦁ Elemental analyzers<br />
⦁ Ellipsometers<br />
⦁ End-point detectors<br />
⦁ Fluorescence<br />
⦁ Gratings<br />
⦁ ICP & GD spectrometers<br />
⦁ Lifetime fluorescence<br />
⦁ Microscopy<br />
⦁ OEM components<br />
⦁ Particle-size analyzers<br />
⦁ Process control<br />
⦁ Raman & FT-IR<br />
⦁ Spectrographs<br />
⦁ Spectrometers and CCDs<br />
⦁ VUV equipment<br />
⦁ X-Ray fluorescence<br />
⦁ Surface Plasmon Resonance Imaging<br />
(SPRi)<br />
⦁ Particle-size systems<br />
Facilities<br />
HORIBA Scientific manufactures quality<br />
instruments in Edison, New Jersey, as well<br />
as France and Japan.<br />
Sales, service, and applications facilities<br />
are located around the world. We are an<br />
ISO 9001:2008-certified company.
54 SPECTROSCOPY CORPORATE CAPABILITIES DECEMBER 2010<br />
www.spectroscopyonline.com<br />
International Centre for Diffraction Data<br />
is a powerful tool for phase identification<br />
using physical, chemical, and crystallographic<br />
data. It contains numerous<br />
features such as 301,282 data sets, digitized<br />
patterns, molecular graphics, and<br />
atomic parameters. Many new features<br />
have been incorporated into PDF-4+ to<br />
enhance the ability to do quantitative<br />
analysis by any of three methods: Rietveld<br />
analysis, reference intensity ratio<br />
(RIR) method, or total pattern analysis.<br />
PDF-4+ also features electron diffraction<br />
simulations based on atomic structure<br />
and electron diffraction scattering factors<br />
on >270,000 data sets.<br />
International Centre for<br />
Diffraction Data<br />
12 Campus Boulevard<br />
Newtown Square, PA 19073<br />
TELEPHONE<br />
(610) 325-9814<br />
FAX<br />
(610) 325-9823<br />
E-MAIL<br />
info@icdd.com<br />
WEB SITE<br />
www.icdd.com<br />
NUMBER OF EMPLOYEES<br />
40<br />
YEAR FOUNDED<br />
1941<br />
Company Description<br />
ICDD, a not-for-profit corporation, is dedicated to the collecting,<br />
editing, and publishing of the Powder Diffraction<br />
File (PDF ® ). Our mission is to continue to be the world<br />
center for quality diffraction and related data to meet the<br />
needs of the technical community. ICDD promotes the<br />
application of materials characterization methods in science<br />
and technology by providing forums for the exchange<br />
of ideas and information, which includes sponsoring the<br />
Denver X-ray Conference; Advances in X-ray Analysis;<br />
and Powder Diffraction. ICDD and its members conduct<br />
workshops and clinics on materials characterization at our<br />
headquarters in Pennsylvania and at global X-ray analysis<br />
conferences.<br />
Chief Spectroscopic Techniques Supported<br />
⦁ X-ray diffraction<br />
⦁ Electron diffraction<br />
⦁ Electron backscatter diffraction<br />
Markets Served<br />
The Powder Diffraction File is designed for materials identification<br />
and characterization. ICDD databases are used<br />
worldwide by scientists in academia, government, and industry<br />
who are actively engaged in the field of X-ray powder<br />
diffraction and related disciplines.<br />
Major Products/Services<br />
PDF-4+ 2010 is our advanced database with comprehensive<br />
material coverage for inorganic materials. The database
www.spectroscopyonline.com DECEMBER 2010 SPECTROSCOPY CORPORATE CAPABILITIES 55<br />
Inorganic Ventures<br />
development, textile, transportation, and<br />
wastewater treatment, to name a few.<br />
Inorganic Ventures<br />
300 Technology Drive<br />
Christiansburg, VA 24073<br />
TELEPHONE<br />
(800) 669-6799 (US &<br />
Canada)<br />
(540) 585-3030<br />
FAX<br />
(540) 585-3012<br />
E-MAIL<br />
info@inorganicventures.com<br />
WEB SITE<br />
inorganicventures.com<br />
YEAR FOUNDED<br />
1985<br />
Company Description<br />
Inorganic Ventures is the only standard manufacturer to specialize<br />
in the formulation of custom inorganic solutions. We<br />
excel in providing service and support tailored to your specific<br />
needs. In short, we flex to your specs.<br />
Our specialization in custom blending means that we can<br />
create precise standards faster than other manufacturers. Over<br />
99% of our custom blends ship within five business days or<br />
less. In addition to customization, we offer a wide selection<br />
of stock inorganic standards. Contact us to receive our new<br />
catalog.<br />
For nearly a decade, Inorganic Ventures has been registered<br />
to ISO Guide 34, ISO/IEC 17025, and ISO 9001 by A2LA<br />
and QMI.<br />
Chief Spectroscopic Techniques Supported<br />
⦁ ICP-OES/AES<br />
⦁ ICP-MS<br />
⦁ IC<br />
⦁ AA<br />
⦁ GFAA<br />
⦁ DCP<br />
Markets Served<br />
We provide custom and conventional certified reference<br />
materials for dozens of markets, including aeronautical, agricultural,<br />
automotive, chemical, colleges and universities, construction,<br />
cosmetic, energy, environmental, food industries,<br />
government agencies, medical, metallurgical, military, mining,<br />
nuclear, petroleum, pharmaceutical, plastics, research and<br />
Major Products/Services<br />
Our specialists customize and manufacture<br />
inorganic standards for laboratories<br />
worldwide. We create aqueous calibration<br />
standards, quality control standards, and<br />
chemical reagents, plus a wide selection<br />
of ion chromatography standards and<br />
CRMs for the latest EPA methods. Over<br />
99% of our custom solutions ship within<br />
five business days. Stock orders ship<br />
same-day prior to 4:00 pm EST. Experts<br />
are available during regular business hours<br />
to provide in-depth technical support. Furthermore,<br />
the Inorganic Ventures’ website,<br />
inorganicventures.com, has been cited by<br />
chemists as one of the best sources for<br />
analytical support on the Web.<br />
Facilities<br />
In 2009 we completed our corporate relocation<br />
to our new state-of-the-art manufacturing<br />
laboratory in Christiansburg,<br />
Virginia. This eco-friendly laboratory offers<br />
contamination-free manufacturing during<br />
every stage of production. Most foreign<br />
orders ship from our European distribution<br />
center in Madrid, Spain.
56 SPECTROSCOPY CORPORATE CAPABILITIES DECEMBER 2010<br />
Innovative Photonic Solutions<br />
www.spectroscopyonline.com<br />
Innovative Photonic<br />
Solutions<br />
4250 U.S. Highway 1, Suite 1<br />
Monmouth Junction, NJ<br />
08852<br />
TELEPHONE<br />
(732) 355-9300<br />
FAX<br />
(732) 355-9302<br />
E-MAIL<br />
srudder@<br />
innovativephotonics.com<br />
WEB SITE<br />
www.<br />
innovativephotonics.com<br />
YEAR FOUNDED<br />
2003<br />
Company Description<br />
Innovative Photonic Solutions (IPS) was founded in 2003 to<br />
address the market need for high performance semiconductor<br />
light sources that enable the customer to precisely specify the<br />
emission wavelength, output power, and spectral linewidth for<br />
their particular application. Focusing on markets such as Raman<br />
spectroscopy, laser pumping & seeding, and frequency doubling<br />
applications; IPS supplies high performance OEM solutions and<br />
“turn-key” systems for the most demanding projects. Our corporate<br />
philosophy is to take on our customer’s most challenging<br />
problems and provide them with Innovative Photonic Solutions.<br />
Chief Spectroscopic Techniques Supported<br />
⦁ Raman spectroscopy<br />
⦁ FTIR & NIR spectroscopy<br />
Markets Served<br />
IPS’ unique wavelength stabilization technology is leading the<br />
way in the development of low-cost, low power consumption<br />
semiconductor laser engines for emerging technology applications<br />
such as Raman, FTIR and NIR spectroscopy, medical diagnostics,<br />
and scientific instrumentation. Customers can request<br />
exact laser parameters, such as output power level, emission<br />
wavelength and spectral linewidth, and obtain overwhelmingly<br />
consistent product performance even in high volume manufacturing<br />
quantities. This technology can be applied to both<br />
single and multi-spatial mode lasers, can be delivered as either<br />
open beam or fiber coupled, and is available in a wide variety of<br />
packaging solutions — ranging from our ultra small TO-56 package<br />
(13 mm long × 5.6 mm dia) to our fully turn-key laboratory<br />
bench systems. Sources can be manufactured at wavelengths<br />
ranging from 405–1700 nm, and are ideal for Raman spectroscopy<br />
applications due to their ultra-high performance wavelength<br />
and power stability characteristics.<br />
Major Products/Services<br />
-Raman <strong>Spectroscopy</strong> Sources<br />
IPS offers a complete product portfolio of<br />
lasers for Raman spectroscopy. Standard<br />
products include both single and multi-mode<br />
lasers with fiber coupled or open beam output<br />
and power as high as 6 W. These units<br />
are available as OEM components or in fully<br />
turn-key modules with integral drive and<br />
temperature control electronics.<br />
Our newest product releases include a<br />
TO-56 packaged wavelength stabilized laser<br />
with integral laser line filter that is specifically<br />
designed for integration into portable Raman<br />
systems; single & multi-mode wavelength<br />
stabilized lasers with “ultra-track” and “microisolator”<br />
technologies to provide absolute<br />
power knowledge and retro-reflection insensitivity;<br />
an OEM Raman module designed<br />
for use with confocal Raman microscopy<br />
systems; and a single frequency 532 nm<br />
source that is ideal for both confocal Raman,<br />
portable Raman, and SERDS.<br />
-Custom Optical Probe Heads<br />
IPS’ line of Probe Heads have been designed<br />
for portability and applications where both<br />
size and weight matters. Designed to interface<br />
with virtually any spectrometer, these innovative<br />
designs lower overall system costs by<br />
reducing component count and minimizing<br />
optical losses. This leads to small, efficient,<br />
and compact Raman system solutions.<br />
Facilities<br />
Located in the Princeton, New Jersey area at<br />
the heart of the photonics corridor and centrally<br />
located between New York and Philadelphia,<br />
IPS’ 8,000 square foot facility houses<br />
a complete prototyping and high rate production<br />
assembly line. Key equipment includes<br />
packaging and precision alignment systems,<br />
high resolution inspection microscopy, and<br />
both optical and electrical test apparatus.
z Ultra-High Stability ('O < 0.007 nm/ 0 C)<br />
z Narrow Spectral Linewidth<br />
- Single Mode < 1 MHz<br />
- Multi-Mode < 1 cm -1<br />
z < 1 % Power Stability<br />
z OEM or Turn-key Systems<br />
z Instant On<br />
- Stable to < 1 cm -1 in < 1 sec.<br />
z Linear Tracking Photodiode<br />
z Fiber Coupled or Open Beam<br />
z Low Power Consumption<br />
z Integral Laser Line Filter<br />
and of course...<br />
z Immunity to Optical Feedback<br />
Wavelength Stabilized<br />
Raman Excitation Sources<br />
:LWKVWDQGDUGZDYHOHQJWKVUDQJLQJEHWZHHQQPQPDQGGLIIHUHQWSDFNDJLQJFRQ¿JXUDWLRQV<br />
:HDUHVXUHWRKDYHD5DPDQVRXUFHWKDWPHHWV\RXUVSHFL¿FQHHGV<br />
IPS supplies wavelength stabilized laser sources to over<br />
70% of all Raman system manufacturers world wide!<br />
Why risk going anywhere else?<br />
New Raman Laser Sources<br />
Single Frequency 532 nm OEM Module<br />
OEM Style A-Type Module<br />
This novel direct diode frequency doubled (DDFD) source<br />
RIIHUV ! P: RI¿EHU FRXSOHGRU RSHQEHDP RXWSXW<br />
power with single spatial mode operation and a single<br />
frequency wavelength. The source is rapidly tunable<br />
over several nanometers - making it an ideal source<br />
for Shifted Excitation Raman Difference <strong>Spectroscopy</strong><br />
(SERDS). The unit is available in both OEM U-Type<br />
packaging and turn-key M-Type laboratory systems.<br />
Designed as a drop-in replacement for micro laser<br />
system sources, the IPS A-Type module offers superior<br />
performance due to our unique wavelength stabilization<br />
technique. IPS A-type modules provide > 100 mW<br />
of output power with a circularized and collimated<br />
Gaussian output beam. The modules have an integral<br />
ODVHU OLQH¿OWHU DQG DQRYHO OLQHDUWUDFNLQJ SKRWRGLRGH<br />
to provide users with absolute output power knowledge.<br />
For more information visit us on the web at www.innovativephotonics.com or call (732) 355-9300
58 SPECTROSCOPY CORPORATE CAPABILITIES DECEMBER 2010<br />
Iridian Spectral Technologies<br />
www.spectroscopyonline.com<br />
Company Description<br />
Iridian is the leader in optical filter solutions for UV, visible, and near-IR applications. Our dielectric<br />
thin-film filters provide long term durability and reliability with industry leading optical performance.<br />
Get more signal with less background with our optical filters for Raman spectroscopy. We provide<br />
pass band transmittances of >90%, exceptional edge steepness, and blocking of >OD6.<br />
Capture better images with our single or multi-band filters for fluorescence spectroscopy and<br />
microscopy and flow cytometry. Our filters have high transmission with sharp cutoffs and excellent<br />
isolation providing brighter imaging and improved image contrast.<br />
Chief Spectroscopic Techniques Supported<br />
⦁ Raman spectroscopy<br />
⦁ Confocal fluorescence microscopy<br />
⦁ Flow cytometry<br />
Markets Served<br />
Iridian’s optical filter offerings address the needs of spectroscopists and spectroscopy instrument<br />
OEMs around the world. We provide direct sales support as well as offering sales via distributors in<br />
the UK, Japan, China, and Korea.<br />
Iridian Spectral<br />
Technologies<br />
1200 Montreal Road<br />
M-50, Ottawa<br />
ON K1A 0R6<br />
Canada<br />
Facilities<br />
Iridian’s operations are located in Ottawa, Ontario, Canada.<br />
TELEPHONE<br />
(613) 741-4513<br />
FAX<br />
(613) 741-9986<br />
E-MAIL<br />
sales@iridian.ca<br />
WEB SITE<br />
www.iridian.ca<br />
NUMBER OF EMPLOYEES<br />
120<br />
YEAR FOUNDED<br />
1998
www.spectroscopyonline.com DECEMBER 2010 SPECTROSCOPY CORPORATE CAPABILITIES 59<br />
Newport Corporation<br />
of knowledge across a broad spectrum of<br />
products, along with the ability to deliver unsurpassed<br />
solutions and integration.<br />
Newport Corporation<br />
1791 Deere Avenue<br />
Irvine, CA 92606<br />
TELEPHONE<br />
(800) 222-6440<br />
FAX<br />
(949) 253-1800<br />
E-MAIL<br />
sales@newport.com<br />
WEB SITE<br />
www.newport.com<br />
YEAR FOUNDED<br />
1969<br />
Company Description<br />
Newport is a world leading supplier of innovative photonic solutions<br />
to Make, Manage, and Measure Light SM . The company’s<br />
broad product portfolio includes an extensive selection of lasers,<br />
high-quality light sources, optomechanics, optics, filters, gratings,<br />
crystals, optical tables, and motion systems. As the industry’s first<br />
and only integrated supplier of laser and photonic components,<br />
Newport does more than just deliver components. We also leverage<br />
a unique ability to integrate multiple core technologies, a<br />
full range of engineering design services, metrology certification,<br />
manufacturing control programs, and world-class service and<br />
support, and offer a wide variety of subsystems, subassembly,<br />
and turnkey systems to our customers.<br />
Chief Spectroscopic Techniques Supported<br />
⦁ UV–Vis<br />
⦁ Infrared<br />
⦁ Fluorescence<br />
⦁ Raman<br />
⦁ Ultrafast<br />
Markets Served<br />
Newport provides advanced-technology products to the<br />
research, aerospace and defense, life and health sciences, photovoltaics,<br />
semiconductor, and microelectronics markets.<br />
For over 40 years Newport has continued to grow and<br />
today is built upon world-class brands such as Corion ® ,<br />
New Focus, Oriel ® Instruments, Richardson Gratings, and<br />
Spectra-Physics ® . Alone, each of these brands has a rich history of<br />
product innovation and expertise. Together they deliver a synergy<br />
Major Products/Services<br />
As a combined force, Newport, and its family<br />
of brands, is a premier global resource for<br />
solutions to Make, Manage, and Measure<br />
light. Newport’s breadth of product offerings,<br />
combined with our experience and<br />
expertise, allows us to meet our customers<br />
at any place on the technology roadmap.<br />
Our lasers, photonic instrumentation, optical<br />
tables, motion control solutions, optics, filters,<br />
gratings, opto-mechanics, and spectroscopy<br />
instruments are used in research and<br />
scientific laboratories, microelectronics and<br />
semiconductor manufacturing, life & health<br />
sciences, aerospace & defense, and industrial<br />
manufacturing. Expanding upon a 40+ year<br />
history of innovation in photonics, Newport<br />
is a single-source provider for all your laser<br />
and photonics needs.<br />
Facilities<br />
Newport Corporation has offices in over<br />
10 countries worldwide, including over<br />
600,000 square feet of office and manufacturing<br />
space. The company is headquartered<br />
in Irvine, California. This facility<br />
houses sales, marketing, engineering,<br />
and manufacturing, including facilities for<br />
optics, opto-mechanical assemblies, and<br />
instrumentation. The Spectra-Physics and<br />
New Focus laser manufacturing facilities<br />
are headquartered in Santa Clara, California.<br />
Other offices include Oriel spectroscopy<br />
products in Stratford, Connecticut;<br />
Richardson Gratings in Rochester, New<br />
York; Corion filter products and replicated<br />
mirrors in Franklin, Massachusetts; manufacturing<br />
facilities in Darmstadt, Germany,<br />
and Evry, France; and numerous local<br />
sales offices throughout Europe and Asia.
60 SPECTROSCOPY CORPORATE CAPABILITIES DECEMBER 2010<br />
Moxtek, Inc.<br />
www.spectroscopyonline.com<br />
⦁ MAGNUM Miniature X-ray Sources —<br />
The leading X-ray source technology for<br />
handheld and bench top X-ray analysis<br />
applications.<br />
⦁ XPIN Detectors — The latest generation<br />
of affordable Si-PIN detectors for X-ray<br />
fluorescence spectrometry.<br />
⦁ AP3 and ProLINE Windows — Ultrathin<br />
polymer windows for energy and<br />
wavelength dispersive spectroscopy.<br />
⦁ DuraBeryllium Windows — The most<br />
rugged and reliable beryllium windows<br />
available for X-ray applications.<br />
⦁ MX Series JFET — The lowest noise JFET<br />
available for X-ray detection systems.<br />
Moxtek, Inc.<br />
452 W 1260 N<br />
Orem, UT 84057<br />
TELEPHONE<br />
(801) 225-0930<br />
FAX<br />
(801) 221-1121<br />
E-MAIL<br />
moxtek@moxtek.com<br />
WEB SITE<br />
www.moxtek.com<br />
NUMBER OF EMPLOYEES<br />
142<br />
YEAR FOUNDED<br />
1986<br />
Company Description<br />
We are a leading supplier of X-ray and optical components for<br />
analytical instrumentation and display electronics. Products<br />
include the new XPIN high-performance Si-PIN X-ray<br />
detectors; MAGNUM ® miniature low-power X-ray sources; AP3<br />
and DuraBeryllium ® X-ray windows for EDS; ProLINE windows<br />
for WDS; and ProFlux ® wire-grid polarizers and beam splitters<br />
for UV, visible, and IR spectroscopy. Moxtek is well known for<br />
advanced technology, innovative solutions, and excellent<br />
customer service.<br />
Chief Spectroscopic Techniques Supported<br />
⦁ Energy dispersive X-ray spectroscopy<br />
⦁ Wavelength dispersive X-ray spectroscopy<br />
⦁ X-ray diffraction<br />
⦁ Microanalysis<br />
⦁ UV, visible, IR spectrometry<br />
Markets Served<br />
Moxtek, Inc. serves the analytical instrumentation and<br />
projection display markets.<br />
Major Products/Services<br />
⦁ ProFlux Wiregrid Polarizers — High transmission and<br />
contrast inorganic polarizers for UV, visible, and IR<br />
applications.
,QWURGXFLQJDZRUOGRI<br />
SRVVLELOLWLHV<br />
,QF<br />
,QQRYDWLYH<br />
6ROXWLRQV<br />
8OWUDWKLQ SRO\PHU DQG EHU\OOLXP<br />
ZLQGRZV PLQLDWXUH [UD\ VRXUFHV<br />
DQG GHWHFWRUV ORZ QRLVH -)(7V<br />
DQGQDQRVFDOHZLUHJULGSRODUL]HUV<br />
0R[WHN LV DQ LQQRYDWLYH OHDGHU IRU<br />
RXUFXVWRPHUVZRUOGZLGH<br />
$GYDQFHG<br />
7HFKQRORJ\<br />
0R[WHNWHFKQRORJ\FRQWLQXHV<br />
DGYDQFLQJ ZLWK QHZ GHVLJQV LQ<br />
SRODUL]DWLRQ DQG [UD\ DQDO\VLV WR<br />
PHHWGHPDQGVIRUVPDOOHUDQGPRUH<br />
SRZHUIXOHOHFWURQLF<br />
([FHOOHQW<br />
&XVWRPHU6HUYLFH<br />
&RQWLQXRXVLPSURYHPHQWLVRXUJRDO<br />
DVZHSDUWQHUZLWKRXUFXVWRPHUVWR<br />
GHOLYHUWKHEHVW2(0VROXWLRQ<br />
SRVVLEOH<br />
:HVW1RUWK2UHP8786$7ROO)UHHZZZPR[WHNFRP<br />
<br />
02;7(.
62 SPECTROSCOPY CORPORATE CAPABILITIES DECEMBER 2010<br />
Nippon Instruments North America<br />
www.spectroscopyonline.com<br />
budget requirements. These analyzers<br />
provide simple, highly effective results<br />
for such methods as EPA 245.1.<br />
⦁ Model RA-3420 Mercury Analyzer: A<br />
unique analyzer that performs the typical<br />
EPA Method 245.1 analysis in a fully<br />
automatic sequence, including sample<br />
preparation.<br />
⦁ Model PE-1000 Mercury Analyzer: A<br />
specifically designed mercury analyzer<br />
for direct, automated analysis of mercury<br />
in liquid and gaseous hydrocarbons.<br />
Nippon Instruments<br />
North America<br />
1511 Texas Ave S #270<br />
College Station, TX 77840<br />
TELEPHONE<br />
(979) 774-3800<br />
FAX<br />
(979) 774-3807<br />
E-MAIL<br />
sales@hg-nic.us<br />
WEB SITE<br />
www.hg-nic.us<br />
NUMBER OF EMPLOYEES<br />
19<br />
YEAR FOUNDED<br />
2003<br />
Company Description<br />
Nippon Instruments North America is the regional office for<br />
Nippon Instruments Corporation-Japan. Nippon Instruments<br />
has over 30 years of experience in the design and manufacture<br />
of high-quality mercury analyzers. With an absolute focus<br />
on mercury analyzers, Nippon Instruments offers mercury analyzers<br />
for just about every application. From systems for most<br />
EPA methods to direct mercury analyzers to online monitoring<br />
systems to specially designed systems for the petrochem<br />
industry, Nippon Instruments has a mercury analyzer for your<br />
laboratory.<br />
Chief Spectroscopic Techniques Supported<br />
⦁ Atomic absorption spectroscopy<br />
⦁ Atomic fluorescence spectroscopy<br />
Markets Served<br />
Nippon Instruments provides mercury analyzers for EPA compliance<br />
monitoring in the environmental, government, and<br />
industrial markets. We provide highly versatile systems for the<br />
research and education markets, as well as mercury analyzers<br />
that are specifically designed for the unique tasks of the<br />
industrial and petrochem markets.<br />
Major Products/Services<br />
⦁ Model MA-2000 Mercury Analyzer: A direct mercury<br />
analyzer that allows for mercury analysis of just about any<br />
matrix without the need for sample preparation.<br />
⦁ Model RA-3000 Series Mercury Analyzers: Mercury analyzers<br />
with several configurations available to fit various<br />
Facilities<br />
Nippon Instruments North America is in<br />
the final stages of building a new office in<br />
College Station, Texas, in order to continue<br />
to expand our capabilities. Nippon Instruments<br />
Corporation currently maintains offices<br />
in Osaka and Tokyo, Japan, as well as<br />
an additional office in Singapore.
www.spectroscopyonline.com DECEMBER 2010 SPECTROSCOPY CORPORATE CAPABILITIES 63<br />
OI Analytical<br />
Major Products/Services<br />
OI Analytical provides instruments for<br />
spectroscopic analysis including:<br />
⦁ iTOC-CRDS Isotopic Carbon Analyzer<br />
⦁ IonCam Mass Spectrometer<br />
⦁ IonCam 2020 Transportable GC–MS<br />
⦁ IonCCD Array Detector<br />
⦁ DA 3500 Discrete Analyzer<br />
⦁ FS 3100 Automated Chemistry Analyzer<br />
Facilities<br />
OI Analytical operates research and manufacturing<br />
sites in College Station, Texas<br />
and Birmingham, Alabama occupying<br />
88,000 square feet.<br />
OI Analytical<br />
151 Graham Road<br />
P.O. Box 9010<br />
College Station, TX 77842<br />
TELEPHONE<br />
(979) 690-1711<br />
(800) 653-1711<br />
FAX<br />
(979) 690-0440<br />
E-MAIL<br />
oimail@oico.com<br />
WEB SITE<br />
www.oico.com<br />
NUMBER OF EMPLOYEES<br />
135<br />
YEAR FOUNDED<br />
1969<br />
Company Description<br />
OI Analytical designs, manufactures, markets, and supports<br />
analytical instruments used for sample preparation, detection,<br />
and measurement of chemical compounds and elements. ITT<br />
Analytics acquired OI Analytical on November 16, 2010. OI<br />
Analytical is based in College Station, Texas, with a second<br />
facility in Birmingham, Alabama.<br />
Chief Spectroscopic Techniques Supported<br />
⦁ Total organic carbon-cavity ring down spectroscopy (TOC-<br />
CRDS)<br />
⦁ Mass spectrometry<br />
⦁ Gas chromatography–mass spectrometry (GC–MS)<br />
⦁ Discrete analysis<br />
⦁ Flow injection analysis (FIA)<br />
⦁ Segmented flow analysis (SFA)<br />
Markets Served<br />
Principal markets/industries served include environmental<br />
testing, drinking and wastewater treatment, chemicals and<br />
petrochemicals, pharmaceuticals, food and beverage, homeland<br />
security, and chemical weapons demilitarization.<br />
Opportunity<br />
OI Analytical<br />
Innovation TM
64 SPECTROSCOPY CORPORATE CAPABILITIES DECEMBER 2010<br />
Ocean Optics, Inc.<br />
www.spectroscopyonline.com<br />
Ocean Optics<br />
830 Douglas Ave.<br />
Dunedin, FL 34698<br />
TELEPHONE<br />
( 727) 733-2447<br />
FAX<br />
( 727) 733-3962<br />
E-MAIL<br />
info@oceanoptics.com<br />
WEB SITE<br />
www.oceanoptics.com<br />
NUMBER OF EMPLOYEES<br />
250<br />
YEAR FOUNDED<br />
1989<br />
Company Description<br />
Ocean Optics invented the world’s first miniature spectrometer<br />
and has delivered over 130,000 of them since its inception<br />
in 1989. The company provides solutions for diverse applications<br />
of optical sensing in medical and biological research,<br />
environmental regulation, science education, production, and<br />
process control. Ocean Optics also provides a comprehensive<br />
range of complementary technologies including chemical sensors,<br />
metrology instrumentation, optical fibers, probes, filters,<br />
coatings, and many more spectroscopic peripherals and accessories.<br />
Our spectrometers and sensors are also ideal for<br />
OEM applications — with modular options that meet virtually<br />
any application requirement.<br />
Chief Spectroscopic Techniques Supported<br />
Absorbance, transmission, reflectance, irradiance, fluorescence,<br />
Raman, UV/VIS/NIR, spectroradiometry, color spectroscopy,<br />
laser-induced breakdown spectroscopy (LIBS), fiber<br />
optic chemical sensing, flow injection analysis, elemental<br />
analysis, endpoint detection, headspace monitoring, laser<br />
characterization, nondestructive testing, multi-spectral<br />
imaging.<br />
Markets Served<br />
Ocean Optics technologies can be found in a diverse range of<br />
industries and disciplines. Our products are used by innovators,<br />
researchers, scientists, OEMs, medical and healthcare<br />
professionals, and in manufacturing facilities in every country<br />
on the planet. Military and security concerns have incorporated<br />
Ocean Optics technologies into their equipment while<br />
the research community has embraced<br />
our systems and components for everything<br />
from cancer detection to solar cell<br />
analysis. In fact, you can find Ocean Optics<br />
products in virtually any application from<br />
food safety to forensics and from semiconductors<br />
to marine biology.<br />
Major Products/Services<br />
⦁ Spectrometers: UV/VIS/NIR, highresolution,<br />
time-gated fluorescence,<br />
spectrofluorometers, absorbance, laserinduced<br />
breakdown, LED measurement,<br />
reflectance, Raman, remote sensing,<br />
field measurement.<br />
⦁ Optical Sensors: Oxygen sensors, pH<br />
sensors, transducing materials.<br />
⦁ Software: Spectrometer operating,<br />
device drivers, irradiance, reflective and<br />
emissive color, compound identification.<br />
⦁ Sampling Accessories: Collimating<br />
lenses, cuvettes and holders, standards,<br />
filters and holders, flow cells, cosine<br />
correctors, integrating spheres.<br />
⦁ Light Sources: Deuterium, tungsten<br />
halogen, LED, excitation sources, lasers.<br />
⦁ Optical Fibers and Probes: Premium<br />
grade assemblies, bare fiber, custom<br />
options, reflection and transmission<br />
probes, vacuum feedthroughs,<br />
complete fiber kits.<br />
Facilities<br />
Ocean Optics is headquartered in Dunedin,<br />
Florida and has full-service locations in Europe<br />
as well as China. Ocean Optics is part<br />
of Halma p.l.c., a safety and environmental<br />
technology group in the United Kingdom.
66 SPECTROSCOPY CORPORATE CAPABILITIES DECEMBER 2010<br />
OptiGrate Corp.<br />
www.spectroscopyonline.com<br />
OptiGrate Corp.<br />
3267 Progress Drive<br />
Orlando, FL 32826<br />
TELEPHONE<br />
(407) 381-4115<br />
FAX<br />
(407) 384-5995<br />
E-MAIL<br />
info@optigrate.com<br />
WEB SITE<br />
www.optigrate.com<br />
NUMBER OF EMPLOYEES<br />
25<br />
YEAR FOUNDED<br />
1999<br />
Company Description<br />
OptiGrate Corp. designs and manufactures ultra narrow band<br />
optical filters based on volume Bragg grating (VBG) technologies<br />
in proprietary photosensitive glass. Filters with bandwidth<br />
as low as 30 pm are formed by holographic techniques in the<br />
bulk of glass material and demonstrate superior optical quality,<br />
outstanding durability, and high optical damage threshold.<br />
OptiGrate is a pioneer and world leader in VBG technologies<br />
and, for over 10 years, OptiGrate has delivered custom build<br />
and volume orders of holographic optical elements (HOE) to<br />
a large number of government contractors and OEMs.<br />
OptiGrate has an exclusive license to a full portfolio of unique<br />
VBG-based products deployed in various industries.<br />
Markets Served<br />
OptiGrate supplied ultra narrow band filters to hundreds of<br />
customers on five continents. The filters are used in a wide<br />
range of applications for optoelectronic, analytical, defense,<br />
and semiconductor industries. Major markets include:<br />
⦁ Raman spectroscopy and microscopy<br />
⦁ Semiconductor, solid state, and fiber lasers<br />
⦁ Hyperspectral and Raman imaging<br />
⦁ Photonics applications in the defense sector<br />
⦁ Ultrafast laser systems<br />
⦁ Optical recording and storage<br />
⦁ Medical diagnostics and treatment<br />
Major Products/Services<br />
⦁ Optical Notch Filters — laser line rejection filters with bandwidth<br />
< 10 cm -1 .<br />
⦁ Optical Bandpass Filters — laser sidemode<br />
suppression filters with bandwidth<br />
www.spectroscopyonline.com DECEMBER 2010 SPECTROSCOPY CORPORATE CAPABILITIES 67<br />
Optometrics Corporation<br />
Markets Served<br />
⦁ Life sciences<br />
⦁ Scientific & analytical instrumentation<br />
⦁ FT-IR accessories<br />
⦁ Environmental & process monitoring<br />
⦁ Homeland security<br />
⦁ Scientific research<br />
⦁ Military<br />
⦁ Laser manufacturers<br />
Optometrics Corporation<br />
8 Nemco Way<br />
Ayer, MA 01432<br />
TELEPHONE<br />
(978) 772-1700<br />
FAX<br />
(978) 772-0017<br />
E-MAIL<br />
sales@optometrics.com<br />
WEB SITE<br />
www.optometrics.com<br />
NUMBER OF EMPLOYEES<br />
45<br />
YEAR FOUNDED<br />
1969<br />
Company Description<br />
Optometrics has a distinguished 40 year history of manufacturing<br />
and providing optical components, in particular diffraction<br />
gratings and interference filters, for a wide range of<br />
spectroscopic and laser applications. Optometrics’ goal is to<br />
provide advanced optical components and systems for use in<br />
wavelength selection applications. Products include diffraction<br />
gratings, interference filters, components for military and civilian<br />
sighting and ranging equipment, monochromators, and<br />
ruled and holographic wire grid polarizers and beamsplitters.<br />
Optometrics caters, in particular, to the needs of its OEM<br />
customers by offering special services such as kanban stocking,<br />
bar coding capabilities, custom packaging programs, and<br />
higher level pre-aligned optical assemblies.<br />
Chief Spectroscopic Techniques Supported<br />
⦁ UV, Visible, IR spectrometry<br />
⦁ Infrared (including FT-IR)<br />
⦁ Fluorescence<br />
⦁ Raman spectroscopy<br />
⦁ Laser<br />
⦁ Liquid chromatography – mass spectrometry<br />
⦁ High performance liquid chromatography<br />
⦁ Color spectroscopy<br />
Major Products/Services<br />
⦁ Diffraction gratings, ruled & holographic,<br />
originals or replicated, reflection and<br />
transmission<br />
⦁ Interference filters from 334–1650 nm<br />
⦁ Ruled & holographic wire grid<br />
polarizers<br />
⦁ Laser gratings<br />
⦁ Monochromators<br />
⦁ Tunable light sources<br />
⦁ Light sources, sample compartments,<br />
stepper motor controllers<br />
⦁ Components for military and civilian<br />
sighting and ranging equipment<br />
⦁ Beamsplitters<br />
Facilities<br />
Optometrics’ facility in Ayer, Massachusetts<br />
contains space for offices, engineering,<br />
R&D, and production. Equipment that supports<br />
our broad range of capabilities include<br />
four metal vacuum coating systems,<br />
three filter vacuum systems, two ionassisted<br />
hard coat vacuum systems, three<br />
grating ruling engines, two holographic<br />
laboratories, full replication and lamination<br />
facilities as well as full assembly,<br />
alignment, and test facilities. Optometrics<br />
is a wholly-owned subsidiary of Dynasil<br />
Corporation.
68 SPECTROSCOPY CORPORATE CAPABILITIES DECEMBER 2010<br />
PerkinElmer, Inc.<br />
www.spectroscopyonline.com<br />
Company Description<br />
PerkinElmer is a global scientific leader providing an extensive<br />
range of technology solutions and services to address the<br />
most critical issues facing humanity. From critical research and<br />
prenatal screening to environmental testing and industrial<br />
monitoring, we’re actively engaged in improving health and<br />
enhancing quality of life all around the world.<br />
Major Products/Services<br />
PerkinElmer, Inc. offers a wide breadth<br />
of instrumentation and solutions to meet<br />
your analytical measurement needs:<br />
⦁ Atomic spectroscopy: AA, ICP-OES,<br />
ICP-MS<br />
⦁ Chromatography: GC & GC Custom Solutions,<br />
GC–MS, HPLC & UHPLC<br />
⦁ Hyphenated techniques: HPLC-ICP-<br />
MS,GC-ICP-MS, HS-GC, HS-GC–MS,<br />
TD-GC, TD-GC–MS, TG-IR, TG-MS, TG-<br />
GC–MS, DSC-Raman<br />
⦁ Mass spectrometry: ICP-MS, GC–MS,<br />
LC–MS<br />
⦁ Molecular spectroscopy: FT-IR & FT-NIR,<br />
UV-Vis & UV-Vis-NIR, Raman spectroscopy,<br />
fluorescence spectroscopy<br />
⦁ Thermal analysis: DSC, TGA, STA, DMA<br />
⦁ Organic elemental analysis: CHN/O,<br />
CHNS/O<br />
⦁ Consumables: Atomic spectroscopy,<br />
chromatography, molecular spectroscopy,<br />
thermal analysis, elemental<br />
analysis<br />
⦁ OneSource ® Laboratory Services<br />
PerkinElmer, Inc.<br />
940 Winter Street<br />
Waltham, MA 02451<br />
TELEPHONE<br />
(203) 925-4602<br />
FAX<br />
(203) 944-4904<br />
E-MAIL<br />
as.info@perkinelmer.com<br />
WEB SITE<br />
www.perkinelmer.com<br />
NUMBER OF EMPLOYEES<br />
2,300 (in the US)<br />
6,500 (outside the US)<br />
YEAR FOUNDED<br />
1937<br />
Chief Spectroscopic Techniques Supported<br />
⦁ Atomic absorption<br />
⦁ Inductively coupled plasma (ICP-OES and ICP-AES)<br />
⦁ ICP mass spectrometry (ICP-MS)<br />
⦁ Infrared (FT-IR & FT-NIR) spectroscopy<br />
⦁ UV-Vis & UV-Vis-NIR<br />
⦁ Raman spectroscopy<br />
Markets Served<br />
PerkinElmer is a leading provider of precision instrumentation,<br />
reagents and chemistries, software, and services for a<br />
wide range of scientific and industrial laboratory applications,<br />
including environmental monitoring, food and beverage quality/safety,<br />
and chemical analysis, as well as genetic screening,<br />
drug discovery, and development.<br />
Facilities<br />
PerkinElmer, Inc. operates globally in 150<br />
countries.
©2010 PerkinElmer, Inc. 400190A_04. All rights reserved. PerkinElmer ® is a registered trademark of PerkinElmer, Inc. All other trademarks are the property of their respective owners.<br />
DO THINGS<br />
THE WAY<br />
YOU WANT.<br />
NEXION 300 ICP-MS<br />
Don’t let your ICP-MS put limits on the way you work. Engineered to<br />
deliver a level of stability, flexibility and performance never before seen in atomic<br />
spectroscopy, the NexION ® 300 represents the first truly significant industry<br />
advancement in recent memory. For the first time ever, a single instrument offers<br />
three modes of operation (Standard, Collision and Reaction), allowing analysts<br />
to choose the most appropriate technique for a specific sample or application. All<br />
while delivering superior accuracy, beter detection limits, and faster analysis times.<br />
NexION 300. Designed to stand out from the crowd – www.perkinelmer.com/nexion<br />
See the NexION at one of our seminars – www.perkinelmer.com/ASLSeventsNA
70 SPECTROSCOPY CORPORATE CAPABILITIES DECEMBER 2010<br />
Pair Technologies, LLC<br />
www.spectroscopyonline.com<br />
Company Description<br />
Pair Technologies was founded to capitalize on the unique<br />
capabilities of planar array infrared spectroscopy. We offer a<br />
group of products that provide extremely rapid spectra, unmatched<br />
long term stability, and no moving parts. Products<br />
are easily customized for specific applications.<br />
Chief Spectroscopic Techniques Supported<br />
⦁ Planar array mid-infrared spectroscopy<br />
Markets Served<br />
⦁ Research<br />
⦁ Education<br />
⦁ Government<br />
Major Products/Services<br />
⦁ Pair 100 series spectrometer systems<br />
Facilities<br />
Offices at Delaware Technology Center in Newark, Delaware.<br />
Pair Technologies, LLC<br />
1 Innovation Way<br />
Newark, DE 19711<br />
TELEPHONE<br />
(302) 368-7247<br />
E-MAIL<br />
info@pairtech.com<br />
WEB SITE<br />
www.pairtech.com<br />
NUMBER OF EMPLOYEES<br />
5<br />
YEAR FOUNDED<br />
2008
www.spectroscopyonline.com DECEMBER 2010 SPECTROSCOPY CORPORATE CAPABILITIES 71<br />
Photon etc.<br />
⦁ Life sciences<br />
⦁ Space and astronomy<br />
⦁ Environment and agriculture<br />
⦁ Mining, oil, and gas operations<br />
⦁ Art authentification, restoration, and<br />
conservation<br />
Major Products/Services<br />
Photon etc’s standard products include:<br />
⦁ Widefield hyperspectral imaging systems<br />
⦁ Microscopy hyperspectral imaging system<br />
⦁ Tunable laser sources<br />
⦁ Supercontinuum lasers<br />
⦁ Tunable bandpass filters<br />
⦁ Tunable notch filters<br />
⦁ Resonance Raman spectroscopy systems<br />
⦁ Custom projects and internal R&D programs<br />
Photon etc.<br />
5795 av. de Gaspé #222<br />
Montreal, QC, H2S 2X3<br />
Canada<br />
TELEPHONE<br />
(514) 385-9555<br />
FAX<br />
(514) 279-5493<br />
E-MAIL<br />
info@photonetc.com<br />
WEB SITE<br />
www.photonetc.com<br />
NUMBER OF EMPLOYEES<br />
20<br />
YEAR FOUNDED<br />
2002<br />
Company Description<br />
As pioneers in Bragg-based hyperspectral imaging, Photon etc.<br />
specializes in state-of-the-art photonic and optical research instrumentation.<br />
Driven by scientific expertise and its spirit of innovation,<br />
Photon etc. aims to remain a leader in this field.<br />
Photon etc’s patented spectral imaging, optical filter, and sensor<br />
technologies provide solutions for a wide variety of scientific<br />
and industrial applications. From material analysis to medical<br />
imaging, Photon etc’s products permit its clients to explore new<br />
territories of measurement and analysis.<br />
Chief Spectroscopic Techniques Supported<br />
⦁ Nanomaterial and green material analysis<br />
- High resolution PL imager for PV and LED analysis<br />
- RRS system for carbon nanotubes and nanostructure<br />
research<br />
- Widely tunable lasers source for single molecule PL<br />
⦁ Industrial material analysis:<br />
- Hyperspectral imaging of geological formation<br />
- Multi-band LIBS for sulfur and carbon monitoring<br />
⦁ Molecular spectroscopy in life science:<br />
- PL and Raman imaging of biosensors<br />
- Hyperspectral imaging of the retina for AMD diagnostic<br />
- Hyperspectral imaging of the whole body for dermatology<br />
clinical studies<br />
- Tunable filter and broadband source for CARS<br />
Markets Served<br />
⦁ Scientific research<br />
⦁ Pharmaceuticals and petrochemicals<br />
Facilities<br />
Photon etc. is both a research and development<br />
company and a specialized<br />
manufacturer of measurement and analysis<br />
instruments. Photon etc’s headquarters are<br />
located in Montreal, Canada.<br />
Its distribution network includes partners in:<br />
⦁ France (Opton Laser International and<br />
Leukos)<br />
⦁ Japan (Tokyo Instruments)<br />
⦁ Germany (Soliton GmbH)<br />
⦁ United Kingdom (Pacer International)<br />
⦁ Israel (Toyoram Electronics)<br />
⦁ China (Hoaliang Tech Co.)<br />
⦁ Korea (Hanbek Co.)
72 SPECTROSCOPY CORPORATE CAPABILITIES DECEMBER 2010<br />
PHOTONIS USA<br />
www.spectroscopyonline.com<br />
PHOTONIS USA<br />
Sturbridge Business Park<br />
660 Main Street<br />
Sturbridge, MA 01566<br />
TELEPHONE<br />
(508) 347-4000<br />
(800) 648-1800<br />
FAX<br />
(508) 347-3849<br />
E-MAIL<br />
sales@usa.photonis.com<br />
WEB SITE<br />
www.photonis.com<br />
NUMBER OF EMPLOYEES<br />
USA: 150<br />
Elsewhere: 900<br />
YEAR FOUNDED<br />
1937<br />
Company Description<br />
PHOTONIS is a leading developer,<br />
manufacturer, and<br />
supplier of scientific detector<br />
products and components<br />
for scientific and<br />
analytical instrumentation<br />
systems. We specialize in<br />
ion, electron, and photon<br />
detection with unrivaled<br />
expertise in designing and<br />
delivering standard and<br />
custom products to meet<br />
the most demanding applications.<br />
Our engineering and<br />
manufacturing expertise<br />
delivers solutions for virtually<br />
every detection application.<br />
With the PHOTONIS<br />
worldwide manufacturing<br />
capability and support network, we can both design and<br />
manufacture your most challenging detection needs.<br />
Chief Spectroscopic Techniques Supported<br />
⦁ Mass spectrometry<br />
⦁ Time of flight MS<br />
⦁ Raman spectroscopy<br />
⦁ Nuclear spectroscopy<br />
⦁ UV and X-ray spectroscopy<br />
⦁ Charged particle imaging<br />
⦁ Electron microscopy<br />
⦁ Residual gas analysis/leak detection<br />
⦁ E-beam/X-ray lithography<br />
⦁ Luminescence<br />
⦁ Fluorescence<br />
⦁ Atomic absorption<br />
⦁ Deep UV/X-ray optics<br />
Markets Served<br />
PHOTONIS detection products are found in most of today’s<br />
high technology-based markets, including scientific and<br />
analytical instrumentation, medical diagnostics, chemistry,<br />
scientific research, life sciences, space and geophysical<br />
exploration, environmental and process monitoring, homeland<br />
security, control, and communications.<br />
Major Products/Services<br />
⦁ Micro pore optics<br />
⦁ Channeltron ® electron multipliers<br />
⦁ MAGNUM ® electron multipliers<br />
⦁ Long-Life microchannel plates<br />
⦁ Time-of-flight MCP detectors<br />
⦁ MCP detector assemblies<br />
⦁ FieldMaster ion guides and drift<br />
tubes<br />
⦁ Glass capillary arrays<br />
⦁ Resistive glass products<br />
⦁ Electron generator arrays<br />
⦁ MCP-based pmts<br />
⦁ Image intensifier tubes<br />
⦁ Intensified camera units<br />
⦁ Hybrid photo detectors<br />
⦁ Streak tubes<br />
⦁ High voltage power supplies<br />
⦁ Power tubes<br />
⦁ Neutron and gamma detectors<br />
⦁ Glass-coated wire<br />
⦁ Flexible fiber optics<br />
Facilities<br />
PHOTONIS in Sturbridge, Massachusetts<br />
manufactures Channeltron ® electron<br />
multipliers, microchannel plates, MCP<br />
detectors, ion guides, prototype detectors,<br />
and other custom glass products.<br />
The Lancaster, Pennsylvania facility<br />
manufactures power tubes and other<br />
related products. PHOTONIS in Roden,<br />
Netherlands manufactures image intensifier<br />
tubes, intensified camera units,<br />
and hybrid photo detectors. PHOTONIS<br />
in Brive, France manufactures image intensifier<br />
tubes and related products.
www.spectroscopyonline.com DECEMBER 2010 SPECTROSCOPY CORPORATE CAPABILITIES 73<br />
PIKE Technologies<br />
⦁ Automation and temperature control are<br />
available for many of our spectroscopy<br />
accessories to speed sampling and to provide<br />
precise thermal analysis.<br />
Markets Served<br />
PIKE products are designed for spectrometers<br />
in the petrochemical, food, forensic,<br />
biochemical, pharmaceutical, semiconductor,<br />
agriculture, and material science<br />
industries. In addition, PIKE specializes<br />
in custom design of products for specific<br />
applications. PIKE products are designed<br />
and built with craftsmanship and care to<br />
exceed customer expectations.<br />
PIKE Technologies<br />
6125 Cottonwood Drive<br />
Madison, WI 53719<br />
TELEPHONE<br />
(608) 274-2721<br />
FAX<br />
(608) 274-0103<br />
E-MAIL<br />
sales@piketech.com<br />
WEB SITE<br />
www.piketech.com<br />
NUMBER OF EMPLOYEES<br />
36<br />
YEAR FOUNDED<br />
1989<br />
Company Description<br />
PIKE Technologies was established in the summer of 1989, specializing<br />
in the development and manufacture of accessories and<br />
optical systems that enhance the performance of commercial<br />
spectrometers.<br />
PIKE concentrates on making the life of laboratory personnel<br />
easier. This is achieved through replacing traditional, tedious sampling<br />
routines with a range of innovative products and techniques.<br />
Chief Spectroscopic Techniques Supported<br />
PIKE Products are designed to work with FTIR and UV-Vis spectrometers<br />
and are based upon the principles of transmission and<br />
reflection spectroscopy measurements. The sampling techniques<br />
offered can be divided into seven major groups:<br />
⦁ Attenuated total reflectance (ATR), for analysis of liquids,<br />
pastes, and soft solid materials<br />
⦁ Diffuse reflectance (DRIFTS), used in sampling of powders and<br />
solids<br />
⦁ Specular reflectance, useful in thin film composition and thickness<br />
measurements<br />
⦁ Microsampling products, FTIR microscope and beam<br />
condensers to analyze microsamples<br />
⦁ Integrating spheres, NIR, and Mid-IR versions for FTIR spectrometers<br />
⦁ Transmission supplies, including IR optics, and windows of all<br />
sizes and designs<br />
Major Products/Services<br />
⦁ MIRacle — Patented “universal” sampling<br />
accessory — Diamond, ZnSe, Ge, Si,<br />
and AMTIR crystals<br />
⦁ GladiATR and GladiATR Vision— Highest<br />
performance diamond ATR<br />
⦁ VeeMax — Patented variable angle specular<br />
reflection and the ATR Max used for<br />
variable depth of penetration experiments<br />
and studies<br />
⦁ A wide range of fully automated FTIR, NIR,<br />
and UV-Vis products with easy to integrate<br />
AutoPRO software<br />
⦁ Valu-Line Kits combining the most often<br />
used sampling accessories and transmission<br />
kits containing sampling holders,<br />
cells, and optics<br />
⦁ Integrating spheres for IR and NIR<br />
Facilities<br />
PIKE Technologies is located in Madison,<br />
Wisconsin. Our products are fully compatible<br />
with all major brands of spectrometers<br />
and are sold directly, and through an<br />
extensive distributor network worldwide.<br />
Please visit our website for additional<br />
product and contact information.
74 SPECTROSCOPY CORPORATE CAPABILITIES DECEMBER 2010<br />
Polymicro Technologies,<br />
A subsidiary of Molex Incorporated<br />
www.spectroscopyonline.com<br />
Polymicro Technologies,<br />
A subsidiary of Molex<br />
Incorporated<br />
18019 North 25th Avenue<br />
Phoenix, AZ 85023<br />
TELEPHONE<br />
(602) 375-4100<br />
FAX<br />
(602) 375-4110<br />
E-MAIL<br />
polymicrosales@molex.com<br />
WEB SITE<br />
www.polymicro.com<br />
NUMBER OF EMPLOYEES<br />
115<br />
YEAR FOUNDED<br />
1984<br />
Company Description<br />
For over a quarter century, (since 1984), Polymicro Technologies<br />
delivers CREATIVE . . . INNOVATIVE . . . SOLUTIONS<br />
for the aerospace, analytical, astronomy, automotive, biodefense,<br />
biotechnology, communications, energy, manufacturing,<br />
medical, military, and pharmaceutical industries.<br />
Polymicro is the leader in providing specialty optical fibers<br />
and capillary tubing world wide.<br />
Chief Spectroscopic Techniques Supported<br />
⦁ <strong>Spectroscopy</strong>, UV to mid-IR<br />
⦁ Sensors<br />
⦁ Analytical detectors<br />
⦁ Laser light delivery<br />
⦁ Remote illumination<br />
⦁ Astronomy spectral analysis<br />
Markets Served<br />
Polymicro’s optical fiber, capillary tubing, fiber optic assemblies,<br />
and fiber and tubing arrays are commonly used in academic<br />
labs, national labs, and industry. Polymicro products<br />
find use in aerospace, analytical, astronomy, automotive, biodefense,<br />
biotechnology, communications, energy, manufacturing,<br />
medical, military, and pharmaceutical. Typical applications<br />
include spectroscopy, sensing, analytical detection and analysis,<br />
laser light delivery, remote illumination, process and quality<br />
monitoring and control, in addition to unique applications<br />
from astronomy and aerospace to your laboratory bench.<br />
Major Products/Services<br />
Polymicro manufactures multimode,<br />
step-index fused silica optical fiber with<br />
polyimide, silicone, acrylate, and other<br />
buffers/coatings; hard clad optical fiber;<br />
dual clad optical fiber; highly stable deep<br />
UV optical fiber; broad spectrum optical<br />
fiber; fiber optic cables and assemblies;<br />
high-strength, high-temperature flexible<br />
fused-silica capillary tubing; light-guiding<br />
capillary; flow cells; square capillary<br />
tubing; windowed capillary tubes; UV<br />
transparent capillary; precision silica and<br />
quartz rods and “cleaved to length” tubing<br />
pieces; multilumen tubing; and microcomponents<br />
such as laser machined<br />
fiber tips, ferrules, sleeves, and laser cut<br />
rods or tubing.<br />
Facilities<br />
Polymicro has 50,000 sq. ft. of facility<br />
located in the North Phoenix area. At our<br />
location we have several draw towers<br />
that produce a large portion of capillary<br />
tubing and multimode step-index fibers<br />
used throughout the world. Polymicro<br />
has its own glass laboratory, assembly<br />
department, laser machining department,<br />
and sophisticated testing equipment to<br />
meet our customers’ needs for the highest<br />
quality products and service.<br />
To get your copy of our handbook or<br />
inquire about our products, simply e-mail<br />
our technical sales department at<br />
polymicrosales@molex.com. Or you can<br />
fax us at (602) 375-4110.
www.spectroscopyonline.com DECEMBER 2010 SPECTROSCOPY CORPORATE CAPABILITIES 75<br />
Specac, Inc.<br />
Company Description<br />
Specac delivers quality products engineered to meet your needs. Our accessories and systems are<br />
easy to use and built to last — from thin plastic film preparation accessories, used for routine quality<br />
checks, to sophisticated remote sampling systems for reaction monitoring.<br />
Specac is now part of Smiths Group, which acquired Specac Ltd from Graseby in 1997. Specac<br />
now employs around 55 people worldwide, with offices in the US and the UK, and a network of<br />
distributors and dealers worldwide. Smiths Group is an international company employing 16,000<br />
people in some 50 different businesses located in the UK, US, and Europe.<br />
Specac does not support chromatographic techniques.<br />
Markets Served<br />
Specac provides accurate and reliable IR and FT-IR sample handling accessories to academic,<br />
industrial, and research institutions worldwide. Specific areas include oil refineries, petrochemicals,<br />
chemical, pharmaceutical, food, observatories, military, and universities.<br />
Specac Limited<br />
River House<br />
97 Cray Avenue<br />
Orpington<br />
Kent<br />
BR5 4HE<br />
United Kingdom<br />
TELEPHONE<br />
+44 01689 873134<br />
FAX<br />
+44 01689 878527<br />
Specac, Inc.<br />
50 Sharpe Drive<br />
Cranston, RI 02920<br />
Major Products/Services<br />
Specac’s products fall into 4 areas: IR sampling accessories, sample preparation, polarizers, and<br />
products and process.<br />
We can provide everything you need, from classic hydraulic presses (up to 40 ton) to handheld<br />
dies for producing smaller samples, a grinding mill or a high-temperature constant thickness film<br />
maker system — whatever type of sample you are preparing, you can be sure of a perfect reading.<br />
Our range of gas cells allows us to offer sampling solutions in a wide variety of pathlengths,<br />
volumes, construction materials, and windows.<br />
Facilities<br />
Specac moved to its current purpose-built location in 1995, based in Orpington, Kent, UK.<br />
There has been a substantial manufacturing investment, and we have a team of optical and<br />
mechanical engineering experts using the latest in 3D CAD systems and optical design software.<br />
TELEPHONE<br />
(401) 854-5281<br />
FAX<br />
(401) 463-6206<br />
E-MAIL<br />
sales@specac.co.uk<br />
WEB SITE<br />
www.specac.com<br />
NUMBER OF EMPLOYEES<br />
USA: 3<br />
UK: 55<br />
YEAR FOUNDED<br />
1971
76 SPECTROSCOPY CORPORATE CAPABILITIES DECEMBER 2010<br />
Shimadzu Scientific Instruments<br />
www.spectroscopyonline.com<br />
⦁ Compact, high-resolution UV-1800<br />
⦁ Easy-to-use UVmini-1240<br />
⦁ Bioscience-oriented BioSpec-mini<br />
⦁ Micro-volume (1 μL to 2 μL samples)<br />
BioSpec-nano<br />
⦁ Single monochromator UV-2450<br />
⦁ Double-blazed, double monochromator<br />
UV-2550<br />
⦁ Research-grade UV-3600 UV-VIS-NIR<br />
⦁ SolidSpec-3700 UV-VIS-NIR<br />
Shimadzu Scientific<br />
Instruments<br />
7102 Riverwood Drive<br />
Columbia, MD 21046<br />
TELEPHONE<br />
(800) 477-1227<br />
(410) 381-1227<br />
FAX<br />
(410) 381-1222<br />
E-MAIL<br />
webmaster@shimadzu.com<br />
WEB SITE<br />
www.ssi.shimadzu.com<br />
NUMBER OF EMPLOYEES<br />
USA: 335<br />
Worldwide: 9,600<br />
YEAR FOUNDED<br />
Shimadzu Scientific<br />
Instruments: 1975<br />
Shimadzu Corporation: 1875<br />
Company Description<br />
Shimadzu Scientific Instruments (SSI) is the North American<br />
subsidiary of Shimadzu Corp., headquartered in Kyoto, Japan.<br />
SSI was established in 1975 to provide analytical solutions to<br />
a wide range of laboratories in the Americas. With a vast installed<br />
base and preferred vendor status at many institutions,<br />
SSI’s instruments are used by top researchers across the globe,<br />
customers who can count on the stability, experience, and<br />
support only Shimadzu offers.<br />
Chief Spectroscopic Techniques Supported<br />
⦁ UV–Vis<br />
⦁ FT-IR<br />
⦁ Fluorescence<br />
⦁ Atomic (AA/ICP)<br />
⦁ X-Ray (EDX/XRD/XRF)<br />
⦁ GC–MS<br />
⦁ LC–MS<br />
Markets Served<br />
Shimadzu offers more spectroscopy instrumentation, with<br />
more software and accessory options, than any other company.<br />
This flexibility enables spectroscopists in virtually any<br />
laboratory, from biotechnology, pharmaceutical, and industrial<br />
to academic, forensic, and environmental, to select the instrument<br />
best suited to their application. Shimadzu provides free<br />
technical support for the life of the instruments and encourages<br />
customer alliances to further product development.<br />
Major Products/Services<br />
Shimadzu meets your needs for ruggedness, ease of use, validation,<br />
and applications with a variety of UV–Vis spectrophotometers.<br />
FT-IR: Our robust, yet stable, FTIR spectrophotometers<br />
deliver optimum performance,<br />
sensitivity, and reliability at an<br />
exceptional price, and we offer more of the<br />
sampling accessories you need, including<br />
an automated microscope.<br />
FLUORESCENCE: High-performance spectrofluorophotometer<br />
handles a range of<br />
applications from routine analysis to highlevel<br />
R&D.<br />
AA/ICP: Simultaneous ICP and our series<br />
of high-quality AA spectrometers offer superior<br />
reliability, precision, sensitivity, and<br />
throughput to deliver maximum performance<br />
and value.<br />
X-ray: Our EDX/XRF/XRD systems are<br />
packed with powerful features to provide<br />
users with versatile, easy-to-use solutions.<br />
Facilities<br />
Shimadzu’s U.S. headquarters includes<br />
customer service and technical support, as<br />
well as a customer training and education<br />
center. Ten regional facilities, strategically<br />
located around the U.S., provide customers<br />
with local sales, service, and technical<br />
support.
www.ssi.shimadzu.com<br />
Explore The Full Spectrum Of Possibilities<br />
Count on Shimadzu <strong>Spectroscopy</strong> for a Variety of Applications<br />
From food, forensics and the environment to drug<br />
discovery, pharmaceuticals and more, Shimadzu can<br />
equip your laboratory with high-quality, cost-effective<br />
solutions for all of your analysis requirements.<br />
More Instruments, More Accessories,<br />
More Applications = More Solutions<br />
UV-VIS-NIR: Award-winning spectrophotometers:<br />
UV-Vis and UV-Vis-NIR that are rugged yet easy<br />
to use. Shimadzu’s proprietary UV Probe software<br />
provides powerful data manipulation capabilities.<br />
FTIR: Our robust, yet stable, FTIR spectrophotometers<br />
deliver optimum performance, sensitivity, and<br />
reliability at an exceptional price, and we offer<br />
more of the sampling accessories you need,<br />
like an automated microscope.<br />
Fluorescence: High-performance<br />
spectrofluorophotometer handles a range<br />
of applications from routine analysis to<br />
high-level R&D.<br />
AA/ICP: High-quality spectrometers<br />
represent the ultimate in<br />
technology by delivering<br />
exceptional performance and<br />
maximum value.<br />
X-ray: Our X-ray fluorescence<br />
spectrometers and X-ray<br />
diffractometers are packed with<br />
powerful features to provide users with<br />
versatile, easy-to-use solutions.<br />
You have demands. Shimadzu delivers.<br />
Learn more about Shimadzu’s spectroscopy products.<br />
Call (800) 477-1227 or visit us online at<br />
www.ssi.shimadzu.com/UV<br />
Order consumables and accessories on-line at http://store.shimadzu.com<br />
Shimadzu Scientific Instruments Inc., 7102 Riverwood Dr., Columbia, MD 21046, U.S.A.
78 SPECTROSCOPY CORPORATE CAPABILITIES DECEMBER 2010<br />
SPEX CertiPrep<br />
www.spectroscopyonline.com<br />
SPEX CertiPrep<br />
203 Norcross Ave.<br />
Metuchen, NJ 08840<br />
TELEPHONE<br />
(800) 522-7739<br />
FAX<br />
(732) 603-9647<br />
E-MAIL<br />
CRMsales@spexcsp.com<br />
WEB SITE<br />
www.spexcertiprep.com<br />
NUMBER OF EMPLOYEES<br />
50<br />
YEAR FOUNDED<br />
1954<br />
Company Description<br />
SPEX CertiPrep is a leading manufacturer of certified reference<br />
materials (CRMs) and calibration standards for analytical spectroscopy<br />
and chromatography. We offer a full range of organic<br />
and inorganic CRMs for ICP, ICP-MS, AA, GC, GC–MS, and<br />
HPLC. We are certified by UL-DQS for ISO 9001:2008 and are<br />
proud to be accredited by A2LA for both organic and inorganic<br />
CRMs under ISO 17025:2005 and ISO Guide 34-2000. The<br />
scope of our accreditation is the most comprehensive in the<br />
industry and encompasses all our manufactured products. We<br />
also offer laboratories the option to create their own custom<br />
standards with quick turnaround time at no additional cost.<br />
Chief Spectroscopic Techniques Supported<br />
⦁ ICP<br />
⦁ ICP-MS<br />
⦁ IC<br />
⦁ AA<br />
⦁ ISE<br />
⦁ XRF<br />
⦁ XRD<br />
⦁ GC<br />
⦁ GC–MS<br />
⦁ HPLC<br />
Markets Served<br />
SPEX CertiPrep supplies certified reference materials to laboratories<br />
worldwide in the following markets: research and development<br />
laboratories, environmental laboratories, wastewater<br />
treatment facilities, cement facilities, state and federal government<br />
agencies, industrial laboratories, manufacturing facilities,<br />
clinical laboratories, colleges and universities,<br />
public utilities, oil refiners, nuclear<br />
plants, winery, wastewater and drinking<br />
water labs, and more.<br />
Major Products/Services<br />
SPEX CertiPrep’s products include aqueous<br />
and organometallic certified reference<br />
materials for ICP-MS, ICP, and AA; organic<br />
standards for GC, GC–MS, and HPLC; ion<br />
chromatography and ion selective electrode<br />
standards; inorganic and organic<br />
quality control samples; and fusion fluxes<br />
and additives for XRF analysis. We also<br />
manufacture a line of contamination control<br />
products including sub-boiling acid<br />
stills, a pipette washer, and OdorEroder<br />
odor control products. Our newest product<br />
offering includes a line of pure and<br />
ultra-pure fusion fluxes and additives. Our<br />
services include shipment of stock items<br />
within 24–48 hours from our Metuchen,<br />
New Jersey facility. Technical customer<br />
service is available Monday through Friday<br />
8:00 am – 5:30 pm EST. Live chat, along<br />
with our complete product catalog and a<br />
technical knowledge base is also available<br />
at our newly redesigned website:<br />
www.spexcertiprep.com.<br />
Facilities<br />
Our US headquarters is located in<br />
Metuchen, New Jersey. All our products are<br />
manufactured and shipped from this facility.<br />
SPEX CertiPrep, Ltd. is the European<br />
subsidiary of SPEX CertiPrep, Inc. and is<br />
located in Middlesex, England. Distributors<br />
throughout Europe support this branch.
All your CRM needs,<br />
right where you need them.<br />
www.spexcertiprep.com<br />
Our newly redesigned Web site puts<br />
CRM resources at your fingertips.<br />
For more than half a century, SPEX CertiPrep has been providing superior<br />
Certified Reference Materials (CRMs) for spectroscopy and chromatography,<br />
offering an unparalleled selection of inorganic and organic standards.<br />
Now, our redesigned Web site offers the information and resources you<br />
need on our products, all in one place:<br />
: : Easy ordering system : : Live chat<br />
: : Technical literature : : Trade show information<br />
: : “Ask a chemist” : : Enhanced product search<br />
: : Custom standard request : : E-newsletter<br />
And much more! Visit us at www.spexcertiprep.com.<br />
203 Norcross Avenue<br />
Metuchen, NJ 08840<br />
www.spexcertiprep.com<br />
E-mail: crmsales@spexcsp.com<br />
Phone: 1-800-LAB-SPEX<br />
Fax: 732-603-9647<br />
© SPEX CertiPrep, Inc. 2010<br />
WA-10A
80 SPECTROSCOPY CORPORATE CAPABILITIES DECEMBER 2010<br />
Spellman High Voltage Electronics<br />
www.spectroscopyonline.com<br />
Markets Served<br />
We offer power supplies with well regulated outputs from<br />
www.spectroscopyonline.com DECEMBER 2010 SPECTROSCOPY CORPORATE CAPABILITIES 81<br />
Teledyne Leeman Labs<br />
Teledyne Leeman Labs<br />
6 Wentworth Drive<br />
Hudson, NH 03051<br />
TELEPHONE<br />
(603) 886-8400<br />
FAX<br />
(603) 886-9141<br />
E-MAIL<br />
leemanlabsinfo@teledyne.com<br />
WEB SITE<br />
www.teledyneleemanlabs.com<br />
NUMBER OF EMPLOYEES<br />
60<br />
YEAR FOUNDED<br />
1981<br />
Company<br />
Description<br />
Since its founding<br />
in 1981, Teledyne<br />
Leeman Labs has<br />
been an innovator in<br />
atomic spectroscopy<br />
and introduced many<br />
concepts that are now<br />
considered industry<br />
standards. Among<br />
these were the first use of an echelle spectrometer for ICP-OES<br />
and the first fully automated mercury analyzers.<br />
Now a leading supplier of instruments for elemental analysis, we<br />
take great pride in the quality and value of our products and the<br />
depth of our commitment to customer satisfaction.<br />
Chief Spectroscopic Techniques Supported<br />
⦁ Inductively coupled plasma (ICP) spectrometers<br />
⦁ DC Arc spectrometers<br />
⦁ Mercury analysis<br />
Markets Served<br />
Leeman Labs’ products are used in applications essential to QA/<br />
QC, environmental analysis, R&D, and process control. They are<br />
used in industries including: aerospace, agriculture, automotive,<br />
beverage, biofuels, chemicals and petrochemicals, clinical,<br />
electronics, environmental/contract labs, foods/food processing,<br />
forensics, geological, hazardous waste, <strong>metals</strong> manufacturing,<br />
mining, nuclear, petroleum/gas, pharmaceutical/supplements,<br />
power generation, soils, wastewater, and wear <strong>metals</strong>/oils.<br />
Major Products/Services<br />
Inductively coupled plasma (ICP) spectrometers:<br />
Prodigy ICP brings together a state-of-the-art, large format,<br />
programmable array detector (L-PAD) with an advanced high<br />
dispersion Echelle spectrometer to provide exceptional analytical<br />
performance. Prodigy is our most powerful and versatile ICP<br />
spectrometer. Prism ICP is a high performance cost effective<br />
simultaneous array detector ICP. Designed for practicality and<br />
performance, Prism is a great solution for many QA/QC and<br />
environmental analysis applications. Profile Plus<br />
ICP is a great stepup<br />
from atomic absorption spectrometers and is a cost effective<br />
solution for labs with limited sample loads.<br />
Mercury Analyzers: Hydra II AA<br />
operates on the principle of cold<br />
vapor atomic absorption (CVAA) to provide the analyst with a<br />
1 ppt detection limit as well as compatibility with an extremely<br />
wide range of sample matrices. Hydra II AF<br />
operates on the principle<br />
of cold vapor atomic fluorescence (CVAF) and is available in<br />
two configurations. The first is the core Hydra II AF<br />
which provides<br />
a detection limit of 0.1 ppt and a dynamic<br />
range that extends to the high ppb level. For<br />
laboratories that require even lower limits of<br />
detection, the Hydra II AFGold<br />
includes a gold<br />
amalgamation system to preconcentrate<br />
mercury and yield a limit of detection well<br />
below 0.05 ppt. Hydra-C operates on the<br />
principle of thermal decomposition with<br />
atomic absorption detection to facilitate the<br />
direct analysis of solid or liquid samples.<br />
Hydra-C is designed to address the needs of<br />
analysts who want to use EPA method 7473<br />
or who simply want to determine mercury<br />
without having to digest their samples.<br />
DC Arc Spectrometer: Prodigy DC Arc is<br />
designed for fast, quantitative elemental<br />
analyses of difficult to dissolve samples.<br />
Prodigy DC Arc performs elemental analysis<br />
of samples in their native form without<br />
sample digestion. Few other techniques can<br />
challenge the ease-of-use or productivity of<br />
DC Arc when it comes to samples that are<br />
difficult or impossible to digest.<br />
Inorganic Standards and Reagents:<br />
Plasma-Pure Standards: Single and Multielement<br />
standards for AA, ICP, and ICP-MS<br />
as well as high purity reagents for mercury<br />
analysis.<br />
Facilities<br />
Teledyne Leeman Labs is located in Hudson,<br />
New Hampshire. The facility offers both<br />
training and demonstration areas to better<br />
serve our customer base. Sales offices and<br />
representatives are located worldwide to<br />
provide sales, service, and support on all our<br />
instrumentation.
82 SPECTROSCOPY CORPORATE CAPABILITIES DECEMBER 2010<br />
Thermo Fisher Scientific<br />
www.spectroscopyonline.com<br />
Markets Served<br />
Our growing portfolio of products includes<br />
innovative technologies for a multitude<br />
of markets including food safety, environmental<br />
testing, materials science, and<br />
pharmaceutical.<br />
Major Products/Services<br />
Thermo Scientific spectroscopy instruments<br />
are ideal for investigative analysis<br />
or quality control applications.<br />
<strong>Spectroscopy</strong> systems are used to determine<br />
the molecular or elemental composition<br />
of a wide range of complex samples,<br />
including liquids, solids, and gases. We offer<br />
an expansive range of techniques, such<br />
as FT-IR, FT-NIR, infrared microsampling,<br />
Raman spectroscopy, AA, ICP, ICP-MS and<br />
ARL OES, XRD and XRF spectrometers.<br />
Thermo Fisher Scientific<br />
Instruments<br />
5225 Verona Road<br />
Madison, WI 53711<br />
TELEPHONE<br />
(800) 532-4752<br />
FAX<br />
(608) 273-5046<br />
E-MAIL<br />
analyze@thermofisher.com<br />
WEB SITE<br />
www.thermoscientific.com<br />
Company Description<br />
Thermo Fisher Scientific is the world leader in serving science,<br />
enabling our customers to make the world healthier, cleaner,<br />
and safer. Our goal is to make our customers more productive<br />
and to enable them to solve their analytical challenges,<br />
from routine testing to complex research and discovery. We<br />
offer a wide range of products including analytical instruments,<br />
equipment, reagents and consumables, software, and<br />
services for research, analysis, discovery, and diagnostics. Our<br />
manufacturing sites in the United States and Europe provide<br />
products for customers within pharmaceutical and biotech<br />
companies, hospitals and clinical diagnostic labs, universities,<br />
research institutions, and government and environmental<br />
industries.<br />
Chief Spectroscopic Techniques Supported<br />
⦁ AA<br />
⦁ ICP<br />
⦁ ICP-MS<br />
⦁ Combustion analyzers<br />
⦁ FT-IR<br />
⦁ FT-NIR<br />
⦁ UV-Vis<br />
⦁ Raman<br />
⦁ EDS/WDS/EBSD<br />
⦁ OES<br />
⦁ XRD<br />
⦁ XRF
© 2009 Thermo Fisher Scientific Inc. All rights reserved. All trademarks are the property of Thermo Fisher Scientific Inc.<br />
and its subsidiaries.<br />
Surprising performance –<br />
200W performance from 50W power.<br />
Get surprised by the Thermo Scientific ARL OPTIM’X XRF Analyzer<br />
delivering performance beyond your expectations due to our unique<br />
UCCO Ultra Closely Coupled Optics technology<br />
• Innovative UCCO technology combined with SmartGonio and/or<br />
MultiChromators to achieve highest sensitivity<br />
• 200W equivalent analytical performance from 50W X-ray power<br />
• Pre-calibrated turn key packages for cement, slags or petroleum<br />
analysis<br />
• Capability of multi-matrix fluorine to uranium analysis using<br />
OptiQuant standard-less program<br />
• Lowest cost of ownership thanks to low operating cost, highest<br />
reliability and minimal auxiliary equipment<br />
Visit www.thermoscientific.com/optilab for<br />
more information on the new generation of<br />
Thermo Scientific ARL OPTIM'X XRF Analyzer.<br />
Join the large number of users that benefit from the extreme<br />
reliability and stability of our ARL OPTIM’X spectrometer.<br />
You’ll be surprised by the price too!<br />
E-mail: analyze@thermo.com<br />
Moving science forward<br />
Part of Thermo Fisher Scientific
84 SPECTROSCOPY CORPORATE CAPABILITIES DECEMBER 2010<br />
WITec GmbH<br />
www.spectroscopyonline.com<br />
WITec GmbH<br />
Main Address:<br />
Lise-Meitner-Str. 6, 89081<br />
Ulm, Germany<br />
WITec Instruments Corp.<br />
200 East Broadway Ave.<br />
Suite 30, Maryville, TN 37804<br />
TELEPHONE<br />
+49 (0) 731 140 700<br />
USA: (865) 984-4445<br />
FAX<br />
+49 (0) 731 140 7020<br />
USA: (865) 984-4441<br />
E-MAIL<br />
info@witec.de<br />
WEB SITE<br />
www.witec.de<br />
NUMBER OF EMPLOYEES<br />
33<br />
YEAR FOUNDED<br />
1997<br />
Company Description<br />
WITec is a manufacturer of high-resolution optical and scanning<br />
probe microscopy solutions for scientific and industrial<br />
applications. A modular product line allows the combination<br />
of different microscopy techniques such as Raman, NSOM, or<br />
AFM in one instrument. The company’s product line features<br />
a near-field scanning optical microscope, using unique cantilever<br />
technology, a confocal raman microscope designed for<br />
highest sensitivity and resolution, and an AFM for material<br />
research and nanotechnology. Focusing on innovations and<br />
constantly introducing new technologies, WITec is the leading<br />
expert for a vide variety of optical, structural, and chemical<br />
imaging tasks.<br />
Chief Spectroscopic Techniques Supported<br />
⦁ Raman spectroscopy<br />
⦁ Confocal raman imaging<br />
⦁ Ultrafast confocal raman imaging<br />
⦁ Confocal and near-field fluorescence spectroscopy<br />
⦁ Upgradeable with atomic force and near-field microscopy<br />
capabilities<br />
Markets Served<br />
WITec products are delivered worldwide to academic and<br />
industrial research labs focusing on high-resolution chemical<br />
imaging and materials characterization. Areas of application<br />
for WITec’s confocal raman imaging systems include polymer<br />
sciences, pharmaceutics, life science, geoscience, thin films<br />
and coating analysis, semiconductors, and nanotechnology.<br />
Major Products/Services<br />
WITec alpha300 Confocal Raman<br />
Microscope: The alpha300 R is a Raman<br />
imaging system focusing on high-resolution<br />
as well as high-speed spectra and image<br />
acquisition. The acquisition time for a single<br />
Raman spectrum is in the range of one millisecond<br />
or even below; thus, a complete Raman<br />
image consisting of tens of thousands<br />
of spectra can be obtained in one minute or<br />
less. Differences in chemical composition,<br />
although completely invisible in the optical<br />
image, will be apparent in the Raman image<br />
and can be analyzed with a resolution down<br />
to 200 nm.<br />
WITec alpha500 Automated Confocal<br />
Raman & Atomic Force Microscope: The<br />
alpha500 is an automated Confocal Raman<br />
and atomic force microscopy system<br />
incorporating a motorized sample stage<br />
for large samples and customized multiarea/multi-point<br />
measurements. It allows<br />
nondestructive chemical imaging with<br />
Confocal Raman Microscopy as well as<br />
high-resolution topography imaging with<br />
AFM using the integrated piezo scan-stage.<br />
Both modes can be run fully automatically,<br />
guaranteeing the most comprehensive<br />
surface inspection possibilities for systematic<br />
and routine research tasks or highlevel<br />
quality control.<br />
Facilities<br />
WITec Headquarters is located in Ulm,<br />
Germany, and includes the R&D department,<br />
production, sales & marketing, and<br />
administration. WITec Instruments Corp.<br />
in Maryville, Tennessee, is responsible for<br />
North American sales and service activities.
www.spectroscopyonline.com DECEMBER 2010 SPECTROSCOPY CORPORATE CAPABILITIES 85<br />
XOS<br />
Markets Served<br />
End users such as refiners, manufacturers, and third party test<br />
labs in the energy and consumer products markets implement<br />
XOS analyzers to drive yield and throughput improvements,<br />
meet strict regulatory requirements, and enhance<br />
product quality. Regulators use XOS analyzers to enforce<br />
environmental and consumer safety regulations. Instrument<br />
designers and end users in government, universities, and industrial<br />
laboratories call on XOS expertise<br />
in X-ray optics, systems, and application<br />
engineering, from design to complete engine<br />
design.<br />
Major Products/Services<br />
Application-specific analyzers for measurement<br />
of regulated elements including<br />
lead, cadmium, chlorine, and sulfur. Features<br />
include peak detection performance,<br />
low maintenance, and user-friendly operation<br />
in laboratory, at-line, on-line, and<br />
in-the-field environments. Lines include<br />
SINDIE (sulfur); CLORA (chlorine); SIGNAL<br />
(silicon); and HD XRF analyzers (e.g. for<br />
lead and other regulated elements in consumer<br />
products).<br />
XOS<br />
15 Tech Valley Drive<br />
East Greenbush, NY 12061<br />
TELEPHONE<br />
( 518) 880-1500<br />
FAX<br />
( 518) 880-1501<br />
E-MAIL<br />
info@xos.com<br />
WEB SITE<br />
www.xos.com<br />
YEAR FOUNDED<br />
1990<br />
Company Description<br />
XOS is a leading global provider of mission-critical, materialsanalysis<br />
equipment and components for industries and regulators<br />
that must control material quality and performance,<br />
from consumer products (e.g. toys, electronics) to energy<br />
(e.g., petroleum) industries. XOS provides a wide range of<br />
portable, bench-top, and on-line elemental composition<br />
analyzers for field, laboratory, and process applications. XOS<br />
leverages its technology leadership in X-ray optics to supply<br />
application-specific analyzers that measure environmental<br />
and product contaminants such as lead, cadmium, chlorine,<br />
and sulfur. As a supplier to analytical instrument companies,<br />
XOS also offers X-ray optics and sub-systems to enhance analytical<br />
performance in X-ray instruments.<br />
Chief Spectroscopic Techniques Supported<br />
⦁ Monochromatic XRF, MWDXRF, HD XRF<br />
⦁ EDXRF<br />
⦁ WDS, EDS<br />
⦁ Confocal XRF<br />
⦁ XRD, wXRD<br />
X-ray optics for applications including<br />
material composition and thin film analysis;<br />
and material stress, strain, structure,<br />
phase, and texture. XOS is the leading<br />
global manufacturer of Capillary Optics<br />
and Doubly Curved Crystal Optics for X-ray<br />
analytical instrumentation, including X-ray<br />
fluorescence, X-ray diffraction, and electron<br />
beam systems.<br />
Facilities<br />
XOS, headquartered near Albany, New<br />
York, has an established national and<br />
international presence by partnering<br />
with well-established instrument manufacturers;<br />
and also through established<br />
distribution partners who are the most<br />
experienced and respected in the relevant<br />
markets. XOS maintains satellite offices<br />
including in Shenzhen, China.
86 Biological Molecular <strong>Spectroscopy</strong><br />
APPLICATION NOTES – DECEMBER 2010<br />
Portable Transmission FTIR Analysis of Volatile Samples Using<br />
the DialPath Liquid Cell<br />
Frank Higgins, A2 Technologies<br />
Traditionally the analysis of volatile liquids by FTIR<br />
spectroscopy has always entailed a sealed fixed pathlength<br />
cell. This technique is widely used for quantitative<br />
analysis of analytes in volatile solvents with applications<br />
in the fuel, chemical, and pharmaceutical industries. Use<br />
of sealed cells requires a skilled user to add the sample to<br />
the cell by syringe, taking great care to avoid air bubbles<br />
or incomplete filling of the cell. Improper filling can also<br />
cause damage to sealed cells by breaking the window or<br />
amalgam seal with excess pressure. These cells are also<br />
prone to internal reflections that cause significant spectral<br />
artifacts called “fringing” and baseline noise features<br />
from improper cell fitment into the spectrometer. These<br />
drawbacks lead to methods developed with less precision<br />
and accuracy, limiting the utility of the analysis. A2 Technology’s<br />
patented Dialpath liquid cell systems are simple<br />
to both fill and clean, eliminate spectral artifacts and still<br />
provide precise and accurate sample measurement for volatile<br />
samples and solvents.<br />
In this application brief, we will demonstrate that the<br />
open cell design of the DialPath technology is effective<br />
with samples that contain either volatile solutes and/or<br />
volatile solvents. The study will illustrate that evaporation<br />
does not change the sample concentration, during typical<br />
measurement times on the ML analyzer. The experiments<br />
in this work were designed to determine the effect of evaporation<br />
on quantitative measurements using the TumblIR<br />
liquid cell. The results of two experiments, which test the<br />
effects of evaporation and diffusion on calibrated methods<br />
for dioctyl phthalate (DOP, non-volatile analyte) in tetrahydrofuran<br />
(THF, volatile solvent) and benzene (highly<br />
volatile analyte) in hexane (volatile solvent), are presented.<br />
Results<br />
Analytical standards of dioctylphthalate (DOP) in THF<br />
were prepared volumetrically in the 0–5% range, and the<br />
FTIR spectra collected on a ML FTIR analyzer with Dial-<br />
Path Technology. The spectra of the standards were measured<br />
in triplicate collecting 64 scans at 8 cm -1 resolution,<br />
Figure 1: The DOP vol% results from replicate measurements<br />
at increasing delays from sample introduction to DialPath cell<br />
and sample scan initialization. The red line is the mean measured<br />
DOP concentration with no time delay, and the ±2% relative error<br />
from mean time 0 is shown as purple lines.<br />
yielding an 18 s scan time. A quantitative calibration was<br />
developed using partial least squares (PLS) modeling of<br />
the DOP ester absorbance region; two loading vectors were<br />
used. The standard error of cross validation (SECV) for<br />
this method was 0.012% DOP; the actual versus predicted<br />
correlation coefficient (R 2 ) was 0.9999. This method is<br />
loaded into the A2 Technologies MicroLab PC software.<br />
Samples of DOP in THF at 0.5% nominal concentration<br />
were prepared volumetrically. The samples were<br />
prepared with low volumes for convenience and are only<br />
meant to test the repeatability of the instrument and method.<br />
The 0.5% sample was measured with the same method<br />
parameters (18 s scan time) with increasing delays from<br />
sample introduction to the start of scanning. Each sample<br />
was introduced with the cell in the closed position using<br />
plastic transfer pipettes (the solvent wicks into the cell very<br />
easily) and the cell was completely filled (~250 μL). Since<br />
the solvent is the volatile component, the effects due to<br />
evaporation would increase the DOP concentration. Figure<br />
1 shows the replicate measurements of samples 0, 30,<br />
60, 120, and 300 s delay. The mean value for the 0 s delay
APPLICATION NOTES – DECEMBER 2010 Molecular <strong>Spectroscopy</strong> Biological 87<br />
is plotted as the red line and the 2% error limits are plotted<br />
as the two purple lines. The measured DOP concentration<br />
didn’t exceed the 2% relative error until the 300 s delay<br />
time was reached. Even at a 2 min delay, little effect of the<br />
evaporation can be observed. Clearly, evaporation poses no<br />
issues to these measurements using the DialPath sample<br />
interface with measurement times of up to 2 min.<br />
The second experiment involves a volatile solvent (hexane)<br />
and a highly volatile solute (benzene), and represents<br />
the worst case scenario for evaporation effects on quantitative<br />
analysis. A PLS model was created using the benzene<br />
ring in-plane bend absorbance at 670 cm -1 . The model used<br />
one loading vector, had an SECV of 0.0076% benzene and<br />
the actual versus predicted had a correlation of 0.996. A<br />
nominal 0.5% benzene in hexane sample was prepared<br />
and used to test the repeatability at 0, 45, and 60 s delay<br />
between sample introduction and measurement. Figure 2<br />
shows the results of each measurement as well as the average<br />
value of the 0 s delay samples as the red line and the<br />
2% relative error levels as the orange line. Only a single<br />
measurement of the 60 s delay showed greater than 2%<br />
relative error. These results indicate that analysis times of<br />
up to 60 s have no appreciable affect on measurement accuracy,<br />
even for highly volatile samples.<br />
Due to the A2 Technologies fast scanning FTIR technology<br />
and the much slower rate of diffusion, there is no<br />
observed effect of evaporation in the normal 18–45 s scan<br />
time used for DialPath methods. The shape and configuration<br />
of the DialPath cell, Figure 3, also minimizes the effects<br />
of evaporation. The 100 μm pathlength active region<br />
between the top and bottom cell window is filled with only<br />
5 μL of solvent, whereas the typical total fill volume for<br />
the cell is 250 μL. This large difference between sampled<br />
and bulk cell volume, coupled with the distance that the<br />
diffusion gradient has to travel before reaching the inner<br />
sampling region, explains why there are no significant effects<br />
of solvent or solute diffusion or evaporation observed<br />
using the DialPath cell.<br />
Conclusions<br />
This application note has shown that there is no effect on<br />
the accuracy or precision of quantitative methods when<br />
measuring samples with volatile solvents or analytes on<br />
the TumblIR or Dialpath transmission cells. No effect was<br />
seen with methods up to 60 s in length; the PAL spectrometer<br />
can measure 140 scans in 60 s at 4 cm -1 resolution.<br />
The ease of use and simplicity of the TumblIR technology<br />
makes it ideal for many liquid applications including gasoline,<br />
ethanol, reaction monitoring, or solvent extraction.<br />
Figure 2: The benzene vol% results from replicate measurements<br />
at increasing delays from sample introduction to the Dial-<br />
Path cell and sample scan initialization (18 s). The red line is the<br />
mean measured benzene % concentration with no time delay,<br />
and the ±2% relative error from mean time 0 is shown as purple<br />
lines.<br />
Figure 3: The iPAL FTIR spectrometer equipped with the TumblIR<br />
cell (left) and the expanded sample interface region of the<br />
cell (right). The relatively small “active region” (5 μL fill area) in<br />
proportion to the total filled cell volume minimizes the effects of<br />
evaporation and diffusion in the 18-45 s time scale.<br />
The precision of the TumblIR along with the lack of interference<br />
fringing and baseline effects provides methods<br />
with better accuracy than previously obtainable using infrared<br />
spectroscopy.<br />
A2 Technologies<br />
14 Commerce Drive, Danbury, CT 06810<br />
tel. (203) 312-1100; Fax (203) 312-1058<br />
Website: www.a2technologies.com
88 Chiral Molecular <strong>Spectroscopy</strong> APPLICATION NOTES – DECEMBER 2010<br />
Long-Wavelength Dispersive 1064nm Raman:<br />
Non-Invasive Cancer Tissue Diagnostics<br />
BaySpec, Inc.<br />
Overcoming fluorescence background noise in cancerous<br />
biological tissue samples achieved by using<br />
Dispersive 1064nm Raman excitation instruments.<br />
It has been documented that Raman spectroscopy is an effective<br />
technique for detecting molecular changes associated<br />
with cancer; however, it is well-known that fluorescence found<br />
in biological samples generates significant noise complicating<br />
specificity in distinguishing between normal and cancerous<br />
tissue (1).<br />
Raman scattering is a spectroscopic technique capable of<br />
providing highly detailed chemical information about a tissue<br />
sample. In contrast to other optical spectroscopic techniques,<br />
there are a large number of Raman-active molecules in tissue<br />
and their spectral signatures are sharp and well delineated.<br />
The earliest Raman spectroscopy techniques utilized Fourier<br />
transform (FT)–Raman spectroscopy, a method that measures<br />
Raman spectra with high signal-to-noise ratio (S/N) and<br />
minimal fluorescence interference and has been used for many<br />
in vitro applications. However, long integration times and<br />
bulky instrumentation negate this technique for in vivo use.<br />
Early attempts at measuring Raman spectra of tissue were<br />
difficult because of the fluorescent nature of tissue and limitations<br />
of sources and detectors. Today, because of the telecom<br />
boom and bust, there has been a Manhattan Project effect on<br />
the development of lasers and optical components. Ten years<br />
ago, optics, lasers, and detectors were limited to laboratories<br />
on bulky optical benches with sophisticated liquid nitrogen<br />
cooling and complicated alignment/operations requiring a<br />
PhD to operate.<br />
Current chemometric methods rely on mathematical techniques<br />
such as the use of second derivatives, Fourier filtering,<br />
and polynomial fitting to remove the fluorescence background.<br />
Classification algorithms are developed using a variety<br />
of multivariate statistical methods such as linear and nonlinear<br />
discrimination analysis, neural networks, genetic algorithms,<br />
and cluster analysis. The resulting end goal is to obtain high<br />
sensitivity and specificity in the recognition of a target condition<br />
amidst a variety of tissue categories depending upon the<br />
tissue type.<br />
Today, without sacrificing performance in many cases,<br />
lasers are the size of your little finger; Newton’s prism has been<br />
replaced by a high-throughput holographic volume phase<br />
Figure 1: Raman spectra of normal human kidney tissue and<br />
cancerous tissue.<br />
grating; and detectors can be thermoelectrically air-cooled,<br />
doing away with liquid nitrogen. Using low-profile, surfacemount<br />
electronics completes the picture, enabling spectrometers<br />
the size of your Blackberry or iPhone.<br />
Therefore, for the first time, a ruggedized no moving parts<br />
dispersive long-wavelength 1064 nm Raman spectroscopy in<br />
conjunction with multivariate statistical technique has the potential<br />
for rapid in vivo diagnosis of benign and malignant<br />
tissues based on the optical evaluation of spectral features of<br />
biomolecules.<br />
For more information contact us at info@bayspec.com.<br />
References<br />
(1) A. Mahadevan-Jansen, Biomedical Photonics Handbook,<br />
T. Vo-Dinh, Ed. (CRC Press, Washington, D.C., 2003), pp. 30:1–<br />
30:27.<br />
(2) Charge-Transfer Devices in <strong>Spectroscopy</strong>, J.V. Sweedler<br />
(Editor), Kenneth L. Ratzlaff (Editor), B.M. Denton<br />
(Editor), published by John Wiley & Sons, Inc., March 1994.<br />
BaySpec, Inc.<br />
1101 McKay Drive, San Jose, CA 95131<br />
tel. (408) 512-5928<br />
Website: www.bayspec.com<br />
Email: info@bayspec.com
APPLICATION NOTES – DECEMBER 2010<br />
Molecular <strong>Spectroscopy</strong> 89<br />
Determination of Low Concentration Methanol in Alcohol<br />
by an Affordable High Sensitivity Raman Instrument<br />
Duyen Nguyen and Eric Wu, Enwave Optronics, Inc.<br />
Low concentration natural methanol exists in most alcoholic<br />
beverages and usually causes no immediate health<br />
threat. Nevertheless, it is possible to have natural occurring<br />
methanol in beverages with concentration as high as 18 grams<br />
per liter of ethanol; or equivalent to 0.72% methanol in 40%<br />
ethanol, in alcohol (1). Current EU regulation limits naturally<br />
occurring methanol to below 10 grams per liter of ethanol;<br />
or equivalent to 0.4% methanol in 40% ethanol.<br />
Raman spectroscopy has been shown to be an effective tool<br />
in compositions analysis as well as adulteration identifications in<br />
foods (2). In the alcoholic beverage industry, the standard composition<br />
analysis method were more expensive and time-consuming<br />
gas chromatography (3). Here, we present a Raman spectroscopy<br />
method for a quick and lower cost alternative to verify the<br />
existence of low concentration methanol in alcohol.<br />
Experiment<br />
40% ethanol/water solution was prepared using 200-proof<br />
ethanol and distilled water. HPLC grade methanol<br />
was added into the 40% ethanol solution to make<br />
samples with methanol concentration ranging from<br />
50 ppm to 2.5%. An Enwave Optronics’ ProRaman instrument<br />
with laser excitation at 785 nm was used for the measurements.<br />
The sample solutions were measured in quartz cuvette<br />
in a sample holder. Figure 1 depicts the results of the measured<br />
spectra in the fingerprint region of the Raman spectra.<br />
Partial least square (PLS) regression method was used for<br />
calibration and prediction model for methanol. The spectral<br />
region from 950–1200 cm -1 was chosen for developing the<br />
calibration model. The actual vs. predicted concentration<br />
value of methanol is shown in Figure 2. It is shown that the<br />
measured data and PLS prediction match very well with correlation<br />
coefficient R 2 @ 0.997.<br />
Conclusion<br />
An affordable, high sensitivity ProRaman instrument was used<br />
with PLS method to successfully analyze low concentration methanol<br />
in 40% alcohol. Based on our findings, the detection limit for<br />
methanol in 40% of ethanol is much better than 50 ppm and reliable<br />
quantitative determination using PLS prediction could reach<br />
50 ppm of methanol in 40% alcohol.<br />
References<br />
(1) Bindler F., Voges E., Laugel P. “The problem of methanol concentration<br />
admissible in distilled fruit spirits.” Food Addit Contam 1988: 5: 343–351.<br />
Figure 1: The fingerprint range spectra of the various solutions.<br />
Figure 2: Actual and predicted methanol concentrations using<br />
PLS regression model.<br />
(2) Mackenzie, W.M. and Aylott, R.I. “Analytical strategies to confirm<br />
Scotch whisky authenticity.” The Analyst (2004), 129 : 607–612.<br />
(3) Reid, L.M., O’Donnell, C.P., Downey, G. “Recent technological<br />
advances for the determination of food authenticity.” Trends in Food<br />
Science & Technology (2006), 17: 344–353.<br />
Enwave Optronics, Inc.<br />
18200 McDurmott St., Suite B, Irvine, CA 92614<br />
tel. (949) 955-0258; fax (949) 955-0259<br />
Website: www.enwaveopt.com
90 Molecular <strong>Spectroscopy</strong> APPLICATION NOTES – DECEMBER 2010<br />
High-Resolution NIR Analysis<br />
R. Morris, Ocean Optics, Inc.<br />
New detector and optical bench options make it possible<br />
to configure near-infrared spectrometer setups<br />
for high-resolution applications such as laser and optical<br />
fiber characterization. Our NIRQuest-series spectrometers<br />
cover various segments of the 900–2500 nm<br />
region and serve a variety of application needs.<br />
Near-infrared spectroscopy is a common analytical technique<br />
for chemistry and process control, where typical applications<br />
include identiffcation of species and determination<br />
of water and fat content. In applications like those, absorbance<br />
peaks are often broad and optical resolution requirements of<br />
lesser concern than performance parameters such as low noise<br />
and high sensitivity.<br />
Yet there also are number of NIR applications where optical<br />
resolution of
<strong>Spectroscopy</strong><br />
485F US Highway 1 South,<br />
Suite 100<br />
Iselin, NJ 08830<br />
TELEPHONE<br />
(732) 596-0276<br />
FAX<br />
(732) 596-0003<br />
E-MAIL<br />
spectroscopyedit@<br />
advanstar.com<br />
WEB SITE<br />
www.spectroscopyonline.com<br />
DATE FOUNDED<br />
1985<br />
<strong>Spectroscopy</strong><br />
An Advanstar Science Publication<br />
Company Description<br />
<strong>Spectroscopy</strong> is the most<br />
widely read publication devoted<br />
exclusively to spectroscopic<br />
technology, serving an<br />
audience of over 26,000 North<br />
American spectroscopists in<br />
industry, the government, and<br />
academia. Provided to qualified<br />
subscribers at no cost, <strong>Spectroscopy</strong><br />
has established a<br />
reputation for presenting timely<br />
and practical information for<br />
spectroscopists at all skill levels.<br />
We feature peer-reviewed technical articles, authoritative columns,<br />
helpful tutorials, and comprehensive product information<br />
on the full range of spectroscopic techniques and applications. By<br />
presenting scientifically rigorous information in a user-friendly<br />
format, we promote wider and more effective use of spectroscopy<br />
in research, industry, and the life sciences.<br />
Chief Spectroscopic Techniques Supported<br />
Articles in <strong>Spectroscopy</strong> focus on all major atomic, mass, and<br />
molecular spectroscopic techniques, including AA, ICP, fluorescence,<br />
FT-IR, MS, hyphenated techniques, near-IR, NMR, Raman,<br />
surface analysis and imaging, UV–Vis, terahertz, and X-ray. We<br />
also cover important issues of broad interest, such as:<br />
• Lasers and optics<br />
• Chemometrics and statistical data treatment<br />
• Spectral interpretation<br />
• Sample preparation and handling<br />
• Quality issues, validation, calibration, and regulatory compliance<br />
• Instrument design<br />
Markets Served<br />
<strong>Spectroscopy</strong> serves R&D and QA/QC chemists and other scientists<br />
working in virtually all major sectors of private industry;<br />
researchers and educators at universities and colleges; scientists<br />
at government laboratories and regulatory agencies; clinical and<br />
biomedical researchers; analysts at independent laboratories; and<br />
others interested in the field.<br />
<strong>Spectroscopy</strong> is indexed or abstracted by the Chemistry<br />
Citation Index, Excerpta Medica, Chemical Abstracts Service,<br />
Analytical Abstracts, Mass Spectrometry Bulletin, and other<br />
information services.<br />
Issues & Supplements<br />
<strong>Spectroscopy</strong> publishes a monthly print<br />
issue, with each issue focusing on specific<br />
topics, including the February Pittcon issue,<br />
the March Salary Survey, and the<br />
July X-Ray issue. In addition to these<br />
informative and useful monthly issues,<br />
<strong>Spectroscopy</strong> also publishes a series of<br />
supplements on a wide range of topics.<br />
The February and September “Application<br />
Notebooks” connect lab scientists with<br />
the products they need to make their<br />
laboratories more efficient and productive,<br />
while our yearly primer series explores<br />
the topics of Raman Technology, FT-IR,<br />
and ICP. <strong>Spectroscopy</strong>’s quarterly Current<br />
Trends in Mass Spectrometry supplement<br />
and yearly Homeland Security, “Buyers’<br />
Guide,” and “Corporate Capabilities” issues<br />
also provide our readership with the<br />
kind of useful information that cannot be<br />
found elsewhere. Our monthly newsletter,<br />
“The Wavelength,” brings valuable<br />
technical information to readers electronically,<br />
while our monthly Global Digital<br />
Edition brings <strong>Spectroscopy</strong>’s content to a<br />
worldwide audience. Our website, www.<br />
spectroscopyonline.com, provides readers<br />
with a continually updated resource on<br />
the spectroscopy market, and our<br />
LinkedIn site provides readers with a valuable<br />
social network of colleagues in the<br />
field of materials analysis.<br />
Advertising & Marketing Services<br />
<strong>Spectroscopy</strong> provides a range of advertising<br />
and marketing services to assist<br />
suppliers of the spectroscopy market.<br />
Print-based Marketing:<br />
• Display advertising<br />
• Custom publishing<br />
• Inserts and outserts<br />
• Direct mail lists<br />
• Post-it Notes<br />
• Business Reply Cards<br />
Web-based Marketing:<br />
• Website advertising<br />
• Web seminars<br />
• Podcasts<br />
• Flash presentations<br />
• On-line surveys<br />
• Product e-mail blasts<br />
• E-newsletters<br />
• E-Application note alerts
© 2010 Thermo Fisher Scientific Inc. All rights reserved. Copyrights in and to the UV-Vis image are owned<br />
by a third party and licensed for limited use only to Thermo Fisher Scientific by iStockphoto.<br />
Evolutionary technology – revolutionary value.<br />
Generations of researchers have relied on Thermo Scientific<br />
UV-Visible spectrophotometers for their most critical analyses.<br />
Our new family of UV-Vis and fluorescence systems builds on<br />
this tradition, delivering performance and value for life science,<br />
biochemical, pharmaceutical and material science applications.<br />
Evolution Array UV-Vis spectrophotometer – fast, full spectrum<br />
data for routine, research and high-throughput applications.<br />
Lumina fluorescence spectrometer – delivers high resolution<br />
and exceptional sensitivity for the most accurate measurements.<br />
Evolution 300/600 UV-Vis Series – robust optical design,<br />
intuitive software, and the highest quality accessories for the<br />
ultimate in analytical performance.<br />
Complete UV-Vis and<br />
Fluorescence Solutions<br />
Providing researchers and QC laboratories<br />
with reliable, accurate systems,<br />
software, and accessories to meet<br />
their evolving application needs.<br />
Discover more about the evolution at<br />
www.thermoscientific.com/uv-vis.<br />
Moving science forward