DRIVIN G ROWTH - Dr. Reddy's
DRIVIN G ROWTH - Dr. Reddy's
DRIVIN G ROWTH - Dr. Reddy's

Create successful ePaper yourself
Turn your PDF publications into a flip-book with our unique Google optimized e-Paper software.
MUCH OF THE CASH FLOW ARISING OUT OF FLUOXETINE<br />
WILL BE INVESTED IN MOVING UP THE VALUE CHAIN — IN<br />
DRUG DISCOVERY, R&D, INNOVATION, ACQUISITIONS AND<br />
COMMERCIALISATION.<br />
2002, the joint venture had secured 7<br />
product approvals, with another 12 in the<br />
pipeline.<br />
In India, <strong>Dr</strong>. Reddy’s total revenue has<br />
grown by 13 per cent — from Rs. 5,362<br />
million in 2000-01 to Rs. 6,041 million in<br />
2001-02. This has been driven by a 15 per<br />
cent growth in the revenue of APIs (from<br />
Rs. 1,433 million to Rs. 1,641 million), and<br />
11 per cent in that of branded formulations<br />
(from Rs. 3,642 million to Rs. 4,042<br />
million). In addition, emerging business,<br />
though small in absolute terms, grew by 25<br />
per cent to Rs. 358 million.<br />
In December 2001, <strong>Dr</strong>. Reddy’s acquired<br />
six brands in the dental segment from the<br />
Mumbai-based Group Pharmaceuticals,<br />
propelling us to No. 1 position in the dental<br />
segment as per CMARC’s prescription audit.<br />
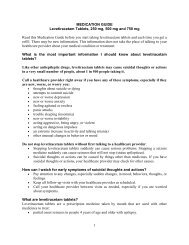
SBU performance<br />
WE NOW MOVE ON to the<br />
performance of <strong>Dr</strong>. Reddy’s Strategic<br />
Business Units or SBUs. These are: (i) APIs<br />
or bulk actives, (ii) branded formulations,<br />
(iii) generics, (iv) emerging businesses, and<br />
(v) custom chemical services or CCS. Table<br />
2 gives the revenues according to SBUs.<br />
APIS (BULK ACTIVES)<br />
DURING THE YEAR, the APIs business<br />
Table 2<br />
|<br />
<strong>Dr</strong>. Reddy’s revenues according to SBUs<br />
RS. MILLION<br />
2001-02 AS A% G<strong>ROWTH</strong> % 2000-01 AS A %<br />
API (bulk actives) 4,997 32% 16% 4,312 44%<br />
India 1,641 33% 15% 1,433 33%<br />
International 3,356 67% 17% 2,879 67%<br />
Branded formulations 6,057 39% 23% 4,938 50%<br />
India 4,042 67% 11% 3,642 74%<br />
International 2,015 33% 55% 1,296 26%<br />
Generics 4,066 26% 304 3%<br />
Emerging businesses 358 2% 25% 287 3%<br />
Custom chemical services 100 1% – 0%<br />
Total revenues 15,578 100% 58% 9,841 100%<br />
Other operational income 423<br />
Total operational income 16,001 9,841<br />
recorded a revenue of Rs. 4,997 million<br />
compared to Rs. 4,312 million in FY 01.<br />
This 16 per cent increase was driven by<br />
ciprofloxacin and sparfloxacin and the<br />
Table 3<br />
|<br />
Sale of major APIs and their share in<br />
APIs revenue<br />
RS. MILLION<br />
2001-02 AS A% 2000-01 AS A %<br />
Ciprofloxacin 838 16.8% 568 13.2%<br />
Nizatidine 373 7.5% 3 0.1%<br />
Ibuprofen 371 7.4% 373 8.6%<br />
Sparfloxacin 358 7.2% 161 3.7%<br />
Ranitidine Fm 1 231 4.6% 47 1.1%<br />
Naproxen Sodium 226 4.5% 240 5.6%<br />
Dextromethorphan 223 4.5% 194 4.5%<br />
Ranitidine Hcl 209 4.2% 336 7.8%<br />
Enrofloxacin 172 3.4% 194 4.5%<br />
Doxazosin Mesylate 131 2.6% 197 4.6%<br />
Others 1,865 37.3% 1,999 46.3%<br />
Total 4,997 100.0% 4,312 100.0%<br />
DR. REDDY’S LABORATORIES LTD. | MANAGEMENT DISCUSSION AND ANALYSIS | ANNUAL REPORT 2001-2002<br />
51