investigating derecho and supercell proximity soundings - Storm ...
investigating derecho and supercell proximity soundings - Storm ...
investigating derecho and supercell proximity soundings - Storm ...

Create successful ePaper yourself
Turn your PDF publications into a flip-book with our unique Google optimized e-Paper software.
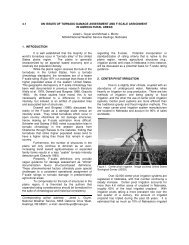
16.1 INVESTIGATING DERECHO AND SUPERCELL<br />
PROXIMITY SOUNDINGS<br />
Jeffry S. Evans*<br />
NOAA/NWS/NCEP/<strong>Storm</strong> Prediction Center, Norman, OK<br />
<strong>and</strong><br />
Charles A. Doswell III<br />
CIMMS/University of Oklahoma, Norman, OK<br />
1. INTRODUCTION<br />
Severe thunderstorm forecasting at the <strong>Storm</strong><br />
Prediction Center is continuing to exp<strong>and</strong> into a more<br />
probabilistic format, where specific forecasts of<br />
severe hail, winds <strong>and</strong>/or tornadoes are made up to<br />
30 hours in advance. To complete this task,<br />
forecasters need to correctly anticipate the primary<br />
mode in which the convection will develop <strong>and</strong>/or<br />
evolve into (i.e. discrete <strong>supercell</strong>s versus a squall<br />
line). Though numerous modeling studies have<br />
examined the role of the thermodynamic <strong>and</strong><br />
kinematic environments in determining convective<br />
mode (Weisman <strong>and</strong> Klemp 1986; Johns et al. 1993;<br />
Stensrud et al 1997), recent work by Bluestein <strong>and</strong><br />
Weisman (2000) emphasizes other factors such as<br />
steering flow relative to the initiating mechanism in<br />
determining convective mode.<br />
Given the problems in discerning the primary<br />
mode of convection, we have accumulated a number<br />
of <strong>proximity</strong> <strong>soundings</strong> associated with both <strong>derecho</strong>s<br />
<strong>and</strong> discrete <strong>supercell</strong>s. It can be argued that<br />
<strong>proximity</strong> <strong>soundings</strong> may not be representative of the<br />
true air mass <strong>and</strong>/or shear utilized by the storms; <strong>and</strong><br />
we concur with several studies that discuss the shortterm<br />
modification of the surrounding environment<br />
ahead of MCSs <strong>and</strong> <strong>supercell</strong>s (Brooks et al. 1994,<br />
Weisman et al. 1998). However, upper air <strong>soundings</strong><br />
are still utilized operationally to aid in forecast <strong>and</strong><br />
occasional warning decisions, <strong>and</strong> they remain the<br />
primary tool for examining the vertical distribution of<br />
temperature, dew point, <strong>and</strong> wind data near deep,<br />
moist convection.<br />
2. METHODOLOGY<br />
2.1 Sounding Classification<br />
In ED01, the authors obtained <strong>and</strong> analyzed 110<br />
<strong>proximity</strong> <strong>soundings</strong> near 67 <strong>derecho</strong>s. The period of<br />
study was from 1983-1993, <strong>and</strong> cases were acquired<br />
in nearly every month of the year. To qualify as a<br />
<strong>proximity</strong> sounding, each sounding must have been<br />
taken within 2 hours <strong>and</strong> 167 km (100 mi) of the<br />
<strong>derecho</strong>’s wind damage path, or the <strong>derecho</strong>’s<br />
location as identified by radar composite charts.<br />
Further, the <strong>soundings</strong> were subjectively judged to be<br />
* Corresponding author address: Jeffry S. Evans, <strong>Storm</strong><br />
Prediction Center, 1313 Halley CR., Norman OK 73069; email:<br />
jeffry.evans@noaa.gov<br />
uncontaminated by convection <strong>and</strong> representative of<br />
the air mass fueling the <strong>derecho</strong>.<br />
In order to assess the different environments<br />
supportive of <strong>derecho</strong>s, the data set was subdivided<br />
into 3 categories based on a subjective analysis of the<br />
synoptic scale “forcing” associated with each event.<br />
Those occurring ahead of an advancing highamplitude<br />
midlevel trough with an accompanying<br />
strong surface cyclone were considered “strong<br />
forcing” (SF) events. Derechos that developed <strong>and</strong><br />
persisted within benign synoptic environments were<br />
labeled “weak forcing” (WF). Events which did not<br />
clearly fit either of the above two categories were<br />
classified as “hybrid” events.<br />
Proximity <strong>soundings</strong> for 98 discrete <strong>supercell</strong>s<br />
were also collected, using the same criteria, in an<br />
attempt to develop a comparison database. The<br />
<strong>supercell</strong>s were subjectively identified utilizing real<br />
time WSR-88d reflectivity <strong>and</strong> storm-relative wind<br />
radar data from 1998-2000. A cell was determined to<br />
be a <strong>supercell</strong> if it maintained a low level rotation in<br />
the 0.5 o scan that lasted for at least 30 minutes. In<br />
addition, a <strong>supercell</strong> was only included if it remained<br />
discrete, in order to eliminate storms which were<br />
embedded within extensive squall lines or <strong>derecho</strong>s.<br />
All the <strong>supercell</strong>s produced some type of severe<br />
weather, as defined by the National Weather Service,<br />
<strong>and</strong> the dataset was stratified into the following<br />
categories: Non-tornadic, Tornadic, Significantly<br />
tornadic <strong>and</strong> weakly tornadic. To qualify as Nontornadic<br />
the storm must have been severe, but did not<br />
produce a report of a tornado. Tornadic <strong>supercell</strong>s<br />
were associated with a report of any tornado.<br />
Significantly tornadic <strong>supercell</strong>s produced a tornado<br />
with damage qualifying the tornado as F2 or greater<br />
using the Fujita Scale. Weakly tornadic <strong>supercell</strong>s<br />
produced no stronger than a F0-F1 tornado.<br />
2.2 Data collected<br />
Temperature <strong>and</strong> dew point data were collected<br />
at the surface <strong>and</strong> at 25 mb intervals for each of the<br />
<strong>proximity</strong> <strong>soundings</strong>. In addition, the U <strong>and</strong> V wind<br />
components were obtained for each sounding at 0.5<br />
km intervals from the surface through 10 km. The<br />
data was interpolated as needed. In addition, several<br />
severe thunderstorm parameters were computed from<br />
each sounding, including 0-3 km storm-relative<br />
helicity, Bulk-Richardson Number (BRN), BRN-shear,<br />
<strong>and</strong> Energy-Helicity Index (EHI). Statistical analyses<br />
were computed for the various parameters <strong>and</strong> for<br />
temperature, dew point <strong>and</strong> wind component data at<br />
1
each level. This allowed plots of temperature <strong>and</strong><br />
dew point to be made on a skew-T, <strong>and</strong> hodographs<br />
to be developed for each of the categories. Plots<br />
were created for the means <strong>and</strong> the 10 th , 25 th , 75 th<br />
<strong>and</strong> 90 th percentiles.<br />
The speed <strong>and</strong> direction of each <strong>derecho</strong> <strong>and</strong><br />
<strong>supercell</strong> motion were obtained so that storm-relative<br />
wind plots could be developed by subtracting the U<br />
<strong>and</strong> V components for each storm motion from the<br />
ambient wind components at each level. Statistical<br />
plots were created for each of the <strong>derecho</strong> <strong>and</strong><br />
<strong>supercell</strong> categories to examine the differences in<br />
storm-relative flow from the surface through 10 km.<br />
3. RESULTS<br />
Using the above-mentioned criteria, 51 WF, 47<br />
SF <strong>and</strong> 15 Hybrid <strong>derecho</strong> <strong>proximity</strong> <strong>soundings</strong> are<br />
included in this study. In addition, 46 non-tornadic<br />
<strong>and</strong> 52 tornadic <strong>supercell</strong> <strong>proximity</strong> <strong>soundings</strong> are<br />
used. Of the 52 tornadic <strong>supercell</strong>s, 18 are<br />
associated with significant tornadoes <strong>and</strong> 34 with F0<br />
or F1 tornadoes.<br />
3.1 Thermodynamics<br />
Figure 1a reveals WF <strong>derecho</strong>s exist in a warmer<br />
environment <strong>and</strong> moister boundary layer on average,<br />
as compared to the SF events. The SF events have<br />
the coolest temperature profile, while the Hybrids are<br />
in between (not shown). Although this may be a<br />
reflection of climatology, it is consistent with ED01<br />
who found WF events are associated with greater<br />
instability. WF events in this dataset only occur during<br />
the warm season from May to August, while SF cases<br />
occur year round <strong>and</strong> include many cool season<br />
events. The <strong>derecho</strong> mean <strong>soundings</strong> (Fig. 1a) also<br />
reveal a dry layer <strong>and</strong> associated steep lapse rate in<br />
the mid troposphere, which suggests the most<br />
common source region for evaporation <strong>and</strong><br />
enhancement of the downdraft may extend from just<br />
above the PBL into the mid troposphere for <strong>derecho</strong><br />
environments. However, a well-mixed <strong>and</strong> dry subcloud<br />
layer can also support an enhanced downdraft<br />
<strong>and</strong> cold pool, with a resultant path of damaging<br />
surface winds (Corfidi 2000).<br />
In contrast to the <strong>derecho</strong> events, the mean<br />
<strong>soundings</strong> for tornadic versus non-tornadic <strong>supercell</strong>s<br />
are practically no different, with very little difference<br />
evident between the non-tornadic <strong>and</strong> weakly tornadic<br />
events (not shown). Only the significantly tornadic<br />
<strong>supercell</strong>s indicated any noticeable separation from<br />
the other <strong>supercell</strong> categories (Fig. 1b). These<br />
events clearly have lower temperature-dew point<br />
spread from the surface through 850 mb.<br />
Significantly tornadic <strong>supercell</strong>s occur within the<br />
highest boundary layer RH on average (Fig. 2). In<br />
contrast, these cases surprisingly have the greatest<br />
drop-off in RH between 800 mb <strong>and</strong> 700 mb. In fact,<br />
the significantly tornadic <strong>supercell</strong>s have the lowest<br />
mean 700-500 mb RH of the six datasets (including<br />
Figure 1. Mean temperature <strong>and</strong> dew point. (a) WF <strong>derecho</strong><br />
(black) versus SF <strong>derecho</strong>s (gray), (b) F2 or greater tornado<br />
(black) versus F0-F1 tornado (gray).<br />
the <strong>derecho</strong>s)! This suggests mid-level drying alone<br />
cannot be used to determine the potential for<br />
sustained, long-lived wind damage; downdrafts<br />
might be as stronger or on average in<br />
significantly tornadic <strong>supercell</strong>s as compared to<br />
<strong>derecho</strong>s. In addition, the non-tornadic <strong>supercell</strong>s<br />
show the lowest mean RH through 800 mb, followed<br />
closely by the weakly tornadic cases. This suggests<br />
boundary layer RH may be helpful in discriminating<br />
between not only tornadic <strong>and</strong> non-tornadic<br />
<strong>supercell</strong>s, but also significant <strong>and</strong> weak tornadoes.<br />
Given the close association of boundary layer RH <strong>and</strong><br />
LCL height, our findings support the belief that<br />
tornado potential <strong>and</strong> strength increase as boundary<br />
layer RH increases (LCL decreases) (Rasmussen <strong>and</strong><br />
Blanchard 1998, Markowski et al. 2000, Johns et al.<br />
2000).<br />
2
3.2 Hodographs<br />
Figure 2. Average relative humidity every 25 mb from 975<br />
mb through 200 mb.<br />
Figure 3. Mean hodograph plots (m s -1 ).<br />
Figure 4. Box <strong>and</strong> whisker plot of 0-1 km shear (vector<br />
difference) in m s -1 . Lower <strong>and</strong> upper values denote 10 th <strong>and</strong><br />
90 th percentiles, respectively. Boxes represent the 25 th<br />
through 75 th percentile values.<br />
A plot of composite hodographs reveals distinct<br />
differences between the <strong>derecho</strong> categories (Fig. 3).<br />
It is readily apparent that SF events occur in stronger<br />
flow <strong>and</strong> shear than the hybrid <strong>and</strong> WF cases, with a<br />
much longer hodograph plot. This is consistent with<br />
the shear magnitude findings from ED01. The WF<br />
<strong>and</strong> hybrid hodograph plots are similar in structure<br />
below 4 km; however, the hybrid cases are<br />
associated with stronger winds throughout the<br />
hodograph on average. In addition, the WF <strong>derecho</strong>s<br />
indicate a strong northwest flow signal with near<br />
uniform, northwesterly flow in the midtroposhere (i.e.<br />
northwesterly 3-6 km winds around 10 m s -1 ), which is<br />
consistent with Johns <strong>and</strong> Hirt (1987). The uniform<br />
flow in the mid-troposphere for the WF events<br />
suggests cell motions might be nearly identical to the<br />
preferred gust front motion on average. This<br />
maximizes both the inflow of high values of theta-e air<br />
<strong>and</strong> the time that convective elements maintain<br />
convergence along the leading edge of the cold pool<br />
(Weisman <strong>and</strong> Klemp 1986).<br />
Figure 3 also indicates that the significantly<br />
tornadic <strong>supercell</strong> hodographs are much stronger on<br />
average than any other category, as would be<br />
expected. The SF <strong>derecho</strong>s <strong>and</strong> tornadic <strong>supercell</strong>s<br />
occur in similar wind fields, with strong shear in the<br />
lowest 1 km (fig. 4) <strong>and</strong> pronounced turning in the<br />
lowest 3 km on average. Though the mean<br />
hodographs suggest significantly tornadic <strong>supercell</strong>s<br />
occur in stronger wind environments than SF<br />
<strong>derecho</strong>s, further examination (not shown) indicates<br />
that the mean SF <strong>derecho</strong> hodograph falls well within<br />
the middle 50 percent of all significantly tornadic<br />
<strong>supercell</strong>s in our dataset (<strong>and</strong> vice-versa). This<br />
suggests that hodographs of significantly tornadic<br />
<strong>supercell</strong>s <strong>and</strong> SF <strong>derecho</strong>s can be very similar, <strong>and</strong><br />
makes distinguishing between the two events quite<br />
problematic.<br />
3.3 <strong>Storm</strong>-relative winds<br />
When storm-relative winds are examined (Fig. 5),<br />
it is apparent that the <strong>derecho</strong>s yield the strongest<br />
inflow in the lowest 1 km. In addition, WF events<br />
develop <strong>and</strong> persist in environments with deep stormrelative<br />
inflow (front-to-rear flow) from the surface<br />
through 8-9 km. In contrast, the <strong>supercell</strong> dataset<br />
reveals pronounced rear-to-front flow above 2-3 km,<br />
especially the significantly tornadic events. This is<br />
markedly evident above 4 km, where only the<br />
<strong>supercell</strong>s indicate rear-to-front storm-relative flow<br />
increasing through 10 km. These results are<br />
consistent with studies that found the distribution of<br />
hydrometers <strong>and</strong> precipitation is largely due to the<br />
mid- <strong>and</strong> upper-level wind fields relative to storms<br />
(Brooks et al. 1994, Thompson 1999, Rasmussen <strong>and</strong><br />
Straka 1998, Parker <strong>and</strong> Johnson 2000).<br />
3
Neither 0-3 km SRH, BRN-shear, or EHI are<br />
clear in distinguishing between weakly <strong>and</strong><br />
significantly tornadic <strong>supercell</strong>s. 0-1 km shear (Fig. 4)<br />
clearly is the most useful in this regard; 10 m s -1 of 0-1<br />
km shear separates the significantly tornadic<br />
<strong>supercell</strong>s from all but 25% of the non- <strong>and</strong> weakly<br />
tornadic <strong>supercell</strong>s.<br />
To complicate matters further, the SF <strong>derecho</strong><br />
events occur in comparable values of 0-1 km shear,<br />
0-3 km SRH <strong>and</strong> BRN-shear with the significantly<br />
tornadic <strong>supercell</strong>s. However, EHI appears to have<br />
merit in distinguishing between environments<br />
favorable for significant tornadoes <strong>and</strong> SF <strong>derecho</strong>s.<br />
Figure 5. Mean storm-relative winds (m s -1 ) every 500 m<br />
from the surface through 10 km. Each sounding was<br />
normalized to set the origin equal to the storm motion; every<br />
point to the left of the y-axis represents relative inflow.<br />
Figure 6. Same as figure 4, except for 0-3 km storm-relative<br />
helicity.<br />
Figure 7. Same as figure 4, except for Energy helicity index.<br />
3.4 Computed parameters<br />
Both 0-3 km SRH (Fig. 6) <strong>and</strong> BRN-shear (not<br />
shown), have some merit in differentiating between<br />
the different <strong>supercell</strong> categories, especially between<br />
non-tornadic <strong>and</strong> significantly tornadic events.<br />
Though EHI (Fig. 7) appears to be best at<br />
distinguishing the tornado threat, with values in<br />
excess of 2.5 encompassing 75% of the tornado<br />
cases, <strong>and</strong> only 25% of the non-tornadic <strong>supercell</strong>s.<br />
4. DISCUSSION<br />
These results indicate <strong>proximity</strong> <strong>soundings</strong> can<br />
be useful in distinguishing the risk of tornadoes,<br />
<strong>and</strong>/or <strong>derecho</strong> formation, if convective mode can be<br />
correctly anticipated!<br />
The large-scale organization of convection<br />
appears to be strongly associated to the distribution of<br />
hydrometeors relative to the recurring updrafts. <strong>Storm</strong><br />
relative winds above 4 km are noticeably different<br />
between <strong>derecho</strong>s <strong>and</strong> discrete <strong>supercell</strong>s; rear-tofront<br />
flow progressively increases above this layer<br />
with discrete <strong>supercell</strong>s. This suggests distribution of<br />
stratiform precipitation to the rear of the leading line of<br />
convection is paramount in <strong>derecho</strong> maintenance<br />
(especially in the absence of fast moving <strong>and</strong> strong<br />
large scale ascent). In contrast, advection of<br />
hydrometeors at the mid <strong>and</strong> upper levels must occur<br />
downwind from the updrafts in discrete <strong>supercell</strong>s.<br />
When discrete convection is anticipated, EHI<br />
<strong>and</strong>, to a lesser degree 0-3 km SRH, appear most<br />
useful in delineating between non-tornadic <strong>and</strong><br />
tornadic <strong>supercell</strong>s. Once this is evident, 0-1 km<br />
shear, boundary layer RH (LCL height) <strong>and</strong> storm<br />
relative wind magnitude seem to have the most merit<br />
in distinguishing significant tornadoes from weaker<br />
ones. In fact, boundary layer relative humidity clearly<br />
distinguishes significantly tornadic <strong>supercell</strong>s from<br />
any other category investigated here.<br />
Though these results suggest several parameters<br />
can be used to distinguish between the different<br />
<strong>supercell</strong> (<strong>derecho</strong>) categories, differentiating<br />
between the two distinct convective modes is still<br />
unclear. This is especially true along <strong>and</strong> ahead of an<br />
approaching cold front <strong>and</strong> a progressive upper-level<br />
trough; conditions defined here as “strongly forced”.<br />
SF <strong>derecho</strong> events clearly develop <strong>and</strong> persist within<br />
similar thermodynamic <strong>and</strong> kinematic environments<br />
with discrete tornadic <strong>supercell</strong>s, which makes<br />
singling out the specific severe weather threat difficult.<br />
It appears that complexities, such as how the storms<br />
are initiated or how storms move relative to surface<br />
fronts, can dictate whether convection will develop<br />
<strong>and</strong> persevere as discrete or linear convection.<br />
5. REFERENCES<br />
Available upon request.<br />
4

![NSWW_ROC_Overview.ppt [Read-Only] - Storm Prediction Center ...](https://img.yumpu.com/26478320/1/190x146/nsww-roc-overviewppt-read-only-storm-prediction-center-.jpg?quality=85)


![NEW_PRODUCTS_imy.ppt [Read-Only] - Storm Prediction Center ...](https://img.yumpu.com/26478296/1/190x146/new-products-imyppt-read-only-storm-prediction-center-.jpg?quality=85)