Lab 1 TNK106: Software Introduction Part I - ArcMAP
Lab 1 TNK106: Software Introduction Part I - ArcMAP
Lab 1 TNK106: Software Introduction Part I - ArcMAP

Create successful ePaper yourself
Turn your PDF publications into a flip-book with our unique Google optimized e-Paper software.
<strong>TNK106</strong> – <strong>Lab</strong>1 instructions 2012-08-28<br />
<strong>Lab</strong> 1 <strong>TNK106</strong>: <strong>Software</strong> <strong>Introduction</strong> <strong>Part</strong> I - <strong>ArcMAP</strong><br />
The ArcMap introduction is not mandatory, it can be skipped if you feel comfortable using a GIS<br />
software. Support files for the lab are available in the study directory: S:\TN\K\<strong>TNK106</strong>.<br />
Task 0: Before the lab session starts, do <strong>Part</strong> I on your own. Also make sure you can run the program<br />
<strong>Lab</strong>Test.java without errors using Eclipse.<br />
Step<br />
1<br />
Step<br />
2<br />
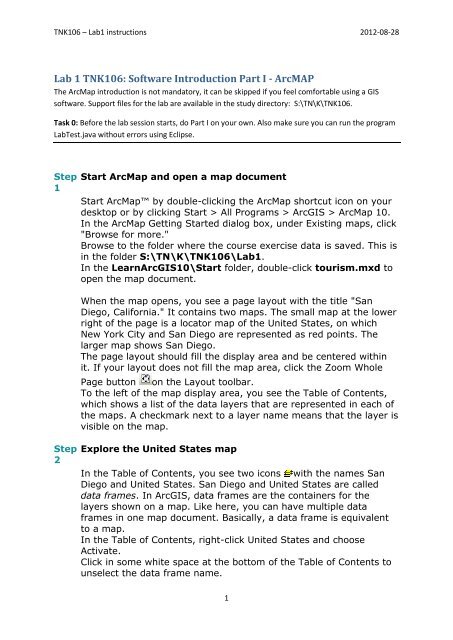
Start ArcMap and open a map document<br />
Start ArcMap by double-clicking the ArcMap shortcut icon on your<br />
desktop or by clicking Start > All Programs > ArcGIS > ArcMap 10.<br />
In the ArcMap Getting Started dialog box, under Existing maps, click<br />
"Browse for more."<br />
Browse to the folder where the course exercise data is saved. This is<br />
in the folder S:\TN\K\<strong>TNK106</strong>\<strong>Lab</strong>1.<br />
In the LearnArcGIS10\Start folder, double-click tourism.mxd to<br />
open the map document.<br />
When the map opens, you see a page layout with the title "San<br />
Diego, California." It contains two maps. The small map at the lower<br />
right of the page is a locator map of the United States, on which<br />
New York City and San Diego are represented as red points. The<br />
larger map shows San Diego.<br />
The page layout should fill the display area and be centered within<br />
it. If your layout does not fill the map area, click the Zoom Whole<br />
Page button on the Layout toolbar.<br />
To the left of the map display area, you see the Table of Contents,<br />
which shows a list of the data layers that are represented in each of<br />
the maps. A checkmark next to a layer name means that the layer is<br />
visible on the map.<br />
Explore the United States map<br />
In the Table of Contents, you see two icons with the names San<br />
Diego and United States. San Diego and United States are called<br />
data frames. In ArcGIS, data frames are the containers for the<br />
layers shown on a map. Like here, you can have multiple data<br />
frames in one map document. Basically, a data frame is equivalent<br />
to a map.<br />
In the Table of Contents, right-click United States and choose<br />
Activate.<br />
Click in some white space at the bottom of the Table of Contents to<br />
unselect the data frame name.<br />
1
<strong>TNK106</strong> – <strong>Lab</strong>1 instructions 2012-08-28<br />
The United States data frame now is active. Its name displays in<br />
bold. In the map display area, the small United States map is<br />
surrounded by a gray dashed line.<br />
The active data frame is the one you are working with. You can work<br />
with only one data frame at a time.<br />
In the Table of Contents, uncheck the box next to the States layer.<br />
The states have disappeared from the map. In ArcMap, you turn<br />
layers on and off by checking and unchecking them in the Table of<br />
Contents.<br />
Turn the States layer back on.<br />
Click the minus sign in front of the United States data frame to<br />
collapse it as shown below.<br />
Step<br />
3<br />
Now you will turn your attention to the San Diego data frame. After<br />
all, you have a trip to plan.<br />
Zoom in to San Diego<br />
In the Table of Contents, right-click San Diego and choose Activate.<br />
To see more details of the San Diego area, you will zoom in.<br />
On the Tools toolbar, click the Zoom In tool .<br />
Click in the center of the San Diego map and draw a box.<br />
When you zoom in, the map's scale changes. The scale is shown in a<br />
box above the map display area.<br />
Don't worry if the number in your scale box is different from the one<br />
shown above. The scale depends on how large your ArcMap window<br />
is, large your map display area is, and how large a box you drew<br />
when you zoomed in.<br />
The scale is the ratio between the size of features on the map and<br />
2
<strong>TNK106</strong> – <strong>Lab</strong>1 instructions 2012-08-28<br />
Step<br />
4<br />
the size of those same features on the earth. If the scale is<br />
1:59,886, that means that one unit on the map is equal to 59,886<br />
units in the real world—or, that features in the real world are 59,886<br />
times larger than they are on the map.<br />
The Zoom In tool should still be active. Click in the center of the<br />
map.<br />
Notice that the scale number decreased. You will learn more about<br />
scale later in this topic, but so far, you've learned that you can<br />
change the scale in a GIS map by using the Zoom In tool two<br />
different ways—by drawing a box and by clicking the map.<br />
You can also change the scale by typing directly into the scale box.<br />
Click in the scale box and delete the current number. Type 50000<br />
(50 thousand) and press Enter.<br />
The map display changes. Now you can see more streets on the<br />
map.<br />
The Surface Streets layer is set to display only when the number in<br />
the scale box is 50,000 or less. Because the surface streets are now<br />
visible in the map, their symbol is no longer grayed-out in the Table<br />
of Contents.<br />
On the Tools toolbar, click the Pan tool . Click in the center of the<br />
map and drag to the right, then release the mouse button.<br />
Did you notice that the scale did not change? Panning a map is a<br />
way to see different areas of the map at the same scale.<br />
To get the San Diego map back to what it looked like before you<br />
started zooming and panning, you will use a bookmark. A bookmark<br />
is like a snapshot—it's an area of the map saved at a particular<br />
scale.<br />
From the Bookmarks menu, choose San Diego City.<br />
San Diego is a large city, but you know you want to stay near the<br />
ocean. In the next steps, you will explore the downtown area of San<br />
Diego.<br />
Switch to Data view and label hotels<br />
In ArcMap, there are two views for working with your data: Layout<br />
view and Data view. So far, you have been exploring the map in<br />
Layout view. In order to explore the data in more detail, you will<br />
switch to data view.<br />
Click the View menu and choose Data View.<br />
If your Layout toolbar is floating on the map, dock it to the ArcMap<br />
window or close it by clicking the X in the upper right corner of the<br />
toolbar.<br />
Note the following visible differences between Data view and Layout<br />
view:<br />
<br />
The map layout elements (north arrow, legend, and scale bar)<br />
3
<strong>TNK106</strong> – <strong>Lab</strong>1 instructions 2012-08-28<br />
<br />
do not display.<br />
In Data view, you see only one map at a time (the active data<br />
frame).<br />
In the Table of Contents, check the box next to Hotels to see the<br />
hotels display on the map.<br />
Click the Zoom In tool and zoom in on the cluster of hotels along the<br />
coast, the area where you're interested in staying.<br />
On the Tools toolbar, click the Select Elements tool . Pause your<br />
mouse pointer over the hotel symbols just south of the Interstate 5<br />
freeway.<br />
The hotel name displays as a MapTip when you hover over its<br />
symbol.<br />
To see the names of all the hotels at once, you will turn on their<br />
labels.<br />
Right-click Hotels and choose <strong>Lab</strong>el Features.<br />
Step<br />
5<br />
Find a hotel and get information about it<br />
You participate in the Marriott Rewards program and are happy to<br />
see a couple of Marriott hotels on the map. Hopefully, you can find<br />
one that's located near the trolley line and the ocean. It would be a<br />
huge cost savings if you could walk or take the trolley instead of<br />
renting a car.<br />
With a GIS map, you can quickly locate all the hotels you're<br />
interested in. You will use the Find tool to locate all the Marriott<br />
hotels.<br />
On the Tools toolbar, click the Find tool .<br />
The Find dialog box opens.<br />
Click the Features tab, if necessary.<br />
In the Find text box, type Marriott.<br />
Click the drop-down arrow next to the "In" text box and choose<br />
Hotels.<br />
Click Find.<br />
The Find tool returns five results at the bottom of the dialog box.<br />
Expand the dialog box if necessary to see all the find results.<br />
Move the Find dialog box so you can see both it and the map at the<br />
same time.<br />
At the bottom of the Find dialog box, right-click Marriott Suites Hotel<br />
and choose Flash.<br />
If you were watching, you should have seen the hotel flash on the<br />
map.<br />
4
<strong>TNK106</strong> – <strong>Lab</strong>1 instructions 2012-08-28<br />
If you didn't see the hotel flash on the map, try it again.<br />
Now flash the location of Marriott Hotel and Marina.<br />
It's close to the water and the trolley line, making it easily accessible<br />
to attractions you want to visit while in San Diego.<br />
You'd like to get the telephone number for the Marriott Hotel and<br />
Marina to call for a reservation.<br />
In the Find dialog box, right-click Marriott Hotel and Marina and<br />
choose Identify.<br />
The Identify window opens. It may open on top of your Table of<br />
Contents. You can move it if you like.<br />
The Identify window shows a list of information about the Marriott<br />
Hotel and Marina, including its phone number. (You may need to<br />
scroll down to see the phone number.)<br />
If necessary, enlarge the Identify window so you can see all the<br />
information about the hotel.<br />
Features on a GIS map are linked to a database that contains<br />
information about the features.<br />
What is the hotel's telephone number?<br />
Now that you have the phone number for the hotel, you can call to<br />
make reservations.<br />
Close the Identify window.<br />
In the Find dialog box, right-click Marriott Hotel and Marina and<br />
choose Select.<br />
Close the Find dialog box.<br />
Now you see a cyan dot over the symbol for Marriott Hotel and<br />
Marina, which indicates that the feature is selected. You will keep<br />
this hotel selected so you can easily see where it is in comparison to<br />
the trolley line and major attractions.<br />
In the Table of Contents, right-click Hotels and click <strong>Lab</strong>el Features<br />
to turn off the labels.<br />
Step<br />
6<br />
Get information about major attractions<br />
Next, you'll explore some of the attractions you'd like to visit while<br />
you're in San Diego. First, you'll explore attractions close to the<br />
hotel.<br />
In the Table of Contents, check Major Attractions.<br />
Right-click Major Attractions and choose Open Attribute Table.<br />
This table contains information about each major attraction that's<br />
displayed on the map. It's another way to view information about<br />
the features in a layer. In the previous step, you accessed<br />
5
<strong>TNK106</strong> – <strong>Lab</strong>1 instructions 2012-08-28<br />
information about a feature using the Identify window.<br />
In this table, each major attraction has its own record, or row, in the<br />
table. Each column represents a type of information, or attribute, for<br />
each record.<br />
Scroll to the right of the table and examine the fields.<br />
Right-click the NAME field name and choose Sort Ascending.<br />
Now all the major attractions are sorted alphabetically. This makes it<br />
easier to find a particular attraction.<br />
Scroll down until you find Seaport Village, a coastal retail area with<br />
shops and restaurants.<br />
Click the gray box to the left of the record.<br />
The Seaport Village record is selected in the table. In a GIS map,<br />
you can select features on the map or in the table.<br />
What is the address of Seaport Village?<br />
Close the table.<br />
On the map, the symbol for Seaport Village is selected, just west of<br />
the selected hotel.<br />
Seaport Village and the Marriott Hotel and Marina are located on the<br />
same road. In the next step, you will measure the distance between<br />
the two locations to see if they're within walking distance of each<br />
other.<br />
Step<br />
7<br />
Measure distance between features<br />
To make it easier to measure the distance between the hotel and<br />
Seaport Village, first you will zoom in closer.<br />
Click the Zoom In tool and draw a box around the two selected<br />
features.<br />
Click the Measure tool .<br />
6
<strong>TNK106</strong> – <strong>Lab</strong>1 instructions 2012-08-28<br />
The Measure window opens.<br />
Notice that your mouse pointer changes to a ruler when you move it<br />
over the map.<br />
At the top left in the Measure window, the Measure Line button<br />
should be selected (depressed).<br />
You will set the distance units to miles.<br />
To the right of the Measure Line button, click the Choose Units down<br />
arrow , point to Distance, and click Miles.<br />
If necessary, move the Measure window out of the way.<br />
Click the symbol for the Marriott Hotel and Marina, then move your<br />
mouse pointer west, over to the symbol for Seaport Village.<br />
Tip: If you don't remember which symbol is the hotel, pause<br />
your mouse pointer over the symbol to see its MapTip.<br />
Double-click the Seaport Village symbol to measure the distance.<br />
Look at the Measure window.<br />
The distance you measured displays there.<br />
Approximately how far is it from the Marriott Hotel and Marina to<br />
Seaport Village?<br />
Notice that the trolley line is also close to the hotel.<br />
Use the Measure tool to measure the distance from the Marriott<br />
Hotel and Marina to the nearest trolley stop. If necessary, use the<br />
Pan tool<br />
to see the nearest trolley stop.<br />
Approximately how far is the nearest trolley stop?<br />
Close the Measure window.<br />
Next, you'll see if you can take the trolley to the San Diego Zoo and<br />
Qualcomm Stadium, two other attractions you want to visit.<br />
Step<br />
8<br />
Find attractions and determine the best method of<br />
transportation<br />
You're a big sports fan. You have already done some research and<br />
found out there's a game you want to see while you're in San Diego.<br />
The game is at Qualcomm Stadium. In this step, you will see if the<br />
trolley will take you there.<br />
On the Tools toolbar, click the Clear Selected Features<br />
From the Bookmarks menu, choose San Diego City.<br />
In the Table of Contents, uncheck Major Roads.<br />
Right-click Major Attractions and choose <strong>Lab</strong>el Features.<br />
button.<br />
7
<strong>TNK106</strong> – <strong>Lab</strong>1 instructions 2012-08-28<br />
Step<br />
9<br />
Look for Qualcomm Stadium on the map.<br />
It looks like there's a trolley stop very close to the stadium.<br />
Click the Identify tool .<br />
On the map, click the trolley stop closest to Qualcomm Stadium.<br />
The Identify window opens. At the top of the Identify window,<br />
choose Trolley Stops in the drop-down list.<br />
Click the trolley stop closest to Qualcomm Stadium again.<br />
What is the name of the trolley stop?<br />
Close the Identify window.<br />
Now look for the San Diego Zoo on the map.<br />
You have always heard how beautiful the San Diego Zoo is and<br />
would really like to visit it on your trip. In the next step, you'll get<br />
more information about the zoo.<br />
Use a hyperlink for the San Diego Zoo Web site<br />
A GIS map can include hyperlinks to documents, images, and even<br />
Web sites. On this map, there's a hyperlink to the San Diego Zoo<br />
Web site. The Web site likely has information about getting to the<br />
zoo.<br />
Zoom in to the San Diego Zoo symbol. Uncheck the Surface Streets<br />
layer in the Table of Contents so you can better see the zoo symbol.<br />
Click the Hyperlink tool , then click the San Diego Zoo symbol<br />
(Tip: Click the blue dot over the symbol).<br />
The Web site for the San Diego Zoo should open in a new browser<br />
window or tab.<br />
If the Web site doesn't open, try clicking the blue dot again. You<br />
need to click in the center of the dot.<br />
In the Plan Your Trip section, look at the Directions information.<br />
Would you take the trolley from the Marriott Hotel and Marina to<br />
visit the zoo?<br />
8
<strong>TNK106</strong> – <strong>Lab</strong>1 instructions 2012-08-28<br />
Step<br />
10<br />
Close the browser tab or window with the San Diego Zoo Web site.<br />
Exit ArcMap<br />
From the File menu, choose Exit. Click No when asked if you want to<br />
save changes.<br />
This exercise introduced you to some of the features of a GIS map.<br />
You were able to quickly plan a fun-filled trip to San Diego. You<br />
found a hotel, saw where the attractions you want to visit are<br />
located, and determined how you'll get around. All that's left now is<br />
to pack your bags!<br />
While exploring this GIS map, you were able to view features at<br />
different scales and access information about them. Now that you've<br />
gotten your feet wet with GIS, you're ready to learn more about<br />
what's going on behind the scenes.<br />
9
<strong>TNK106</strong> – <strong>Lab</strong>1 instructions 2012-08-28<br />
<strong>Lab</strong> 1 <strong>TNK106</strong>: <strong>Software</strong> introduction – <strong>Part</strong> II<br />
In this part you will access geographical data from the open source geodatabase PostGIS, which is an<br />
extension to the commonly used open source relation database PostgreSQL. You will access the<br />
database in three different ways, first using <strong>ArcMAP</strong> to visualize and do minor analysis on the data<br />
set, and then using Java to try a more generic way of viewing and manipulating data in a spatial<br />
database. Finally, you will use Matlab to do some calculations and visualize the output.<br />
If you are not familiar with databases and SQL, have a look at this tutorial and play with the SQL<br />
queries:<br />
http://sqlzoo.net/0.htm and http://sqlzoo.net/select_group_by.htm<br />
If you are new to java and/or Eclipse, have a look at this tutorial:<br />
http://www.vogella.de/articles/Eclipse/article.html<br />
´<br />
Before you can access the database you need to create a SSH tunnel to the server which hosts the<br />
database, you can do that using the SSH client Putty. Putty creates a secure connection to a certain<br />
port on the remote machine, and you need to specify that port, which is 5432 as default for all<br />
PostgreSQL databases.<br />
Start putty and configure the following parameters (if Putty is not available on your computer, simply<br />
search for “putty download” in e.g. Google):<br />
Host: kalle@millennium.itn.liu.se<br />
You also need to specify the tunnel by putting in the following information:<br />
Source port: 5432<br />
Destination: localhost:5432<br />
10
<strong>TNK106</strong> – <strong>Lab</strong>1 instructions 2012-08-28<br />
Now click the Add button. When you click open, a command shell will show up and you are prompted<br />
for password, which is: Pad#901i<br />
The SSH tunnel is now set-up; let’s start by accessing the database using ArcMap.<br />
Access through ArcMap<br />
Start <strong>ArcMAP</strong> and click on File/Add data/Add query layer in the top menu, by clicking on<br />
Connections…/New... the following dialogue will show up, fill in the following values and click OK:<br />
DBMS Client: postgresql<br />
Username: postgres<br />
Data Source: localhost<br />
Database: millennium<br />
Password: Pad#901i<br />
When you click on OK you will see all the tables that are available in the database. Double click on<br />
the table millennium.public.tnk106, give the query a name, Validate the query and then press Finish.<br />
The layer contains measurements on a cellular network together with location information and is<br />
collected using an Android application that uses the GPS to determine the position. The data that is<br />
recorded is the current base station in use (cellid) and the current signal strength (snr). This data can<br />
for example be used for calculating a position based on cell phone measurements without using the<br />
GPS.<br />
11
<strong>TNK106</strong> – <strong>Lab</strong>1 instructions 2012-08-28<br />
Task 1: When the layer is loaded, explore the data and visualize both signal strength (snr) and cell id<br />
(cellid) on the map simultaneously.<br />
Hints:<br />
For visualization you can right-click on the layer and click on properties/symbology.<br />
For the map you can use File/Add data/Add basemap/Bing Maps Road.<br />
Task 2: Use ArcMap to calculate the average signal strength of all cellid:s that are available in the<br />
data set.<br />
Hint:<br />
Open the attribute table and select data by attributes. For a certain selection, right click on the<br />
column you want to show statistics for.<br />
If you want to build a location-based service or want to access the data without buying a license for<br />
ArcMap (which is really expensive), you can also access the data directly using for example Java and<br />
SQL.<br />
Access through Java<br />
Start a new project in Eclipse and copy the file <strong>Lab</strong>Test.java into the project folder named src. Before<br />
you can run the file you need to make sure Eclipse finds the drivers for the database connection, do<br />
that by adding the PostGIS and PostGRE jar files available on S: to the Eclipse project. Right-click on<br />
the project and choose Build path/Add external archives. Run the test file and observe what happens.<br />
Task 3: Modify the program to do the same as you did in ArcMap, i.e. calculate the average snr for<br />
the different cellid:s. Also find the maximum longitude and latitude from the_geom column and<br />
verify your result by examining the point in <strong>ArcMAP</strong>.<br />
Access through Matlab<br />
If you want to do mathematical calculations and plotting of a dataset and are not writing a<br />
commercial service, Matlab is a very powerful and commonly used tool. Start Matlab and run the<br />
script image_plot_from_db.m to collect longitude and latitude of the same data set as before into<br />
Matlab.<br />
Task 4: Modify the script to visualize the points on the picture lab1_map.jpg. To do this you need to<br />
transform longitude and latitude to a local coordinate system for the picture. Verify your result by<br />
comparing the points with the points in <strong>ArcMAP</strong>. A Matlab function (transform_koord.m) with<br />
information about picture size and map size in longitude and latitude, is also available in S:.<br />
12