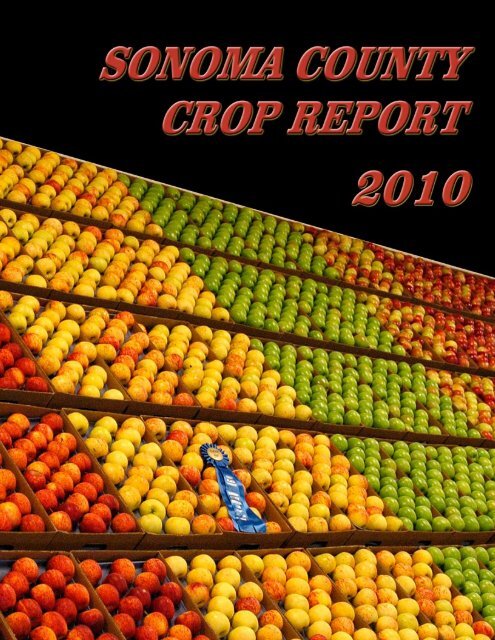
Sonoma County Crop Report 2010
Sonoma County Crop Report 2010
Sonoma County Crop Report 2010

You also want an ePaper? Increase the reach of your titles
YUMPU automatically turns print PDFs into web optimized ePapers that Google loves.
This Year’s <strong>Crop</strong> <strong>Report</strong> is Dedicated to<br />
Shirley Lee Walker<br />
1930 - <strong>2010</strong><br />
On Tuesday, November 16, <strong>2010</strong>, <strong>Sonoma</strong> <strong>County</strong> lost a pillar of our agricultural community. Shirley Walker was the<br />
matriarch of the Walker Apple family in Graton and spent her adult life growing, selling and promoting apples and<br />
the apple industry in <strong>Sonoma</strong> <strong>County</strong>. Shirley Lee Walker was born in Sebastopol and attended Analy high school.<br />
After graduating from high school she attended the Santa Rosa Junior College where she received an Associates<br />
degree in Business. Shirley married Lee Walker in 1953 after which they took residence at the family’s farm on Upp<br />
Road where they lived and raised a family. A town girl since birth, Shirley embraced the country lifestyle and devoted<br />
her life to the apple business. Shirley had deep roots in <strong>Sonoma</strong> <strong>County</strong>. Her mother’s family members were some<br />
of the first to plant apple orchards in Rincon Valley in 1852 and her father’s family settled in Healdsburg in 1850.<br />
Shirley was very active in the community and gave extensive amounts of free time to philanthropic endeavors.<br />
When she wasn’t on the farm, she spent her time doing work for her Philanthropic Educational Organization. This<br />
organization is devoted to the education and advancement of women through scholarships, grants, awards, and<br />
networking in an effort to help women achieve their highest aspirations. In addition to this organization Shirley<br />
played a key role in “The Apple Corps”, a group of apple farmers’ wives and friends who promoted the local<br />
apple industry. The Apple Corps built community ties through their marketing, publicity, and fund-raising efforts.<br />
Promotions included a cookbook comprised entirely of apple recipes. They would get together and make apple pies<br />
and breads, which they gave to produce buyers at all of the chain stores and local markets. Though Shirley was<br />
devoted to her community her real devotion was to her family. Her three children gave her immense pride and she<br />
would do anything to help them succeed. Her presence in the community and her work ethic are an inspiration to<br />
us all and she will be reverently missed by the apple industry and the agricultural community in <strong>Sonoma</strong> <strong>County</strong>.
OFFICE OF THE AGRICULTURAL COMMISSIONER<br />
Agricultural Commissioner 133 Aviation Blvdevard, Suite 110<br />
Sealer of Weights and Measures Santa Rosa, CA 95403-1077<br />
www.sonoma-county.org/agcomm (707) 565-2371 Fax (707) 565-3850<br />
Karen Ross, Secretary May 2011<br />
California Department of Food and Agriculture<br />
and<br />
The Honorable Board of Supervisors of <strong>Sonoma</strong> <strong>County</strong>:<br />
Efren Carrillo – Fifth District, Chairman<br />
Valerie Brown – First District<br />
David Rabbitt – Second District<br />
Shirlee Zane – Third District, Vice Chair<br />
Mike McGuire – Fourth District<br />
It is my privilege to present the <strong>2010</strong> <strong>Sonoma</strong> <strong>County</strong> <strong>Crop</strong> <strong>Report</strong> as prepared pursuant to Section<br />
2279 of the California Food and Agricultural Code. The reported value for <strong>2010</strong> was $593,821,700,<br />
which is a decrease of 8.6% from the 2009 value of $649,517,900. This report reflects the gross<br />
production values; not the net income or costs of production and marketing.<br />
The decrease in gross value for <strong>2010</strong> is attributed primarily to a 15% decrease in fruit and nut crop<br />
production value, of which wine grape production value fell by almost $70 million. Winegrape prices<br />
were down slightly from 2009 and many growers experienced some crop loss due to extremely hot<br />
weather late in the season combined with an unusually cool spring and summer. The apiary industry<br />
showed a decrease of 11.5% from 2009 due primarily to cool spring weather and fewer hives in<br />
production. Livestock and poultry saw a 10% increase with a value of approximately $57 million.<br />
Livestock and poultry products, such as eggs and milk, rebounded slightly from $91 million in 2009, to<br />
$98.6 million in <strong>2010</strong>. This is due to increases in the unit price for market and manufacturing milk. It<br />
was a good year for apple production as growers experienced better yields per acre representing a<br />
nearly 13% increase in the value of these crops. Vegetable production values increased very slightly by<br />
1.8% while nursery products decreased by almost 3% due to a slower economy.<br />
This year’s report focuses on our county’s apple industry, an indelible and nostalgic reminder of our<br />
county’s agricultural identity and heritage. We would like to celebrate our apple producers who continue<br />
to farm and market a diverse array of varieties with exceptional flavor. Our county’s food producers and<br />
consumers have expressed a very strong commitment to preserving the <strong>Sonoma</strong> <strong>County</strong> apple industry<br />
and ensuring its long term sustainability. One facet of this commitment is an increase in the<br />
infrastructure necessary to improve the production and sale of local food, and there is nothing more<br />
local than our apples.<br />
While this <strong>Crop</strong> <strong>Report</strong> features our apple industry, I would like to extend our gratitude and appreciation<br />
for all of our agricultural practitioners whose participation makes the production of this report possible.<br />
<strong>Sonoma</strong> <strong>County</strong> is a beautiful place and we are blessed to live in a community where people value the<br />
local bounty of this agrarian landscape; a place where people value and work towards the concept of<br />
sustainability. A special thanks goes out to the outstanding staff of the Agricultural Commissioner’s<br />
Office, particularly Andrew Smith, Dagny Thomas and Cree Morgan, for their efforts in the development<br />
of this report.<br />
Respectfully submitted,<br />
Lisa Correia<br />
Chief Deputy Agricultural Commissioner
Table of Contents<br />
Shirley Lee Walker Dedication...........................................................Inside Front Cover<br />
Letter To The Board of Supervisors ................................................................................1<br />
Apple Heritage in <strong>Sonoma</strong> <strong>County</strong> ..................................................................................3<br />
Million Dollar <strong>Crop</strong>s and Nursery Production..........................................................4<br />
Fruit and Nut Summary and World Winegrape Acreage ...........................................5<br />
Winegrape Production (Reds)............................................................................................6<br />
Winegrape Production (Whites)......................................................................................7<br />
Apple Production, Apiary Products, and Vegetables .................................................8<br />
Livestock and Poultry Summary......................................................................................9<br />
Field <strong>Crop</strong>s ...........................................................................................................................10<br />
Recapitulation ...................................................................................................................11<br />
Sustainable Agriculture <strong>Report</strong>...................................................................................12<br />
Vineyard and Orchard Site Development....................................................................13<br />
Commodity Exports...........................................................................................................14<br />
Timber Harvest, Equestrian Inventory, and Commercial Fish Landings .............15<br />
Agriculture Division Summary.......................................................................................16<br />
Weights and Measures Division Summary....................................................................17<br />
Winning Ag Day Essay.........................................................................................................18<br />
Department Staff................................................................................................................19<br />
2<br />
Cover photo: Warren A. Smith
Apple Heritage - <strong>Sonoma</strong> <strong>County</strong><br />
“...groundbreaking contributions to the nation’s flavor landscape.” — Luther Burbank<br />
Over the course of our county’s history many agricultural crops have come and gone from our landscape,<br />
usually disappearing in response to changes in consumer preference, market pressure, and lower production<br />
costs elsewhere. One crop has been here since early times and still remains as an indelible and nostalgic<br />
reminder of our county’s agricultural identity and heritage; the apple. At one time apple orchards blanketed<br />
the county, encompassing more than 13,000 acres. Today apple orchards in <strong>Sonoma</strong> <strong>County</strong> occupy less<br />
than 3,000 acres. This decline is due primarily to outside market competition. Though the going is tough,<br />
the future of our beloved apple industry is ripe with opportunity for sustaining the industry, which we have<br />
celebrated through tradition for over 100 years.<br />
Luther Burbank was right in thinking that this is the chosen spot, at least as far as nature is concerned. However, water is a critical<br />
resource and this has been a primary hurdle in our apple industry’s ability to remain competitive relative to other apple-growing<br />
regions in the United States and abroad. <strong>Sonoma</strong> <strong>County</strong> apple orchards thrived in the early 1900s as immigrants moved to the<br />
county to start farms and raise families. At that time it was possible to earn a good living and raise a family on just 10 acres of<br />
apples. There was no shortage of markets as well. San Francisco was a booming city and apples left our county by the boat load<br />
via the Petaluma River.<br />
Historically <strong>Sonoma</strong> <strong>County</strong> had an advantage over other apple growing regions due to our earlier season. Our county’s apples<br />
were always the first on the market and as such garnered the best prices. Additionally, we had a tremendous infrastructure of<br />
packing sheds, dryers, and canneries with access to the large markets of the burgeoning San Francisco Bay Area. At one time<br />
Sebastopol had 25 warehouses packing fresh apples along the railroad tracks. Gravensteins are the most famous apples grown<br />
here in <strong>Sonoma</strong> <strong>County</strong> and are at the heart of our apple growing heritage. These apples were always the first to ripen and left<br />
<strong>Sonoma</strong> <strong>County</strong> on trains bound for the East Coast. They were also the primary source of apple sauce and dried apples used to<br />
feed US troops during World War II.<br />
Irrigation water in agriculture translates into higher yields and better prices as can be exemplified by the irrigated orchard systems<br />
in the central valley of California and the apple growing regions of Washington State where yields reach and exceed 30-40 tons<br />
per acre. By comparison, dry farmed apple orchards here in <strong>Sonoma</strong> <strong>County</strong> struggle to reach yields of 20 tons per acre with<br />
the average being closer to 12 tons per acre. Irrigation water increases profit margins by reducing the cost of production. These<br />
irrigated apple growing regions produce semi-dwarf trees, sometimes trellised, which are easier to prune, thin, and harvest. These<br />
orchards are planted to very high densities with 900-1200 trees per acre and provide a rapid return on investment by coming into<br />
full production much earlier. The culture of these orchard systems allows for the production of new varieties with better uniformity<br />
in color and size. Depending on the variety grown one can expect returns to be in the range of $500-$1,000 per ton of fruit. Here<br />
in <strong>Sonoma</strong> <strong>County</strong>, most of our apples are sold for processing and growers receive $60-$250 per ton. While our apple industry<br />
may not be able to compete with irrigated apple growing regions when it comes to price, we produce a superior product when it<br />
comes to flavor, diversity, locality, as well as a smaller ecological footprint in the production and transportation to markets here in<br />
<strong>Sonoma</strong> <strong>County</strong>.<br />
The Gravenstein apple has given <strong>Sonoma</strong> <strong>County</strong> world recognition, which we celebrate year after year. Its heritage is our heritage<br />
when it comes to apple production. Its sweet, tart flavor and crisp, juicy texture lend itself to a fresh eater, a sauce apple, a juicer<br />
and it has long been used in pies when freshly harvested. The Slow Food Foundation selected the Gravenstein apple as a heritage<br />
variety for its outstanding quality and taste in addition to its relative rarity of production. <strong>Sonoma</strong> <strong>County</strong> also produces a plethora<br />
of antique varieties that are available at local fruit stands and farms throughout the county during summer and fall. The dry<br />
farming and deficit irrigation production practices that helped build our apple industry in the early 1900s through the 60s created<br />
apples with more intense and distinct flavors. Just as the concept of appellations is applied to the production of wine grapes, this<br />
concept is also applicable to the production of other fruits. The climate and soils of <strong>Sonoma</strong> <strong>County</strong> are excellent for producing<br />
apples. Our foggy mornings give us great air moisture and our cool summer days allow for some natural russeting which builds<br />
flavors in these “real” apples, setting them apart from the stored, controlled atmosphere, perfect looking imported fruit we have<br />
become accustomed to throughout the Winter and Spring months of the year. Agri-tourism has most recently focused on the wine<br />
industry yet historically it was all about the apples. U-pick operations on farms, packing shed visits, farm tours and apple festivals<br />
were common destinations for visitors to the county. Though these types of tours have been essentially replaced by wine tours,<br />
this is a very obvious next step in securing the future of our apple industry. There is incredible potential here in this county for<br />
the pairing of wine tours with apple packer and farm tours. Our county’s food producers and consumers have expressed a very<br />
strong commitment to preserving the <strong>Sonoma</strong> <strong>County</strong> food system and ensuring its sustainability into the foreseeable future. One<br />
facet of this commitment is an increase in the infrastructure necessary to improve the production and sale of local food, and there<br />
is nothing more local than our apples.<br />
3
Million Dollar <strong>Crop</strong>s and Nursery Production<br />
Million Dollar <strong>Crop</strong>s<br />
1 Winegrapes ~ All 390,448,300<br />
2 Market Milk 77,679,100<br />
3 Miscellaneous Poultry 43,293,300<br />
4 Misc. Livestock and Poultry Products 20,799,800<br />
5 Cattle and Calves 11,649,200<br />
6 Nursery ~ Ornamentals 10,853,100<br />
7 Vegetables 8,212,200<br />
8 Misc. Nursery Products 4,856,400<br />
9 Nursery ~ Bedding Plants 4,184,000<br />
10 Apples ~Late Varieties 4,169,300<br />
11 Nursery ~ Cut Flowers 2,792,100<br />
12 Sheep and Lambs 2,518,300<br />
13 Apples ~ Gravenstein 1,692,300<br />
14 Oat Silage 1,517,200<br />
15 Oat Hay 1,025,000<br />
Nursery Production<br />
Product Year Quantity Unit Total<br />
Ornamentals<br />
<strong>2010</strong> 1,198,169 plant $ 10,853,100<br />
2009 1,220,147 plant $ 10,214,900<br />
Bedding Plants<br />
<strong>2010</strong> 263,005 flat $ 4,184,000<br />
2009 258,693 flat $ 4,697,000<br />
Christmas Trees<br />
<strong>2010</strong> 6,919 each $ 297,700<br />
2009 7,953 each $ 334,500<br />
Cut Flowers<br />
<strong>2010</strong> $ 2,792,100<br />
2009 $ 2,360,000<br />
Miscellaneous <strong>2010</strong> $ 4,856,400<br />
(a)<br />
Products<br />
2009 $ 6,037,800<br />
TOTAL VALUE<br />
<strong>2010</strong><br />
$ 22,983,300<br />
2009<br />
$ 23,644,200<br />
(a) includes grapevines, deciduous fruit and nut trees, liners, bulbs, forest seedlings, house plants, orchids, herbaceous<br />
perennials, dry flowers, turf, and wreaths<br />
4
Fruit and Nut Summary and World Winegrape Acreage<br />
Fruit and Nut Summary<br />
Bearing Tons/ Total<br />
<strong>Crop</strong> Year Acres Acre Tons $/Ton Dollar Value Total<br />
Apples (all) <strong>2010</strong> 2,616 10.04 26,254 $ 223 $ 5,861,600<br />
2009 2,862 8.19 23,436 $ 218 $ 5,117,800<br />
Fresh <strong>2010</strong> $ 1,243,400<br />
2009 $ 1,162,700<br />
Processed (a) <strong>2010</strong> $ 4,618,300<br />
2009 $ 3,955,100<br />
Grapes (wine) <strong>2010</strong> 56,522 3.39 191,876 $2,034 $ 390,448,300<br />
2009 56,306 3.78 212,675 $2,167 $ 460,771,200<br />
Olives <strong>2010</strong> 465 $ 176,100<br />
2009 388 $ 161,200<br />
Miscellaneous (b) <strong>2010</strong> $ 542,700<br />
2009 $ 519,700<br />
TOTAL VALUE <strong>2010</strong> $ 397,028,700<br />
2009 $ 466,569,900<br />
(a) includes canned, juice, cider, and vinegar<br />
(b) includes bush-berries, kiwi, black walnuts, plums, all pears, strawberries, figs, chestnuts, prunes, etc.<br />
* Revised from 2009<br />
World WineGrape Acreage<br />
Country<br />
Total Acreage % Change<br />
2006 2008<br />
SPAIN 2,900,000 2,750,000 -5.17%<br />
FRANCE 2,179,000 2,017,000 -7.43%<br />
ITALY 2,063,000 1,989,000 -3.59%<br />
TURKEY 1,410,000 1,450,000 2.84%<br />
*<br />
*<br />
<strong>2010</strong><br />
Fruit and Nut<br />
Acreage Summary<br />
<strong>Crop</strong><br />
Bearing<br />
Non-<br />
Bearing Total<br />
Apples 2,616 0 2,616<br />
Grapes (wine) 56,522 3,137 59,659<br />
Olives 465 102 567<br />
Pears 55 0 55<br />
Plums (incl. Prunes) 39 0 39<br />
Walnuts 79 0 79<br />
Miscellaneous 710 0 710<br />
TOTAL ACREAGE 60,486 3,239 63,725<br />
CHINA 1,211,000 1,360,000 12.30%<br />
UNITED STATES 934,000 939,000 0.54%<br />
IRAN 745,000 870,000 16.78%<br />
ARGENTINA 543,000 565,000 4.05%<br />
PORTUGAL 608,000 543,000 -10.69%<br />
ROMANIA 580,000 482,000 -16.90%<br />
CHILE 479,000 480,000 0.21%<br />
AUSTRALIA 400,000 427,000 6.75%<br />
MOLDOVA 368,000 354,000 -3.80%<br />
SOUTH AFRICA 331,000 297,000 -10.27%<br />
UZBEKISTAN 255,000 292,000 14.51%<br />
ALL OTHER COUNTRIES 4,577,000 4,609,000 0.70%<br />
TOTAL ACREAGE 19,583,000 19,424,000 -0.81%<br />
Source: www.wineinstitute.org<br />
5
Winegrape Production<br />
Acreage<br />
Production<br />
Red Varieties Year Bearing Non-Bearing Total Tons $/Ton Total Value<br />
Cabernet Franc<br />
<strong>2010</strong> 653.9 14.3 668.2 1,436.3 $ 2,166.55 3,111,900<br />
2009 657.9 48.8 706.7 1,935.6 $ 2,358.82 $ 4,565,800<br />
Cabernet Sauvignon<br />
<strong>2010</strong> 11,549.0 468.3 12,017.3 37,933.3 $ 2,083.96 $ 79,051,500<br />
2009 11,658.5 730.5 12,389.0 41,140.6 $ 2,280.67 $ 93,828,200<br />
Carignane<br />
<strong>2010</strong> 180.3 1.0 181.3 270.4 $ 1,949.11 $ 527,100<br />
2009 182.0 2.8 184.8 464.2 $ 1,919.43 $ 891,000<br />
Malbec<br />
<strong>2010</strong> 310.4 69.1 379.5 770.5 $ 2,430.83 $ 1,873,000<br />
2009 281.8 82.1 363.9 877.9 $ 2,491.49 $ 2,187,300<br />
Merlot<br />
<strong>2010</strong> 5,248.0 55.6 5,303.6 17,440.9 $ 1,297.08 $ 22,622,300<br />
2009 5,736.9 109.1 5,846.0 16,506.5 $ 1,507.00 $ 24,875,300<br />
Meunier<br />
<strong>2010</strong> 108.5 15.0 123.5 406.5 $ 2,928.56 $ 1,190,500<br />
2009 109.0 15.0 124.0 398.5 $ 3,056.21 $ 1,217,900<br />
Petite Sirah<br />
<strong>2010</strong> 522.6 37.7 560.3 2,085.9 $ 2,377.94 $ 4,960,200<br />
2009 503.9 85.9 589.8 2,300.6 $ 2,480.13 $ 5,705,800<br />
Petite Verdot<br />
<strong>2010</strong> 202.9 9.2 212.1 695.5 $ 2,476.49 $ 1,722,400<br />
2009 189.0 34.8 223.8 918.9 $ 2,778.24 $ 2,553,000<br />
Pinot Noir<br />
<strong>2010</strong> 11,456.0 675.5 12,131.5 29,791.3 $ 2,825.12 $ 84,164,000<br />
2009 10,746.2 1,988.5 12,734.7 31,961.2 $ 3,043.08 $ 97,260,500<br />
Sangiovese<br />
<strong>2010</strong> 259.7 48.4 308.1 983.6 $ 2,244.09 $ 2,207,300<br />
2009 298.6 11.1 309.7 1,210.6 $ 2,231.17 $ 2,701,100<br />
Syrah-Shiraz<br />
<strong>2010</strong> 1,791.6 51.7 1,843.3 4,587.6 $ 2,030.22 $ 9,313,900<br />
2009 1,816.6 168.5 1,985.1 5,563.3 $ 2,314.65 $ 12,877,100<br />
Zinfandel<br />
<strong>2010</strong> 5,055.0 112.5 5,167.5 10,864.4 $ 2,260.27 $ 24,556,500<br />
2009 5,229.7 171.5 5,401.2 15,637.4 $ 2,462.39 $ 38,505,400<br />
Other Reds<br />
TOTAL REDS<br />
(a) weighted average<br />
<strong>2010</strong> 466.6 48.0 514.6 1,214.8 $ 9,416,500<br />
2009 527.2 187.6 714.8 1,839.7 $ 6,180,000<br />
<strong>2010</strong> 37,804.4 1,606.3 39,410.7 108,481.0 (a) $ 2,255.85 (a) $ 244,717,100<br />
2009 37,937.2 3,636.2 41,573.4 120,717.0 (a) $ 2,430.05 (a) $ 293,348,400<br />
total tons by variety 2000-<strong>2010</strong><br />
70,000<br />
60,000<br />
50,000<br />
40,000<br />
30,000<br />
20,000<br />
10,000<br />
0<br />
6
Winegrape Production<br />
Acreage<br />
Production<br />
White Varieties Year Bearing Non-Bearing Total Tons $/Ton Total Value<br />
Chardonnay<br />
French Colombard<br />
Gewürztraminer<br />
Muscat Blanc<br />
Pinot Blanc<br />
Pinot Gris<br />
Sauvignon Blanc<br />
Semillon<br />
Viognier<br />
White Riesling<br />
Other Whites<br />
TOTAL WHITES<br />
TOTAL WINE<br />
GRAPES<br />
(a) weighted average<br />
<strong>2010</strong> 15,060.0 1,263.0 16,323.0 66,157.4 $ 1,845.52 $ 122,094,900<br />
2009 14,659.8 2,414.9 17,074.7 73,100.6 $ 1,978.18 $ 144,606,200<br />
<strong>2010</strong> 35.6 0.0 35.6 125.1 $ 523.06 $ 65,500<br />
2009 44.6 0.0 44.6 246.0 $ 524.44 $ 129,100<br />
<strong>2010</strong> 138.1 5.1 143.2 274.6 $ 1,712.28 $ 470,200<br />
2009 122.0 26.2 148.2 385.6 $ 1,655.21 $ 638,300<br />
<strong>2010</strong> 18.0 12.4 30.4 67.1 $ 1,941.23 $ 130,000<br />
2009 19.4 0.0 19.4 66.7 $ 2,025.48 $ 135,100<br />
<strong>2010</strong> 46.4 0.0 46.4 237.6 $ 1,767.14 $ 419,900<br />
2009 68.6 0.0 68.6 258.3 $ 1,741.17 $ 449,800<br />
<strong>2010</strong> 445.5 22.5 468.0 1,715.8 $ 1,695.78 $ 2,909,700<br />
2009 453.6 80.5 534.1 1,921.8 $ 1,761.45 $ 3,385,200<br />
<strong>2010</strong> 2,341.0 183.2 2,524.2 13,103.3 $ 1,317.40 $ 17,262,300<br />
2009 2,248.6 333.9 2,582.5 13,841.2 $ 1,470.89 $ 20,358,900<br />
<strong>2010</strong> 133.4 0.0 133.4 440.6 $ 2,575.91 $ 1,135,000<br />
2009 143.6 6.4 150.0 430.6 $ 2,357.61 $ 1,015,200<br />
<strong>2010</strong> 231.5 2.6 234.1 623.4 $ 2,313.36 $ 1,442,200<br />
2009 261.9 31.2 293.1 720.1 $ 2,324.89 $ 1,674,200<br />
<strong>2010</strong> 29.9 2.9 32.8 148.3 $ 2,425.53 $ 359,800<br />
2009 30.0 0.0 30.0 238.6 $ 2,288.54 $ 546,100<br />
<strong>2010</strong> 238.4 39.4 277.8 606.8 $ 4,799,400<br />
2009 316.8 71.8 388.6 748.1 $ 2,062,800<br />
<strong>2010</strong> 18,717.8 1,531.1 20,428.8 83,500.0 (a) $ 1,811.72 (a) $ 151,278,800<br />
2009 18,368.8 2,964.9 21,333.7 91,957.6 (a) $ 1,903.06 (a) $ 175,000,900<br />
<strong>2010</strong> 56,522.2 3,137.3 59,659.5 191,981.0 $ 2,033.79 $ 390,448,300<br />
2009 56,306.0 6,601.1 62,907.2 212,674.6 $ 2,186.61 $ 460,771,200<br />
* Revised from 2009 price per ton by variety 2000-<strong>2010</strong><br />
$3,200<br />
$3,000<br />
*<br />
$2,800<br />
$2,600<br />
$2,400<br />
$2,200<br />
$2,000<br />
$1,800<br />
$1,600<br />
$1,400<br />
$1,200<br />
7
Apple Production, Apiary Products, and Vegetables<br />
Apple Production<br />
Bearing Tons/ Total<br />
<strong>Crop</strong> Year Acres Acre Tons $/Ton Dollar Value Total<br />
Gravenstein<br />
Fresh<br />
Processed (a)<br />
Late Apples<br />
TOTAL<br />
Fresh<br />
Processed (a)<br />
(a) includes canned, juice, cider, and vinegar<br />
<strong>2010</strong> 763 7.11 5,428 $ 312 $ 1,692,300<br />
2009 833 4.46 3,717 $ 358 $ 1,329,800<br />
<strong>2010</strong> 355 $1,667 $ 592,608<br />
2009 353 $1,602 $ 565,600<br />
<strong>2010</strong> 5,073 $ 217 $ 1,099,690<br />
2009 3,364 $ 227 $ 764,100<br />
<strong>2010</strong> 1,853 11.35 20,826 $ 200 $ 4,169,300<br />
2009 2,029 9.72 19,720 $ 192 $ 3,788,000<br />
<strong>2010</strong> 368 $1,769 $ 650,755<br />
2009 318 $1,880 $ 597,100<br />
<strong>2010</strong> 20,458 $ 172 $ 3,518,521<br />
2009 19,402 $ 164 $ 3,190,900<br />
<strong>2010</strong> 2,616 10.04 26,254 $ 223 $ 5,861,600<br />
2009 2,862 8.19 23,437 $ 218 $ 5,117,800<br />
Apiary Products<br />
<strong>2010</strong> $334,500<br />
TOTAL VALUE*<br />
2009 $378,100<br />
*includes honey, wax and pollination<br />
8<br />
<strong>Crop</strong><br />
Vegetables<br />
Year<br />
Harvested<br />
Acreage Dollar Value<br />
Miscellaneous <strong>2010</strong> 710 $ 8,212,200<br />
Vegetables (a) 2009 701 $ 8,066,600<br />
(a) includes melons, mushrooms, potatoes, pumpkins, sprouts,<br />
squash, tomatoes, lettuces, etc.
Livestock and Poultry Summary<br />
Number Live<br />
Item Year of Head Weight Unit $/Unit Total<br />
Cattle/Calves<br />
Sheep/Lambs<br />
Hogs<br />
Miscellaneous<br />
Poultry (a)<br />
TOTAL VALUE<br />
Livestock and Poultry<br />
<strong>2010</strong> 29,714 154,110 cwt. $ 75.59 $ 11,649,200<br />
2009 27,163 143,370 cwt. $ 64.80 $ 9,290,400<br />
<strong>2010</strong> 23,508 26,312 cwt. $ 95.71 $ 2,518,300<br />
2009 20,971 23,472 cwt. $ 78.89 $ 1,851,700<br />
<strong>2010</strong> 1,040 2,483 cwt. $ 54.24 $ 134,700<br />
2009 1,156 2,761 cwt. $ 42.30 $ 116,800<br />
<strong>2010</strong> $ 43,293,300<br />
2009 $ 41,034,600<br />
<strong>2010</strong> $ 57,595,500<br />
2009 $ 52,293,500<br />
(a) includes chicks, ducks, turkey poults, fryers, roasters, turkeys, etc.<br />
Livestock and Poultry Products<br />
Item Year Production Unit $/Unit Total<br />
Milk, Market<br />
<strong>2010</strong> 4, 932,001 cwt. $ 15.75 $ 77,679,100<br />
2009 5,199,404 cwt. $ 12.41 $ 64,524,700<br />
Milk, Manufacturing<br />
<strong>2010</strong> 6,458 cwt. $ 13.78 $ 89,000<br />
2009 7,906 cwt. $ 12.14 $ 96,000<br />
Wool<br />
<strong>2010</strong> 80,147 lb. $ 0.56 $ 44,900<br />
2009 76,330 lb. $ 0.53 $ 40,500<br />
Miscellaneous <strong>2010</strong> $ 20,799,800<br />
Products (a)<br />
2009 $ 26,398,700<br />
TOTAL VALUE<br />
<strong>2010</strong> $ 98,612,800<br />
2009 $ 91,059,900<br />
(a) includes market duck eggs, turkey hatching eggs, chicken eggs for consumption, egg by-products, and goat milk<br />
Inventory<br />
Item<br />
Number<br />
Cattle and Calves (all) *<br />
66,935<br />
Milk Cows and heifers (2 years and over) 29,923<br />
Beef Cows and heifers (2 years and over) 8,935<br />
Sheep and Lambs (all) 17,939<br />
Hogs 1,040<br />
Laying Hens and Pullets 1,832,145<br />
Goats 1,797<br />
*Number of head as of January 1, <strong>2010</strong> - furnished by California Agricultural Statistics Service<br />
9
Field <strong>Crop</strong>s<br />
Ton/ Total<br />
<strong>Crop</strong> Year Acres Acre Tons Unit Per Unit Total<br />
Hay, Oat<br />
Hay, Volunteer<br />
Green Chop<br />
Oats, Grain<br />
Silage, Corn<br />
Silage, Oat<br />
Straw<br />
Miscellaneous<br />
Pasture,<br />
Irrigated<br />
Rangeland<br />
TOTAL VALUE<br />
(a)<br />
(a)<br />
(a)<br />
(b)<br />
(c)<br />
(c)<br />
<strong>2010</strong> 5,247 2.2 11,538 ton $ 88.84 $ 1,025,000<br />
2009 4,090 2.2 8,912 ton $ 125.85 $ 1,153,400<br />
<strong>2010</strong> 1,543 5.0 7,715 ton $ 17.90 $ 138,100<br />
2009 1,190 1.1 1,353 ton $ 70.11 $ 107,100<br />
<strong>2010</strong> 2,053 11.0 22,620 ton $ 19.11 $ 432,200<br />
2009 1,223 9.0 10,986 ton $ 18.20 $ 192,200<br />
<strong>2010</strong> 874 1.4 1,212 ton $ 177.56 $ 215,200<br />
2009 442 1.1 477 ton $ 356.80 $ 128,100<br />
<strong>2010</strong> 195 29.7 5,787 ton $ 28.63 $ 165,700<br />
2009 250 28.4 7,095 ton $ 24.50 $ 203,700<br />
<strong>2010</strong> 6,164 10.7 65,765 ton $ 23.07 $ 1,517,200<br />
2009 5,219 10.2 53,008 ton $ 20.81 $ 1,209,800<br />
<strong>2010</strong> $ 48,100<br />
2009 $ 34,500<br />
<strong>2010</strong> $ 766,500<br />
2009 $ 365,900<br />
<strong>2010</strong> 6,858 acre $ 100.00 $ 685,800<br />
2009 6,927 acre $ 100.00 $ 692,800<br />
<strong>2010</strong> 338,401 acre $ 12.00 $ 4,060,900<br />
2009 341,819 acre $ 10.00 $ 3,418,200<br />
<strong>2010</strong> $ 9,054,700<br />
2009 $ 7,505,700<br />
(a) much of the green chop and silage is not sold, but used on the farm - value is determined by its feed equivalent<br />
(b) includes alfalfa, barley, safflower, wheat, rye, vetch, Sudan, etc.<br />
(c) potential grazing value - estimated from Assessor's rolls<br />
12<br />
FIELD CROP VALUES 1990 - <strong>2010</strong><br />
10<br />
Millions of Dollars<br />
8<br />
6<br />
4<br />
2<br />
0<br />
10
Recapitulation<br />
2009 <strong>2010</strong> % Change<br />
Apiary Products $ 378,100 $ 334,500 -11.5%<br />
Field <strong>Crop</strong>s $ 7,505,700 $ 9,054,700 20.6%<br />
Vegetable <strong>Crop</strong>s $ 8,066,600 $ 8,212,200 1.8%<br />
Nursery Products $ 23,644,200 $ 22,983,300 -2.8%<br />
Livestock and Poultry $ 52,293,500 $ 57,595,500 10.1%<br />
Livestock and Poultry<br />
Products $ 91,059,900 $ 98,612,800 8.3%<br />
Fruit and Nut <strong>Crop</strong>s $ 466,569,900 * $ 397,028,700 -15.0%<br />
TOTAL VALUE $ 649,517,900 * $ 593,821,700 -8.6%<br />
* Revised from 2009<br />
<strong>Sonoma</strong> <strong>County</strong> Agriculture <strong>2010</strong><br />
(percentage of total production value)<br />
Vegetable <strong>Crop</strong>s (1.4%)<br />
Field <strong>Crop</strong>s (1.6%)<br />
Nursery Products (3.9%)<br />
Fruit and Nut <strong>Crop</strong>s (66.8%)<br />
Livestock and Poultry (9.7%)<br />
Livestock and Poultry Products<br />
(16.6%)<br />
11
Sustainable Agriculture <strong>Report</strong><br />
Commodity<br />
<strong>2010</strong> Organic Farming Statistics<br />
Registrants Sites Acres<br />
Eggs 8 N/A N/A<br />
Fruits/Nuts 83 477 2,326<br />
Grain/Forage 30 107 2,493<br />
Meat 5 18 N/A<br />
Milk 24 92 N/A<br />
Nurseries 34 48 10<br />
Pasture/Rangeland 20 50 10,461<br />
Vegetables 57 80 266<br />
Winegrapes 30 71 776<br />
Handlers 25 N/A N/A<br />
Total Individual Registrants 188 693 16,332<br />
Noxious Weed Eradication<br />
Biologists identified two sources of invasive and aggressive weeds in <strong>Sonoma</strong> <strong>County</strong>. These two weeds are A-rated Rush Skeletonweed<br />
(Chondirlla juncea), and Iberian Starthistle (Centaurea iberica). Over the course of the year, several visits were made to five different sites<br />
to perform mechanical removal and chemical treatment in order to halt the growth and prevent the spread of these problematic and very<br />
adaptive weed species.<br />
Pest Detection Trapping<br />
There were 6,244 traps placed for the detection of exotic insect pests including Mediterranean, Oriental, Olive, and Melon Fruit Flies,<br />
Gypsy Moth, Japanese Beetle, Khapra Beetle, European Grapevine Moth (EGVM) and Light Brown Apple Moth (LBAM). Traps were<br />
serviced 72,538 times. There were 150 traps placed in nurseries for the Glassy-winged Sharpshooter (GWSS), which were serviced<br />
1,872 times. In addition, 475 traps were placed in urban areas for GWSS, which were serviced 5,006 times. EGVM and LBAM were<br />
both detected through trapping in <strong>2010</strong>, which included 59 confirmed finds of EGVM in <strong>Sonoma</strong> <strong>County</strong>.<br />
Pest Exclusion<br />
A total of 2,227 premise visits occurred in <strong>2010</strong>, and during these visits we inspected 33,328 shipments of plant material. Inspections<br />
occurred at the express carriers, nurseries, the post office, feed mills, as well as vineyards and other farms. Forty-five rejections of plant<br />
material were made, which is an increase of 12.5% compared with 2009 rejections. Rejected plant material was either destroyed or<br />
reconditioned and released. To prevent the spread of GWSS into <strong>Sonoma</strong> <strong>County</strong>, department personnel inspected 1,705 shipments of<br />
nursery material arriving from infested counties in California. There were no shipments of plant material rejected for the prescence of<br />
viable GWSS egg masses in <strong>Sonoma</strong> <strong>County</strong> in <strong>2010</strong>. There were no GWSS adults intercepted in <strong>2010</strong>. To assist our industry, we issued<br />
115 federal phytosanitary documents for international shipments and 861 state phytosanitary documents for shipments to other states.<br />
European Grapevine Moth<br />
Lobesia botrana<br />
California Red Scale<br />
Aonidiella aurantii<br />
Exotic Pest Species Intercepted IN <strong>2010</strong><br />
Light Brown Apple Moth<br />
Epiphyas postvittana<br />
Quack Grass<br />
Elytrigia repens<br />
Grass Cyst Nematode<br />
Heterodera mani<br />
Oblong Spurge<br />
Euphorbia oblongata<br />
Diaspidid scale<br />
Pseudaulacaspis Brimblecombei<br />
Purple Loosestrife<br />
Lythrum Salicaria<br />
Wooly Distaff Thistle<br />
Carthamnus lanatus<br />
12
Vineyard and Orchard Site development<br />
The <strong>Sonoma</strong> <strong>County</strong> Board of Supervisors adopted a comprehensive Grading, Drainage, and Vineyard and Orchard Site<br />
Development Ordinance in December of 2008, which integrated the Vineyard Erosion and Sediment Control Ordinance<br />
(VESCO) that was adopted in 2000. The purpose of the ordinance is to help prevent soil erosion, and protect water quality<br />
and other natural resources. In addition to vineyards, the new ordinance requires an erosion and sediment control plan be<br />
approved prior to planting or replanting orchards as well. The figures in the table below include projects for both vineyards<br />
and orchards.<br />
In collaboration with other agencies, organizations and individuals, our agriculture division developed a “Best Management<br />
Practices for Agricultural Erosion and Sediment Control”. This handbook provides guidelines necessary to control water<br />
quality impacts from accelerated soil erosion due to agricultural activities in <strong>Sonoma</strong> <strong>County</strong>. The handbook describes and<br />
shows basic practices effective at reducing erosion and sedimentation, and how to implement these practices.<br />
PROJECTS SUBMITTED*<br />
New Replants TOTAL<br />
Level I Level II Acreage Project Level I Level II Acreage Project Projects<br />
Year Projects Acreage Projects Acreage Total Total Projects Acreage Projects Acreage Total Total<br />
2005 32 281 23 514 795 55 79 870 2 60 930 81 136<br />
2006 49 544 13 151 695 62 78 785 6 47 832 84 146<br />
2007 45 419 21 115 534 66 100 1,001 4 22 1,023 104 170<br />
2008 61 1,157 27 272 1,429 88 97 1,110 4 22 1,132 101 189<br />
2009 24 150 20 377 527 44 57 1,046 5 88 1,134 62 106<br />
<strong>2010</strong> 10 82 13 75 157 23 51 783 0 0 783 51 74<br />
* Chart displays the number of projects submitted, not necessarily completed, since 2005.<br />
In <strong>2010</strong>, there were a total of three orchard projects, for a total of 5.84 acres<br />
250<br />
Total Projects Per Year<br />
Total Projects Per Year<br />
200<br />
150<br />
NEW<br />
REPLANT<br />
100<br />
50<br />
0<br />
2000 2001 2002 2003 2004 2005 2006 2007 2008 2009 <strong>2010</strong><br />
13
Commodity Exports<br />
Commodity Destinations<br />
Shipments<br />
No Shipments<br />
14<br />
Number of<br />
Certificates<br />
Canada 31<br />
Japan 17<br />
French Polynesia 12<br />
Spain 10<br />
Mexico 8<br />
Italy 7<br />
China 6<br />
France 4<br />
Chile 4<br />
Argentina 2<br />
Brazil 2<br />
Germany 2<br />
Ghana 2<br />
Taiwan 2<br />
Hungary 2<br />
Austria 1<br />
Belgium 1<br />
Singapore 1<br />
United Kingdom 1<br />
Destination<br />
Commodities Shipped<br />
Oak Pieces for Winemaking<br />
Bird Seed<br />
Corn<br />
Herbs/Spices<br />
Rose Plants<br />
Iris Rhizomes<br />
Vegetable Seed<br />
Ferns<br />
Grapevines<br />
Oak Wine Barrels<br />
Winegrapes<br />
In <strong>2010</strong>, the <strong>Sonoma</strong> <strong>County</strong> Agricultural Commissioner’s Office<br />
issued 115 Federal Phytosanitary Certificates for international<br />
shipments to 19 countries, and 861 State Phytosanitary Certificates<br />
for shipments within the United States. These certificates were issued<br />
by staff to assist the agricultural industry and allow certified plant<br />
materials to cross quarantine boundaries. Phytosanitary certificates<br />
document that materials to be shipped have been inspected and<br />
certified free from pests as required by the importing state/country.
Timber Harvest, Equestrian Inventory,<br />
and Commercial Fish Landings<br />
Timber Harvest *<br />
Year Production Unit Value (a)<br />
2009 1,228,000 board feet $ 512,219<br />
2008 11,835,000 board feet $ 6,806,279<br />
(a) value of the timber immediately before cutting<br />
*Most current data available<br />
Informational only. Source: http://www.boe.ca.gov/proptaxes/timbertax.htm<br />
<strong>Sonoma</strong> <strong>County</strong> Horse<br />
Operations - 2004*<br />
<strong>Sonoma</strong> <strong>County</strong><br />
Equestrian Inventory<br />
Horses Owned<br />
Year by Households<br />
1994 10,991<br />
1998 11,433<br />
2004 15,783<br />
Information only; most current data available. Sources: Economic Impact Studies for 1994,<br />
1998 and 2004 by <strong>Sonoma</strong> State University<br />
*Most current data available<br />
Commercial Fish Landings *<br />
Species Pounds Value<br />
Crab, Dungeness<br />
Salmon, Chinook<br />
Sole, all<br />
Rockfish, all<br />
Halibut, California<br />
Miscellaneous<br />
Sablefish<br />
Lingcod<br />
Tuna, Albacore<br />
Cabezon<br />
TOTAL<br />
2009 335,674 $ 945,289<br />
2008 1,044,861 $ 3,270,761<br />
2009 0 $ ---<br />
2008 0 $ ---<br />
2009 70,060 $ 60,801<br />
2008 193,151 $ 190,215<br />
2009 34,846 $ 54,723<br />
2008 38,388 $ 72,532<br />
2009 17,367 $ 67,435<br />
2008 1,310 $ 5,871<br />
2009 483,624 $ 324,771<br />
2008 78,134 $ 56,552<br />
2009 57,563 $ 128,321<br />
2008 10,849 $ 27,618<br />
2009 3,263 $ 4,578<br />
2008 6,316 $ 8,582<br />
2009 18,043 $ 18,489<br />
2008 2,100 $ 2,783<br />
2009 158 $ 936<br />
2008 54 $ 277<br />
2009 1,020,598 $ 1,605,343<br />
2008 1,375,163 $ 3,635,191<br />
*Most recent figures provided by California Department of Fish and Game.<br />
Source: http://www.dfg.ca.gov/marine/landings09.asp<br />
Informational only.<br />
15
Agriculture Division Summary<br />
In <strong>2010</strong> the Agriculture Division:<br />
• Implemented state and federal quarantine restrictions to combat the spread of the newly introduced and extremely destructive pest,<br />
the European Grapevine Moth (EGVM). Staff placed approximately 7,000 traps for early detection, issued nearly 900 quarantine<br />
compliance agreements, and provided outreach through meetings, mailings and web updates.<br />
• Worked collaboratively with growers and environmental resource agencies to develop the Frost Protection Ordinance, which requires<br />
vineyard and orchard frost water protection users in the Russian River Watershed to register with the Agricultural Commissioner’s<br />
Office. This annual registration will collect survey information on the nature of each frost system infrastructure and water diversions,<br />
the first phase of addressing the potential conflict of frost water use with salmonids.<br />
• Implemented an organic inspection program for all new uncertified organic operations aimed at determining compliance with the<br />
national and state organic rules.<br />
Did you know that in <strong>2010</strong> the Agriculture Division…<br />
• Inspected approximately 33,300 incoming shipments of plant material at nurseries and shipping terminals for exotic pests<br />
• Issued 202 Producer Certificates and 13 Farmers’ Market certificates<br />
• Registered 20 new organic producers<br />
• Inspected 5 million chicken eggs for defects (via representative sampling)<br />
• Issued 976 Phytosanitary certificates for the export of plant material out of <strong>Sonoma</strong> <strong>County</strong><br />
• Diverted more than 16,000 pounds of plastic containers from the landfill through the division’s two recycling events with<br />
approximately 113 growers participating<br />
• Inspected 32 shipments of household articles for the presence of Gypsy Moth, which includes thoroughly examining items such as<br />
BBQs, boats, cars, fire wood, recreational vehicles, patio furniture, and other articles originating from portions of the United States<br />
infested with Gypsy Moth (Lymantria dispar)<br />
• Investigated 35 suspected illnesses and complaints as part of the Pesticide Use Enforcement program<br />
• Issued 559 Operator Identification Numbers and Pesticide Use Permits<br />
• Surveyed more than 1,000 <strong>Sonoma</strong> <strong>County</strong> producers in preparation for the <strong>2010</strong> Agricultural <strong>Crop</strong> <strong>Report</strong><br />
16
Weights and Measures Division Summary<br />
The Division of Weights and Measures has been in existence in <strong>Sonoma</strong> <strong>County</strong> since 1916. It is a division within the Agricultural<br />
Commissioner’s Office and the Agricultural Commissioner also serves as the <strong>County</strong> Sealer. Weights and Measures works in partnership<br />
with the State Division of Measurement Standards to enforce Weights and Measures laws and regulations at the county level. Weights<br />
and Measures also enforces locally enacted county ordinances that fall under our jurisdiction.<br />
Traditionally, Weights and Measures Inspectors certify commercial weighing and measuring devices used in commerce. The term<br />
“commercial device” is defined by law as a device used to make a “… determination of the weight, measure, or count of any commodity<br />
or thing upon which determination of a charge for service is based.” <strong>Sonoma</strong> <strong>County</strong> consumers encounter commercial devices frequently<br />
in their daily lives. Scales are used to weigh produce at the local supermarket; fuel dispensers are used to meter and purchase fuel at the<br />
local gas station; and taxi meters measure the distance traveled for a ride across town.<br />
In 2006, the Weights and Measures Division began implementing the ‘Price Verification Program Ordinance’. This ordinance regulates<br />
local businesses that use a scanner system at the point of sale to register with their county Weights and Measures Division. These<br />
businesses must undergo routine price verification inspections. Point of sale scanner systems have greatly reduced the “waiting time”<br />
spent at the checkout register. At the same time, retailers have introduced more product sales, discounts, and conditions of sale (buy one<br />
get one for half price). This technology has increased the potential for pricing errors as hundreds of products go on-sale and come offsale<br />
on a daily and weekly basis. This ordinance protects consumers by assuring they are being charged the correct price for each item.<br />
Did you know that in <strong>2010</strong> the Weights and Measures Division...<br />
• Scanned over 19,601 items while performing 676 price verification inspections at local retailers<br />
• Inspected 3,834 fuel pumps at local gas stations<br />
• Inspected over 1,285 deli and supermarket scales used to weigh non-standards weight items<br />
• Responded to more than 120 consumer complaints ranging from incorrect charges at retail businesses to suspected contaminated<br />
fuel at local gas stations<br />
• Inspected over 116 taxi meters<br />
17
Winning Ag Day Essay<br />
Ag Days is a <strong>Sonoma</strong> <strong>County</strong> tradition. The <strong>Sonoma</strong> <strong>County</strong> Farm Bureau annually sponsors the two-day event, which is a<br />
celebration of <strong>Sonoma</strong> <strong>County</strong>’s Agricultural industry and the rich heritage that continues to define a way of life for <strong>Sonoma</strong><br />
<strong>County</strong> residents. Ag Days offer an opportunity for thousands of school children to learn more about farming and where<br />
their food comes from, allowing them to connect with the farms and ranches that blanket the county. An essay writing contest<br />
is one of many farm-themed contests held each year, which also include posters, murals, scarecrow-building, and farm<br />
photography. Following is the winning Ag Days Essay for 2011.<br />
Growing a Healthy Future<br />
By: Zoe Maddox, 5th Grade<br />
Pacific Christian Academy<br />
Growing a healthy future is what farmers do in <strong>Sonoma</strong> <strong>County</strong>. How? By growing<br />
healthful foods and keeping the environment clean and beautiful.<br />
Growing healthy crops and producing delicious, healthful foods is important. Healthy<br />
eating habits will help people have a healthy future. And who will help make sure we have<br />
healthful food? Farmers, of course. Farmers in <strong>Sonoma</strong> <strong>County</strong> love to grow and sell healthy<br />
foods!<br />
Farmers, whether they are organic or conventional, care for and about our environment.<br />
Some foods are organically grown with no pesticides or other chemicals. Other foods are<br />
grown using chemical sprays to keep pests away and fight disease. Why? Being “earth<br />
friendly” is a key to a healthy future.<br />
And who are helping us grow a healthy future? Our wonderful and helpful farmers of<br />
<strong>Sonoma</strong> <strong>County</strong>! Thanks!<br />
18
Department Staff<br />
VISION<br />
To ensure a thriving agricultural industry, a healthy community, economy and environment, for the people of <strong>Sonoma</strong> <strong>County</strong><br />
MISSION<br />
Deliver services that effectively promote and protect agriculture, the economy, community, environment,<br />
and health and safety of our citizens through education and the enforcement of laws and regulations, resulting in:<br />
• Sustainable Agriculture<br />
• Equity in the Marketplace<br />
AGRICULTURAL COMMISSIONER/SEALER OF WEIGHTS and MEASURES<br />
Agriculture Division Staff<br />
CHIEF DEPUTY AGRICULTURAL COMMISSIONER<br />
Lisa Correia<br />
AGRICULTURE AND VINEYARD CONSERVATION COORDINATOR<br />
Gail Davis ~ John Rainwater<br />
ADMINISTRATIVE ANALYST<br />
Natalie Brunamonte<br />
DEPARTMENT ANALYST<br />
Esther Martinez<br />
Weights and Measures Division Staff<br />
CHIEF DEPUTY SEALER<br />
Fernando Vasquez<br />
SENIOR STANDARDS SPECIALIST<br />
Michael Barrett<br />
STANDARDS SPECIALISTS<br />
Thomas LeClerc ~ Katy McCoy ~ Michael Milligan<br />
Greg Peters ~ Jeffrey Yparraguirre<br />
DEPUTY AGRICULTURAL COMMISSIONER<br />
Joseph Gray ~ Sue Ostrom ~ Alexis Ramey<br />
SENIOR AGRICULTURAL BIOLOGIST<br />
Dan Curtin ~ Priscilla Lane ~Paul Turano ~ Marilyn Vernon<br />
AGRICULTURAL BIOLOGIST<br />
Pete Albers ~ Gary Bjork ~ Gayle Carter ~ David Jagdeo<br />
AlexMcVicker ~ Cree J. Morgan ~ Jessica Scroggins ~ Andrew Smith<br />
WILDLIFE SPECIALIST<br />
Jeff Furlong<br />
ADMINISTRATIVE SUPPORT STAFF<br />
Mary Halasz ~ Naomi Lozinto ~ Carrie Muller<br />
Nina Reeser ~ Sue Taylor-Fellbaum ~ Dagny Thomas ~ Jenese Turnage<br />
SENIOR AGRICULTURAL PROGRAM ASSISTANT<br />
Maggie Furlong<br />
AGRICULTURAL PROGRAM ASSISTANTS<br />
Laura Barnthouse ~ Frank Bastoni ~ Kevin Brady ~ David Burtis<br />
Kris Catching ~ Kim Covington ~ Benny Friestadt ~ Andrew Griffin<br />
Jesus Hernandez ~ Travis Howard ~ Tina Hughes ~ Anne-Elise Krug<br />
John O’Keeffe ~ Prahlada Papper ~ Capella Parrish ~ Brian Ratlidge<br />
Laurie Richards ~ David Stuart ~ Jody Vent ~ Brittney Yolo<br />
19
NOTES