Port Nelson Annual Report 2012 (pdf)
Port Nelson Annual Report 2012 (pdf)
Port Nelson Annual Report 2012 (pdf)

Create successful ePaper yourself
Turn your PDF publications into a flip-book with our unique Google optimized e-Paper software.
notes to the accounts<br />
notes<br />
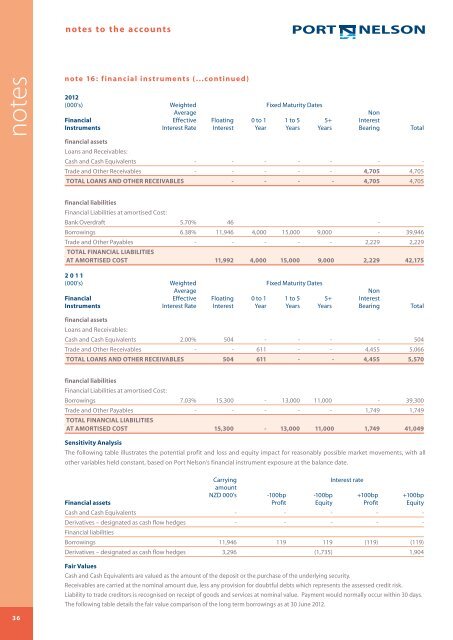
note 16: financial instruments (...continued)<br />
<strong>2012</strong><br />
(000’s) Weighted Fixed Maturity Dates<br />
Average<br />
Non<br />
Financial Effective Floating 0 to 1 1 to 5 5+ Interest<br />
Instruments Interest Rate Interest Year Years Years Bearing Total<br />
financial assets<br />
Loans and Receivables:<br />
Cash and Cash Equivalents - - - - - - -<br />
Trade and Other Receivables - - - - - 4,705 4,705<br />
Total Loans and other receivablEs - - - - 4,705 4,705<br />
financial liabilities<br />
Financial Liabilities at amortised Cost:<br />
Bank Overdraft 5.70% 46 -<br />
Borrowings 6.38% 11,946 4,000 15,000 9,000 - 39,946<br />
Trade and Other Payables - - - - - 2,229 2,229<br />
Total Financial liabilities<br />
at Amortised cost 11,992 4,000 15,000 9,000 2,229 42,175<br />
2011<br />
(000’s) Weighted Fixed Maturity Dates<br />
Average<br />
Non<br />
Financial Effective Floating 0 to 1 1 to 5 5+ Interest<br />
Instruments Interest Rate Interest Year Years Years Bearing Total<br />
financial assets<br />
Loans and Receivables:<br />
Cash and Cash Equivalents 2.00% 504 - - - - 504<br />
Trade and Other Receivables - - 611 - - 4,455 5,066<br />
Total Loans and other receivablEs 504 611 - - 4,455 5,570<br />
financial liabilities<br />
Financial Liabilities at amortised Cost:<br />
Borrowings 7.03% 15,300 - 13,000 11,000 - 39,300<br />
Trade and Other Payables - - - - - 1,749 1,749<br />
Total Financial liabilities<br />
at Amortised cost 15,300 - 13,000 11,000 1,749 41,049<br />
Sensitivity Analysis<br />
The following table illustrates the potential profit and loss and equity impact for reasonably possible market movements, with all<br />
other variables held constant, based on <strong>Port</strong> <strong>Nelson</strong>’s financial instrument exposure at the balance date.<br />
Carrying<br />
Interest rate<br />
amount<br />
NZD 000’s -100bp -100bp +100bp +100bp<br />
Financial assets Profit Equity Profit Equity<br />
Cash and Cash Equivalents - - - - -<br />
Derivatives – designated as cash flow hedges - - - - -<br />
Financial liabilities<br />
Borrowings 11,946 119 119 (119) (119)<br />
Derivatives – designated as cash flow hedges 3,296 (1,735) 1,904<br />
Fair Values<br />
Cash and Cash Equivalents are valued as the amount of the deposit or the purchase of the underlying security.<br />
Receivables are carried at the nominal amount due, less any provision for doubtful debts which represents the assessed credit risk.<br />
Liability to trade creditors is recognised on receipt of goods and services at nominal value. Payment would normally occur within 30 days.<br />
The following table details the fair value comparison of the long term borrowings as at 30 June <strong>2012</strong>.<br />
36