02 Market environment/ Business performance The market environment for stainless steel flat products has become more difficult lately due to various factors. This has impacted our business performance. ThyssenKrupp <strong>Stainless</strong> is therefore focused on working towards volume and structural improvements.
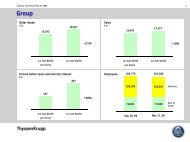
Market environment ThyssenKrupp sTainless aG Market environment At the beginning of the last year the worldwide demand for rust-, acid- and heat- resistant stainless steel flat products was stable. Finally the world economy as well as the price fluctuation in the commodity markets damped down demand and subsequently orders. According to preliminary estimates the global consumption slightly decreased in 2008. On the European market, demand was initially stable in 2008. After orders and deliveries dropped to a very low level in the prior year due to massive imports from Asia, high inventories at stock-holding distributors and sharp fluctuations in the price of the alloying element nickel, the situation improved perceptibly in the 4th calendar quarter 2007, only to deteriorate again significantly from the middle of the 2nd calendar quarter 2008. This was mainly due to the recovery in demand from distributors, gradually rebuilding the inventories they had run down due to the declining nickel price. European producers succeeded in raising base prices again through to the 2nd calendar quarter 2008. After that, however, the traditionally weak summer months and the clouding of the economic outlook resulted in a renewed sharp decline in base prices, and order intake decreased significantly. On average, third-country imports were lower than a year earlier, mainly due to a decrease in imports from Asia, particularly China, Taiwan and Korea. However, imports from these countries started to rise again continuously from the beginning of the 2nd quarter 2008, gaining momentum later as a result of the increasing underutilization of Chinese production capacities. MARKET FORECAST COLD-ROLLED STAINLESS FLAT PRODUCTS in 1,000 t 2005 2006 2007 2008* 2009* Western Europe 2,929 3,618 3,170 3,147 3,075 Eastern Europe 227 303 319 341 349 NAFTA 1,664 1,918 1,606 1,393 1,366 China 3,747 4,500 5,033 4,753 5,240 Rest of Asia 3,816 4,044 4,033 4,319 4,257 Rest of world 1,046 1,203 1,239 1,329 1,369 Total 13,430 15,586 15,399 15,282 15,655 Source: CRU December 2008, *estimate 17