CITY OF SANTA MONICA, CALIFORNIA Notes to Basic <strong>Financial</strong> Statements, Continued For the fiscal year ended June 30, 2009 A summary <strong>of</strong> long-term bonds and loans outstanding at year end is as follows: As Forathe result year <strong>of</strong> Council ended June Resolution 30, 2001, 9675, the the<strong>City</strong>’s following annual changes pension Final have costbeen and subjected its actual Date <strong>of</strong> issue Original issue maturity date Interest rate Balance at June 30, 2009 Governmental activities: Revenue bonds (1): Parking Authority 2002 May 1, 2002 10,480,000 July 1, 2016 3.50-4.50% $ 7,520,000 Public Finance Authority 1999 Sept 15, 1999 13,200,000 July 1, 2021 4.25-5.50% 9,940,000 Public Finance Authority 2002 Jan 1, 2002 17,310,000 July 1, 2021 2.00-4.75% 13,125,000 Public Finance Authority 2004 Dec 1, 2004 38,930,000 July 1, 2034 3.35-5.00% 37,295,000 Subtotal revenue bonds - governmental activities 67,880,000 Tax allocation bonds (2): Ocean Park Redevelopment 2002 May 1, 2002 19,315,000 July 1, 2018 3.75-5.00% 13,550,000 Earthquake Recovery Project 2006 April 1, 2006 64,720,000 July 1, 2030 4.00-5.50% 59,350,000 Subtotal tax allocation bonds - governmental activities 72,900,000 General obligation bonds (1): Main Library Improvements 1998 June 25, 1998 3,060,000 July 1, 2010 4.00-4.30% 955,000 Main Library Improvements 2002 Aug 27, 2002 25,000,000 July 1, 2022 2.00-4.60% 17,500,000 Subtotal general obligation bonds - governmental activities 18,455,000 Loans (3): State Dept. <strong>of</strong> Housing and Community Development loan Dec 22, 1988 200,000 Dec 22, 2013 0.00% 200,000 State Dept. <strong>of</strong> Housing and Community Development loan Dec 29, 1989 200,000 Dec 29, 2019 0.00% 200,000 Subtotal loans payable 400,000 Line <strong>of</strong> credit (2): Bank <strong>of</strong> America May 1, 2008 15,485,324 July 1, 2013 LIBOR plus 1.25% 15,485,324 Subtotal governmental activities 175,120,324 Business-type activities (4): Revenue bonds: Hyperion Project Revenue 1993 Dec 22, 1993 38,620,000 Jan 1, 2022 4.50-4.25% 9,670,000 Hyperion Project Revenue 2005 Oct 1, 2005 20,305,000 Jan 1, 2018 3.00-5.00% 16,090,000 Subtotal revenue bonds - business-type activities 25,760,000 Loans: State Dept. <strong>of</strong> Transportation loans various 1,305,444 July 1, 2010 6.50-7.40% 44,436 State Water Resources Control Board loan Jan 29, 1999 5,000,000 July 1, 2019 2.60% 3,058,972 Subtotal loans payable 3,103,408 For the year ended June 30, 2001, the <strong>City</strong>’s annual pension cost and its actual Subtotal business-type activities 28,863,408 Total $ 203,983,732 (1) For construction <strong>of</strong> <strong>City</strong> facilities. (2) For purchase/construction <strong>of</strong> affordable housing. (3) To fund two promissory notes receivable from the owners <strong>of</strong> certain rental properties. (4) To fund capital contribution towards wastewater treatment facility. Management believes it is in compliance with all debt covenants. 65
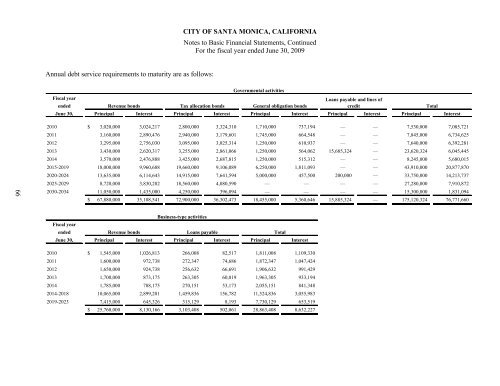
CITY OF SANTA MONICA, CALIFORNIA Notes to Basic <strong>Financial</strong> Statements, Continued For the fiscal year ended June 30, 2009 <strong>Annual</strong> debt service requirements to maturity are as follows: Governmental activities Fiscal year ended Revenue bonds Tax allocation bonds General obligation bonds Loans payable and lines <strong>of</strong> credit Total June 30, Principal Interest Principal Interest Principal Interest Principal Interest Principal Interest 66 2010 $ 3,020,000 3,024,217 2,800,000 3,324,310 1,710,000 737,194 — — 7,530,000 7,085,721 2011 3,160,000 2,890,476 2,940,000 3,179,601 1,745,000 664,548 — — 7,845,000 6,734,625 2012 3,295,000 2,756,030 3,095,000 3,025,314 1,250,000 610,937 — — 7,640,000 6,392,281 2013 3,430,000 2,620,317 3,255,000 2,861,066 1,250,000 564,062 15,685,324 — 23,620,324 6,045,445 2014 3,570,000 2,476,888 3,425,000 2,687,815 1,250,000 515,312 — — 8,245,000 5,680,015 2015-2019 18,000,000 9,960,688 19,660,000 9,106,089 6,250,000 1,811,093 — — 43,910,000 20,877,870 2020-2024 13,635,000 6,114,643 14,915,000 7,641,594 5,000,000 457,500 200,000 — 33,750,000 14,213,737 2025-2029 8,720,000 3,830,282 18,560,000 4,080,590 — — — — 27,280,000 7,910,872 2030-2034 11,050,000 1,435,000 4,250,000 396,094 — — — — 15,300,000 1,831,094 $ 67,880,000 35,108,541 72,900,000 36,302,473 18,455,000 5,360,646 15,885,324 — 175,120,324 76,771,660 Business-type activities Fiscal year ended Revenue bonds Loans payable Total June 30, Principal Interest Principal Interest Principal Interest 2010 $ 1,545,000 1,026,813 266,008 82,517 1,811,008 1,109,330 2011 1,600,000 972,738 272,347 74,686 1,872,347 1,047,424 2012 1,650,000 924,738 256,632 66,691 1,906,632 991,429 2013 1,700,000 873,175 263,305 60,019 1,963,305 933,194 2014 1,785,000 788,175 270,151 53,173 2,055,151 841,348 2014-2018 10,065,000 2,899,201 1,459,836 156,782 11,524,836 3,055,983 2019-2023 7,415,000 645,326 315,129 8,193 7,730,129 653,519 $ 25,760,000 8,130,166 3,103,408 502,061 28,863,408 8,632,227
- Page 1:
Comprehensive Annual Financial Repo
- Page 5 and 6:
CITY OF SANTA MONICA, CALIFORNIA Co
- Page 7:
THIS PAGE INTENTIONALLY LEFT BLANK.
- Page 10 and 11:
amount of borrowed property taxes i
- Page 12 and 13:
five-year forecasts, and an underst
- Page 14 and 15:
Cash Management Policies and Practi
- Page 16 and 17:
OFFICIALS OF THE CITY OF SANTA MONI
- Page 18 and 19:
Certificate of Achievement for Exce
- Page 23 and 24:
CITY OF SANTA MONICA, CALIFORNIA Ma
- Page 25 and 26:
CITY OF SANTA MONICA, CALIFORNIA Ma
- Page 27 and 28:
CITY OF SANTA MONICA, CALIFORNIA Ma
- Page 29 and 30:
CITY OF SANTA MONICA, CALIFORNIA Ma
- Page 31 and 32:
CITY OF SANTA MONICA, CALIFORNIA Ma
- Page 33 and 34:
CITY OF SANTA MONICA, CALIFORNIA Ma
- Page 36 and 37: CITY OF SANTA MONICA, CALIFORNIA St
- Page 38 and 39: CITY OF SANTA MONICA, CALIFORNIA Ma
- Page 40 and 41: CITY OF SANTA MONICA, CALIFORNIA St
- Page 42 and 43: CITY OF SANTA MONICA, CALIFORNIA St
- Page 44 and 45: CITY OF SANTA MONICA, CALIFORNIA St
- Page 46 and 47: CITY OF SANTA MONICA, CALIFORNIA St
- Page 48 and 49: CITY OF SANTA MONICA, CALIFORNIA Pr
- Page 50 and 51: CITY OF SANTA MONICA, CALIFORNIA St
- Page 52 and 53: CITY OF SANTA MONICA, CALIFORNIA St
- Page 54 and 55: CITY OF SANTA MONICA, CALIFORNIA Fi
- Page 56 and 57: CITY OF SANTA MONICA, CALIFORNIA No
- Page 58 and 59: CITY OF SANTA MONICA, CALIFORNIA No
- Page 60 and 61: CITY OF SANTA MONICA, CALIFORNIA No
- Page 62 and 63: CITY OF SANTA MONICA, CALIFORNIA No
- Page 64 and 65: CITY OF SANTA MONICA, CALIFORNIA No
- Page 66 and 67: CITY OF SANTA MONICA, CALIFORNIA No
- Page 68 and 69: CITY OF SANTA MONICA, CALIFORNIA No
- Page 70 and 71: CITY OF SANTA MONICA, CALIFORNIA No
- Page 72 and 73: CITY OF SANTA MONICA, CALIFORNIA No
- Page 74 and 75: CITY OF SANTA MONICA, CALIFORNIA No
- Page 76 and 77: CITY OF SANTA MONICA, CALIFORNIA No
- Page 78 and 79: CITY OF SANTA MONICA, CALIFORNIA No
- Page 80 and 81: CITY OF SANTA MONICA, CALIFORNIA No
- Page 82 and 83: CITY OF SANTA MONICA, CALIFORNIA No
- Page 84 and 85: CITY OF SANTA MONICA, CALIFORNIA No
- Page 88 and 89: CITY OF SANTA MONICA, CALIFORNIA No
- Page 90 and 91: CITY OF SANTA MONICA, CALIFORNIA No
- Page 92 and 93: CITY OF SANTA MONICA, CALIFORNIA No
- Page 94 and 95: CITY OF SANTA MONICA, CALIFORNIA No
- Page 96 and 97: CITY OF SANTA MONICA, CALIFORNIA No
- Page 98 and 99: CITY OF SANTA MONICA, CALIFORNIA No
- Page 100 and 101: CITY OF SANTA MONICA, CALIFORNIA No
- Page 102 and 103: CITY OF SANTA MONICA, CALIFORNIA No
- Page 104 and 105: CITY OF SANTA MONICA, CALIFORNIA No
- Page 106 and 107: CITY OF SANTA MONICA, CALIFORNIA No
- Page 108 and 109: CITY OF SANTA MONICA, CALIFORNIA No
- Page 110 and 111: City of Santa Monica, California Ye
- Page 112 and 113: CITY OF SANTA MONICA, CALIFORNIA Ca
- Page 114 and 115: CITY OF SANTA MONICA, CALIFORNIA Co
- Page 116 and 117: CITY OF SANTA MONICA, CALIFORNIA Co
- Page 118 and 119: CITY OF SANTA MONICA, CALIFORNIA Co
- Page 120 and 121: CITY OF SANTA MONICA, CALIFORNIA Sc
- Page 122 and 123: CITY OF SANTA MONICA, CALIFORNIA Sc
- Page 124 and 125: CITY OF SANTA MONICA, CALIFORNIA Sc
- Page 126 and 127: CITY OF SANTA MONICA, CALIFORNIA Sc
- Page 128 and 129: CITY OF SANTA MONICA, CALIFORNIA Sc
- Page 130 and 131: CITY OF SANTA MONICA, CALIFORNIA Sc
- Page 132 and 133: CITY OF SANTA MONICA, CALIFORNIA Co
- Page 134 and 135: CITY OF SANTA MONICA, CALIFORNIA Sc
- Page 136 and 137:
CITY OF SANTA MONICA, CALIFORNIA Sc
- Page 138 and 139:
CITY OF SANTA MONICA, CALIFORNIA Sc
- Page 140 and 141:
CITY OF SANTA MONICA, CALIFORNIA Co
- Page 142 and 143:
CITY OF SANTA MONICA, CALIFORNIA Co
- Page 144 and 145:
THIS PAGE INTENTIONALLY LEFT BLANK
- Page 146 and 147:
CITY OF SANTA MONICA, CALIFORNIA St
- Page 148 and 149:
CITY OF SANTA MONICA, CALIFORNIA St
- Page 150 and 151:
CITY OF SANTA MONICA, CALIFORNIA St
- Page 152 and 153:
CITY OF SANTA MONICA, CALIFORNIA St
- Page 154 and 155:
CITY OF SANTA MONICA, CALIFORNIA St
- Page 156 and 157:
CITY OF SANTA MONICA, CALIFORNIA Co
- Page 158:
THIS PAGE INTENTIONALLY LEFT BLANK
- Page 161 and 162:
CITY OF SANTA MONICA, CALIFORNIA Fo
- Page 163 and 164:
CITY OF SANTA MONICA, CALIFORNIA Ch
- Page 165 and 166:
CITY OF SANTA MONICA, CALIFORNIA Ch
- Page 167 and 168:
CITY OF SANTA MONICA, CALIFORNIA Ch
- Page 169 and 170:
CITY OF SANTA MONICA, CALIFORNIA Ge
- Page 171 and 172:
CITY OF SANTA MONICA, CALIFORNIA Di
- Page 173 and 174:
CITY OF SANTA MONICA, CALIFORNIA Pr
- Page 175 and 176:
CITY OF SANTA MONICA, CALIFORNIA Ra
- Page 177 and 178:
CITY OF SANTA MONICA, CALIFORNIA Di
- Page 179 and 180:
CITY OF SANTA MONICA, CALIFORNIA Wa
- Page 181 and 182:
CITY OF SANTA MONICA, CALIFORNIA Re
- Page 183 and 184:
CITY OF SANTA MONICA, CALIFORNIA Pr
- Page 185 and 186:
CITY OF SANTA MONICA, CALIFORNIA Op
- Page 187:
THIS PAGE INTENTIONALLY LEFT BLANK