

Comprehensive Annual Financial Report - City of Santa Monica
Comprehensive Annual Financial Report - City of Santa Monica
Comprehensive Annual Financial Report - City of Santa Monica

Create successful ePaper yourself
Turn your PDF publications into a flip-book with our unique Google optimized e-Paper software.
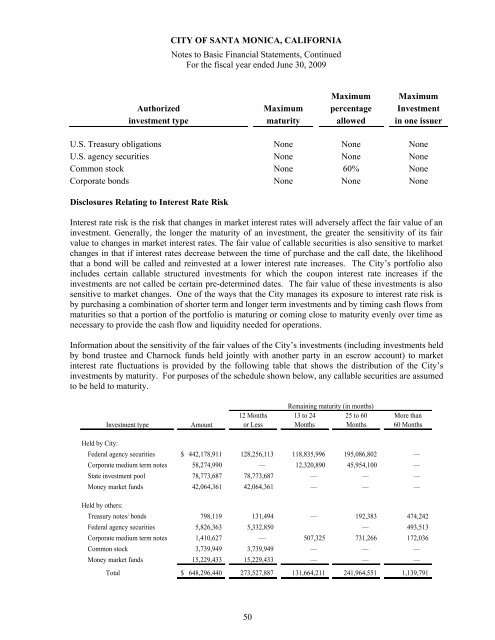
CITY OF SANTA MONICA, CALIFORNIA<br />
Notes to Basic <strong>Financial</strong> Statements, Continued<br />
For the fiscal year ended June 30, 2009<br />
Maximum Maximum<br />
Authorized Maximum percentage Investment<br />
investment type maturity allowed in one issuer<br />
U.S. Treasury obligations None None None<br />
U.S. agency securities None None None<br />
Common stock None 60% None<br />
Corporate bonds None None None<br />
Disclosures Relating to Interest Rate Risk<br />
Interest rate risk is the risk that changes in market interest rates will adversely affect the fair value <strong>of</strong> an<br />
investment. Generally, the longer the maturity <strong>of</strong> an investment, the greater the sensitivity <strong>of</strong> its fair<br />
value to changes in market interest rates. The fair value <strong>of</strong> callable securities is also sensitive to market<br />
changes in that if interest rates decrease between the time <strong>of</strong> purchase and the call date, the likelihood<br />
that a bond will be called and reinvested at a lower interest rate increases. The <strong>City</strong>’s portfolio also<br />
includes certain callable structured investments for which the coupon interest rate increases if the<br />
investments are not called be certain pre-determined dates. The fair value <strong>of</strong> these investments is also<br />
sensitive to market changes. One <strong>of</strong> the ways that the <strong>City</strong> manages its exposure to interest rate risk is<br />
by purchasing a combination <strong>of</strong> shorter term and longer term investments and by timing cash flows from<br />
maturities so that a portion <strong>of</strong> the portfolio is maturing or coming close to maturity evenly over time as<br />
necessary to provide the cash flow and liquidity needed for operations.<br />
Information about the sensitivity <strong>of</strong> the fair values <strong>of</strong> the <strong>City</strong>’s investments (including investments held<br />
by bond trustee and Charnock funds held jointly with another party in an escrow account) to market<br />
interest rate fluctuations is provided by the following table that shows the distribution <strong>of</strong> the <strong>City</strong>’s<br />
investments by maturity. For purposes <strong>of</strong> the schedule shown below, any callable securities are assumed<br />
to be held to maturity.<br />
Investment type<br />
Amount<br />
12 Months<br />
or Less<br />
Remaining maturity (in months)<br />
13 to 24 25 to 60<br />
Months Months<br />
More than<br />
60 Months<br />
Held by <strong>City</strong>:<br />
Federal agency securities $ 442,178,911 128,256,113 118,835,996 195,086,802 —<br />
Corporate medium term notes 58,274,990 — 12,320,890 45,954,100 —<br />
State investment pool 78,773,687 78,773,687 — — —<br />
Money market funds 42,064,361 42,064,361 — — —<br />
Held by others:<br />
Treasury notes/ bonds 798,119 131,494 — 192,383 474,242<br />
Federal agency securities 5,826,363 5,332,850 — 493,513<br />
Corporate medium term notes 1,410,627 — 507,325 731,266 172,036<br />
Common stock 3,739,949 3,739,949 — — —<br />
Money market funds 15,229,433 15,229,433 — — —<br />
Total $ 648,296,440 273,527,887 131,664,211 241,964,551 1,139,791<br />
50


