

Comprehensive Annual Financial Report - City of Santa Monica
Comprehensive Annual Financial Report - City of Santa Monica
Comprehensive Annual Financial Report - City of Santa Monica

You also want an ePaper? Increase the reach of your titles
YUMPU automatically turns print PDFs into web optimized ePapers that Google loves.
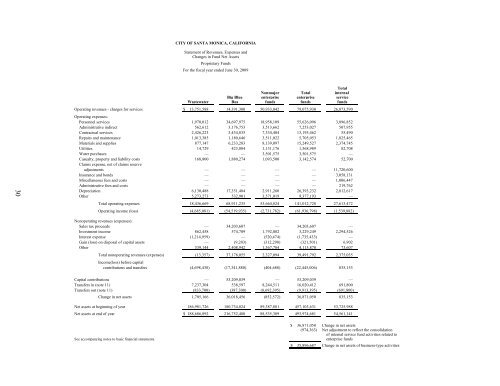
CITY OF SANTA MONICA, CALIFORNIA<br />
Statement <strong>of</strong> Revenues, Expenses and<br />
Changes in Fund Net Assets<br />
Proprietary Funds<br />
For the fiscal year ended June 30, 2009<br />
30<br />
Total<br />
Nonmajor Total internal<br />
Big Blue enterprise enterprise service<br />
Wastewater Bus funds funds funds<br />
Operating revenues - charges for services $ 13,751,588 14,391,300 50,933,042 79,075,930 26,073,590<br />
Operating expenses:<br />
Personnel services 1,970,012 34,697,975 18,958,109 55,626,096 3,896,852<br />
Administrative indirect 562,612 3,176,753 3,513,662 7,253,027 507,955<br />
Contractual services 2,426,223 3,434,835 7,334,404 13,195,462 55,490<br />
Repairs and maintenance 1,013,385 1,180,646 3,511,022 5,705,053 1,825,465<br />
Materials and supplies 877,147 6,233,283 8,139,097 15,249,527 2,374,745<br />
Utilities 14,729 423,084 1,131,176 1,568,989 82,708<br />
Water purchases — — 3,501,575 3,501,575 —<br />
Casualty, property and liability costs 168,800 1,880,274 1,093,500 3,142,574 52,700<br />
Claims expense, net <strong>of</strong> claims reserve<br />
adjustments — — — — 11,720,600<br />
Insurance and bonds — — — — 3,058,131<br />
Miscellaneous fees and costs — — — — 1,006,447<br />
Administrative fees and costs — — — — 219,762<br />
Depreciation 6,130,488 17,351,484 2,911,260 26,393,232 2,812,617<br />
Other 5,273,273 532,901 3,571,019 9,377,193 —<br />
Total operating expenses 18,436,669 68,911,235 53,664,824 141,012,728 27,613,472<br />
Operating income (loss) (4,685,081) (54,519,935) (2,731,782) (61,936,798) (1,539,882)<br />
Nonoperating revenues (expenses):<br />
Sales tax proceeds — 34,203,607 — 34,203,607 —<br />
Investment income 862,458 574,709 1,792,082 3,229,249 2,294,526<br />
Interest expense (1,214,959) — (520,474) (1,735,433) —<br />
Gain (loss) on disposal <strong>of</strong> capital assets — (9,203) (312,298) (321,501) 6,902<br />
Other 339,144 2,408,942 1,367,784 4,115,870 73,607<br />
Total nonoperating revenues (expenses) (13,357) 37,178,055 2,327,094 39,491,792 2,375,035<br />
Income(loss) before capital<br />
contributions and transfers (4,698,438) (17,341,880) (404,688) (22,445,006) 835,153<br />
Capital contributions — 53,209,039 — 53,209,039 —<br />
Transfers in (note 11) 7,237,304 538,597 8,244,511 16,020,412 691,800<br />
Transfers out (note 11) (833,700) (387,300) (8,692,395) (9,913,395) (691,800)<br />
Change in net assets 1,705,166 36,018,456 (852,572) 36,871,050 835,153<br />
Net assets at beginning <strong>of</strong> year 186,981,726 180,734,024 89,387,881 457,103,631 53,725,988<br />
Net assets at end <strong>of</strong> year $ 188,686,892 216,752,480 88,535,309 493,974,681 54,561,141<br />
$ 36,871,050 Change in net assets<br />
(974,363) Net adjustment to reflect the consolidation<br />
<strong>of</strong> internal service fund activities related to<br />
See accompanying notes to basic financial statements. enterprise funds<br />
$ 35,896,687 Change in net assets <strong>of</strong> business-type activities


