

Comprehensive Annual Financial Report - City of Santa Monica
Comprehensive Annual Financial Report - City of Santa Monica
Comprehensive Annual Financial Report - City of Santa Monica

Create successful ePaper yourself
Turn your PDF publications into a flip-book with our unique Google optimized e-Paper software.
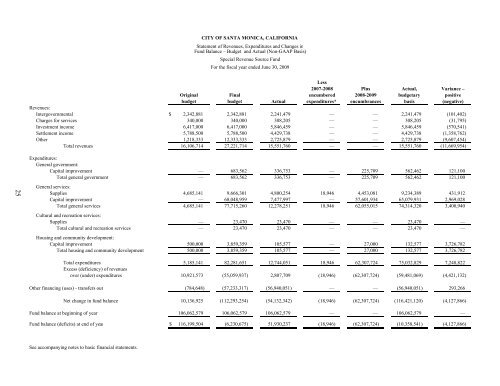
CITY OF SANTA MONICA, CALIFORNIA<br />
Statement <strong>of</strong> Revenues, Expenditures and Changes in<br />
Fund Balance – Budget and Actual (Non-GAAP Basis)<br />
Special Revenue Source Fund<br />
For the fiscal year ended June 30, 2009<br />
Less<br />
2007-2008 Plus Actual, Variance –<br />
Original Final encumbered 2008-2009 budgetary positive<br />
budget budget Actual expenditures* encumbrances basis (negative)<br />
Revenues:<br />
Intergovernmental $ 2,342,881 2,342,881 2,241,479 — — 2,241,479 (101,402)<br />
Charges for services 340,000 340,000 308,205 — — 308,205 (31,795)<br />
Investment income 6,417,000 6,417,000 5,846,459 — — 5,846,459 (570,541)<br />
Settlement income 5,788,500 5,788,500 4,429,738 — — 4,429,738 (1,358,762)<br />
Other 1,218,333 12,333,333 2,725,879 — — 2,725,879 (9,607,454)<br />
Total revenues 16,106,714 27,221,714 15,551,760 — — 15,551,760 (11,669,954)<br />
Expenditures:<br />
General government:<br />
Capital improvement — 683,562 336,753 — 225,709 562,462 121,100<br />
Total general government — 683,562 336,753 — 225,709 562,462 121,100<br />
25<br />
General services:<br />
Supplies 4,685,141 9,666,301 4,800,254 18,946 4,453,081 9,234,389 431,912<br />
Capital improvement — 68,048,959 7,477,997 — 57,601,934 65,079,931 2,969,028<br />
Total general services 4,685,141 77,715,260 12,278,251 18,946 62,055,015 74,314,320 3,400,940<br />
Cultural and recreation services:<br />
Supplies — 23,470 23,470 — — 23,470 —<br />
Total cultural and recreation services — 23,470 23,470 — — 23,470 —<br />
Housing and community development:<br />
Capital improvement 500,000 3,859,359 105,577 — 27,000 132,577 3,726,782<br />
Total housing and community development 500,000 3,859,359 105,577 — 27,000 132,577 3,726,782<br />
Total expenditures 5,185,141 82,281,651 12,744,051 18,946 62,307,724 75,032,829 7,248,822<br />
Excess (deficiency) <strong>of</strong> revenues<br />
over (under) expenditures 10,921,573 (55,059,937) 2,807,709 (18,946) (62,307,724) (59,481,069) (4,421,132)<br />
Other financing (uses) - transfers out (784,648) (57,233,317) (56,940,051) — — (56,940,051) 293,266<br />
Net change in fund balance 10,136,925 (112,293,254) (54,132,342) (18,946) (62,307,724) (116,421,120) (4,127,866)<br />
Fund balance at beginning <strong>of</strong> year 106,062,579 106,062,579 106,062,579 — — 106,062,579 —<br />
Fund balance (deficits) at end <strong>of</strong> year $ 116,199,504 (6,230,675) 51,930,237 (18,946) (62,307,724) (10,358,541) (4,127,866)<br />
See accompanying notes to basic financial statements.


