

Comprehensive Annual Financial Report - City of Santa Monica
Comprehensive Annual Financial Report - City of Santa Monica
Comprehensive Annual Financial Report - City of Santa Monica

You also want an ePaper? Increase the reach of your titles
YUMPU automatically turns print PDFs into web optimized ePapers that Google loves.
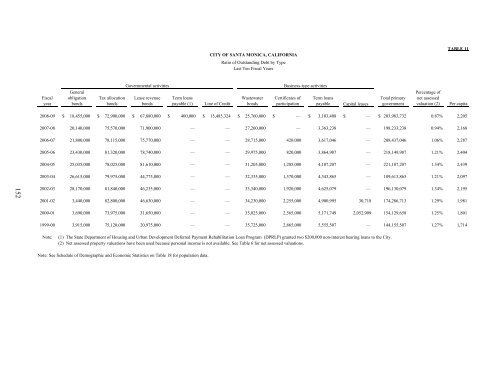
CITY OF SANTA MONICA, CALIFORNIA<br />
Ratio <strong>of</strong> Outstanding Debt by Type<br />
Last Ten Fiscal Years<br />
TABLE 11<br />
Fiscal<br />
year<br />
General<br />
obligation<br />
bonds<br />
Tax allocation<br />
bonds<br />
Governmental activities<br />
Lease revenue<br />
bonds<br />
Term loans<br />
payable (1)<br />
Line <strong>of</strong> Credit<br />
Wastewater<br />
bonds<br />
Business-type activities<br />
Certificates <strong>of</strong><br />
participation<br />
Term loans<br />
payable<br />
Capital leases<br />
Total primary<br />
government<br />
Percentage <strong>of</strong><br />
net assessed<br />
valuation (2)<br />
Per capita<br />
2008-09 $ 18,455,000 $ 72,900,000 $ 67,880,000 $ 400,000 $ 15,485,324 $ 25,760,000 $ — $ 3,103,408 $ — $ 203,983,732<br />
0.87% 2,205<br />
2007-08 20,140,000 75,570,000 71,900,000 — — 27,260,000 — 3,363,238 — 198,233,238 0.94% 2,168<br />
2006-07 21,800,000 78,115,000 75,770,000 — — 28,715,000 420,000 3,617,046 — 208,437,046 1.06% 2,287<br />
2005-06 23,430,000 81,320,000 78,740,000 — — 29,975,000 820,000 3,864,987 — 218,149,987 1.21% 2,404<br />
2004-05 25,035,000 78,025,000 81,610,000 — — 31,205,000 1,205,000 4,107,207 — 221,187,207 1.34% 2,439<br />
2003-04 26,615,000 79,975,000 44,775,000 — — 32,335,000 1,570,000 4,343,865 — 189,613,865 1.21% 2,097<br />
152<br />
2002-03 28,170,000 81,840,000 46,235,000 — — 33,340,000 1,920,000 4,625,079 — 196,130,079 1.34% 2,195<br />
2001-02 3,440,000 82,800,000 46,630,000 — — 34,230,000 2,255,000 4,900,995 30,718 174,286,713 1.29% 1,981<br />
2000-01 3,690,000 73,975,000 31,650,000 — — 35,025,000 2,565,000 5,171,749 2,052,909 154,129,658 1.25% 1,801<br />
1999-00 3,915,000 75,120,000 20,975,000 — — 35,725,000 2,865,000 5,555,507 — 144,155,507 1.27% 1,714<br />
Note:<br />
(1) The State Department <strong>of</strong> Housing and Urban Development Deferred Payment Rehabilitation Loan Program (DPRLP) granted two $200,000 non-interest bearing loans to the <strong>City</strong>.<br />
(2) Net assessed property valuations have been used because personal income is not available. See Table 6 for net assessed valuations.<br />
Note: See Schedule <strong>of</strong> Demographic and Economic Statistics on Table 18 for population data.


