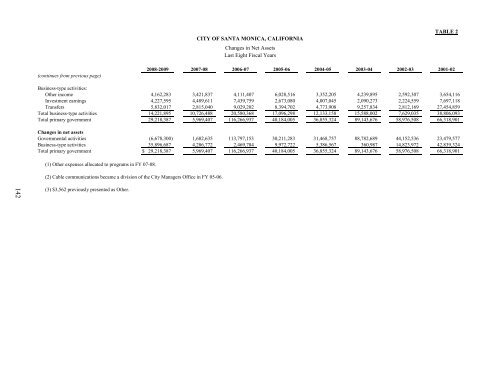
CITY OF SANTA MONICA, CALIFORNIA Changes in Net Assets Last Eight Fiscal Years TABLE 2 (continues from previous page) 2008-2009 2007-08 2006-07 2005-06 2004-05 2003-04 2002-03 2001-02 Business-type activities: Charges for services: Water 15,774,047 16,130,044 15,323,653 13,868,390 13,113,058 13,110,498 13,636,278 12,413,133 Solid waste management 21,631,313 18,842,702 18,766,107 17,097,813 15,704,667 14,598,362 14,622,424 13,252,431 Pier 3,518,145 3,107,349 3,081,338 2,693,200 2,717,162 2,563,783 2,275,873 2,339,948 Wastewater 13,751,588 12,797,786 12,472,073 11,175,051 11,376,456 11,004,692 10,768,475 9,877,135 Civic auditorium 2,975,749 3,117,033 2,789,196 2,608,759 2,474,609 2,279,508 2,229,724 2,225,713 Airport 3,989,851 4,279,268 3,992,190 3,862,455 3,706,719 3,527,460 2,962,153 2,705,373 Storm water management 1,885,142 1,301,350 1,376,672 1,610,715 1,439,149 1,355,903 1,825,026 2,741,931 Cemetery 1,009,595 1,080,532 735,718 665,398 650,484 445,327 396,638 686,153 Big Blue Bus 14,391,300 13,898,980 13,078,630 13,333,584 11,298,250 12,190,925 11,903,989 10,129,564 Cable communications (2) — — — — 798,984 747,063 664,318 490,471 Parking authority 149,200 145,600 141,600 138,100 1,612,705 1,457,952 1,370,445 1,221,853 141 Operating grants and contributions 34,203,607 32,188,569 31,723,528 32,297,732 29,638,114 24,671,943 22,455,902 20,782,963 Capital grants and contributions 53,209,039 20,030,403 12,185,518 19,061,484 17,318,761 7,943,966 26,497,439 22,614,054 Business-type activities program revenues 166,488,576 126,919,616 115,666,223 118,412,681 111,849,118 95,897,382 111,608,684 101,480,722 Total primary government program revenues 297,023,356 245,009,999 225,516,095 216,928,184 201,511,501 188,383,900 203,553,371 157,678,269 Net (expense): Governmental activities (356,604,557) (268,619,507) (202,428,486) (194,869,809) (163,265,305) (154,835,738) (120,481,201) (150,500,084) Business-type activities 21,674,792 (6,439,716) (18,110,584) (7,123,576) (6,746,591) (15,227,015) 7,194,937 4,033,231 Total primary government net expense (334,929,765) (275,059,223) (220,539,070) (201,993,385) (170,011,896) (170,062,753) (113,286,264) (146,466,853) General Revenues and Other changes in Net Assets Governmental activities: Taxes: Business 28,821,688 26,211,226 24,232,707 21,775,442 20,384,372 19,249,942 18,963,761 32,574,841 Property 107,255,345 101,323,706 89,845,591 79,951,933 64,667,456 58,267,374 50,562,134 47,446,878 Sales 28,296,696 32,356,941 33,267,253 31,871,593 27,579,776 27,825,098 25,235,982 24,586,014 Other 76,146,388 81,762,203 77,036,651 71,788,854 67,203,194 65,196,019 60,661,614 61,092,973 Settlement income 89,910,872 1,012,863 69,153,512 6,453,804 4,545,498 73,978,421 — — Other income 9,128,899 8,428,266 6,213,329 9,638,813 4,838,074 4,713,695 6,284,767 9,603,004 Investment earnings 16,198,386 22,021,977 25,505,798 11,995,355 10,289,600 3,645,712 5,737,648 26,130,810 Transfers (5,832,017) (2,815,040) (9,029,202) (8,394,702) (4,773,908) (9,257,834) (2,812,169) (27,454,859) Total governmental activities 349,926,257 270,302,142 316,225,639 225,081,092 194,734,062 243,618,427 164,633,737 173,979,661 (continues next page)
CITY OF SANTA MONICA, CALIFORNIA Changes in Net Assets Last Eight Fiscal Years TABLE 2 (continues from previous page) 2008-2009 2007-08 2006-07 2005-06 2004-05 2003-04 2002-03 2001-02 Business-type activities: Other income 4,162,283 3,421,837 4,111,407 6,028,516 3,352,205 4,239,895 2,592,307 3,654,116 Investment earnings 4,227,595 4,489,611 7,439,759 2,673,080 4,007,045 2,090,273 2,224,559 7,697,118 Transfers 5,832,017 2,815,040 9,029,202 8,394,702 4,773,908 9,257,834 2,812,169 27,454,859 Total business-type activities 14,221,895 10,726,488 20,580,368 17,096,298 12,133,158 15,588,002 7,629,035 38,806,093 Total primary government 29,218,387 5,969,407 116,266,937 40,184,005 36,855,324 89,143,676 58,976,508 66,318,901 Changes in net assets Governmental activities (6,678,300) 1,682,635 113,797,153 30,211,283 31,468,757 88,782,689 44,152,536 23,479,577 Business-type activities 35,896,687 4,286,772 2,469,784 9,972,722 5,386,567 360,987 14,823,972 42,839,324 Total primary government $ 29,218,387 5,969,407 116,266,937 40,184,005 36,855,324 89,143,676 58,976,508 66,318,901 (1) Other expenses allocated to programs in FY 07-08. (2) Cable communications became a division <strong>of</strong> the <strong>City</strong> Managers Office in FY 05-06. 142 (3) $3,562 previously presented as Other.
- Page 1:
Comprehensive Annual Financial Repo
- Page 5 and 6:
CITY OF SANTA MONICA, CALIFORNIA Co
- Page 7:
THIS PAGE INTENTIONALLY LEFT BLANK.
- Page 10 and 11:
amount of borrowed property taxes i
- Page 12 and 13:
five-year forecasts, and an underst
- Page 14 and 15:
Cash Management Policies and Practi
- Page 16 and 17:
OFFICIALS OF THE CITY OF SANTA MONI
- Page 18 and 19:
Certificate of Achievement for Exce
- Page 23 and 24:
CITY OF SANTA MONICA, CALIFORNIA Ma
- Page 25 and 26:
CITY OF SANTA MONICA, CALIFORNIA Ma
- Page 27 and 28:
CITY OF SANTA MONICA, CALIFORNIA Ma
- Page 29 and 30:
CITY OF SANTA MONICA, CALIFORNIA Ma
- Page 31 and 32:
CITY OF SANTA MONICA, CALIFORNIA Ma
- Page 33 and 34:
CITY OF SANTA MONICA, CALIFORNIA Ma
- Page 36 and 37:
CITY OF SANTA MONICA, CALIFORNIA St
- Page 38 and 39:
CITY OF SANTA MONICA, CALIFORNIA Ma
- Page 40 and 41:
CITY OF SANTA MONICA, CALIFORNIA St
- Page 42 and 43:
CITY OF SANTA MONICA, CALIFORNIA St
- Page 44 and 45:
CITY OF SANTA MONICA, CALIFORNIA St
- Page 46 and 47:
CITY OF SANTA MONICA, CALIFORNIA St
- Page 48 and 49:
CITY OF SANTA MONICA, CALIFORNIA Pr
- Page 50 and 51:
CITY OF SANTA MONICA, CALIFORNIA St
- Page 52 and 53:
CITY OF SANTA MONICA, CALIFORNIA St
- Page 54 and 55:
CITY OF SANTA MONICA, CALIFORNIA Fi
- Page 56 and 57:
CITY OF SANTA MONICA, CALIFORNIA No
- Page 58 and 59:
CITY OF SANTA MONICA, CALIFORNIA No
- Page 60 and 61:
CITY OF SANTA MONICA, CALIFORNIA No
- Page 62 and 63:
CITY OF SANTA MONICA, CALIFORNIA No
- Page 64 and 65:
CITY OF SANTA MONICA, CALIFORNIA No
- Page 66 and 67:
CITY OF SANTA MONICA, CALIFORNIA No
- Page 68 and 69:
CITY OF SANTA MONICA, CALIFORNIA No
- Page 70 and 71:
CITY OF SANTA MONICA, CALIFORNIA No
- Page 72 and 73:
CITY OF SANTA MONICA, CALIFORNIA No
- Page 74 and 75:
CITY OF SANTA MONICA, CALIFORNIA No
- Page 76 and 77:
CITY OF SANTA MONICA, CALIFORNIA No
- Page 78 and 79:
CITY OF SANTA MONICA, CALIFORNIA No
- Page 80 and 81:
CITY OF SANTA MONICA, CALIFORNIA No
- Page 82 and 83:
CITY OF SANTA MONICA, CALIFORNIA No
- Page 84 and 85:
CITY OF SANTA MONICA, CALIFORNIA No
- Page 86 and 87:
CITY OF SANTA MONICA, CALIFORNIA No
- Page 88 and 89:
CITY OF SANTA MONICA, CALIFORNIA No
- Page 90 and 91:
CITY OF SANTA MONICA, CALIFORNIA No
- Page 92 and 93:
CITY OF SANTA MONICA, CALIFORNIA No
- Page 94 and 95:
CITY OF SANTA MONICA, CALIFORNIA No
- Page 96 and 97:
CITY OF SANTA MONICA, CALIFORNIA No
- Page 98 and 99:
CITY OF SANTA MONICA, CALIFORNIA No
- Page 100 and 101:
CITY OF SANTA MONICA, CALIFORNIA No
- Page 102 and 103:
CITY OF SANTA MONICA, CALIFORNIA No
- Page 104 and 105:
CITY OF SANTA MONICA, CALIFORNIA No
- Page 106 and 107:
CITY OF SANTA MONICA, CALIFORNIA No
- Page 108 and 109:
CITY OF SANTA MONICA, CALIFORNIA No
- Page 110 and 111:
City of Santa Monica, California Ye
- Page 112 and 113:
CITY OF SANTA MONICA, CALIFORNIA Ca
- Page 114 and 115: CITY OF SANTA MONICA, CALIFORNIA Co
- Page 116 and 117: CITY OF SANTA MONICA, CALIFORNIA Co
- Page 118 and 119: CITY OF SANTA MONICA, CALIFORNIA Co
- Page 120 and 121: CITY OF SANTA MONICA, CALIFORNIA Sc
- Page 122 and 123: CITY OF SANTA MONICA, CALIFORNIA Sc
- Page 124 and 125: CITY OF SANTA MONICA, CALIFORNIA Sc
- Page 126 and 127: CITY OF SANTA MONICA, CALIFORNIA Sc
- Page 128 and 129: CITY OF SANTA MONICA, CALIFORNIA Sc
- Page 130 and 131: CITY OF SANTA MONICA, CALIFORNIA Sc
- Page 132 and 133: CITY OF SANTA MONICA, CALIFORNIA Co
- Page 134 and 135: CITY OF SANTA MONICA, CALIFORNIA Sc
- Page 136 and 137: CITY OF SANTA MONICA, CALIFORNIA Sc
- Page 138 and 139: CITY OF SANTA MONICA, CALIFORNIA Sc
- Page 140 and 141: CITY OF SANTA MONICA, CALIFORNIA Co
- Page 142 and 143: CITY OF SANTA MONICA, CALIFORNIA Co
- Page 144 and 145: THIS PAGE INTENTIONALLY LEFT BLANK
- Page 146 and 147: CITY OF SANTA MONICA, CALIFORNIA St
- Page 148 and 149: CITY OF SANTA MONICA, CALIFORNIA St
- Page 150 and 151: CITY OF SANTA MONICA, CALIFORNIA St
- Page 152 and 153: CITY OF SANTA MONICA, CALIFORNIA St
- Page 154 and 155: CITY OF SANTA MONICA, CALIFORNIA St
- Page 156 and 157: CITY OF SANTA MONICA, CALIFORNIA Co
- Page 158: THIS PAGE INTENTIONALLY LEFT BLANK
- Page 161 and 162: CITY OF SANTA MONICA, CALIFORNIA Fo
- Page 163: CITY OF SANTA MONICA, CALIFORNIA Ch
- Page 167 and 168: CITY OF SANTA MONICA, CALIFORNIA Ch
- Page 169 and 170: CITY OF SANTA MONICA, CALIFORNIA Ge
- Page 171 and 172: CITY OF SANTA MONICA, CALIFORNIA Di
- Page 173 and 174: CITY OF SANTA MONICA, CALIFORNIA Pr
- Page 175 and 176: CITY OF SANTA MONICA, CALIFORNIA Ra
- Page 177 and 178: CITY OF SANTA MONICA, CALIFORNIA Di
- Page 179 and 180: CITY OF SANTA MONICA, CALIFORNIA Wa
- Page 181 and 182: CITY OF SANTA MONICA, CALIFORNIA Re
- Page 183 and 184: CITY OF SANTA MONICA, CALIFORNIA Pr
- Page 185 and 186: CITY OF SANTA MONICA, CALIFORNIA Op
- Page 187: THIS PAGE INTENTIONALLY LEFT BLANK