

Comprehensive Annual Financial Report - City of Santa Monica
Comprehensive Annual Financial Report - City of Santa Monica
Comprehensive Annual Financial Report - City of Santa Monica

Create successful ePaper yourself
Turn your PDF publications into a flip-book with our unique Google optimized e-Paper software.
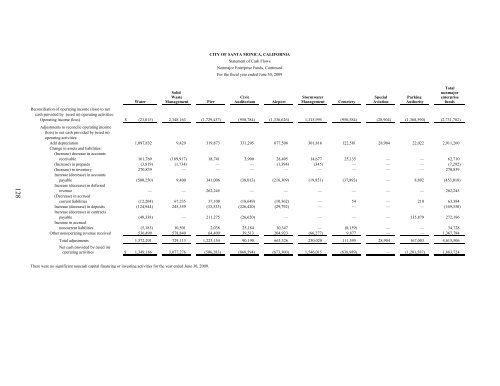
CITY OF SANTA MONICA, CALIFORNIA<br />
Statement <strong>of</strong> Cash Flows<br />
Nonmajor Enterprise Funds, Continued<br />
For the fiscal year ended June 30, 2009<br />
128<br />
Total<br />
Solid<br />
nonmajor<br />
Waste Civic Stormwater Special Parking enterprise<br />
Water Management Pier Auditorium Airport Management Cemetery Aviation Authority funds<br />
Reconciliation <strong>of</strong> operating income (loss) to net<br />
cash provided by (used in) operating activities:<br />
Operating income (loss) $ (23,015) 2,348,163 (1,729,437) (958,784) (1,336,626) 1,315,995 (950,584) (28,904) (1,368,590) (2,731,782)<br />
Adjustments to reconcile operating income<br />
(loss) to net cash provided by (used in)<br />
operating activities:<br />
Add depreciation 1,097,832 9,429 319,873 331,295 677,508 301,816 122,581 28,904 22,022 2,911,260<br />
Change in assets and liabilities:<br />
(Increase) decrease in accounts<br />
receivable 161,769 (189,917) 18,741 3,900 28,405 14,677 25,135 — — 62,710<br />
(Increase) in prepaids (3,819) (1,734) — — (1,394) (345) — — — (7,292)<br />
(Increase) in inventory 270,839 — — — — — — — — 270,839<br />
Increase (decrease) in accounts<br />
payable (500,250) 9,400 341,006 (38,013) (216,309) (19,851) (37,893) — 8,892 (453,018)<br />
Increase (decrease) in deferred<br />
revenue — — 262,245 — — — — — — 262,245<br />
(Decrease) in accrued<br />
current liabilities (12,204) 67,235 37,100 (18,649) (10,362) — 54 — 210 63,384<br />
Increase (decrease) in deposits (124,944) 245,359 (33,533) (226,420) (29,792) — — — — (169,330)<br />
Increase (decrease) in contracts<br />
payable (48,338) — 211,275 (26,620) — — — — 135,879 272,196<br />
Increase in accrued<br />
noncurrent liabilities (5,183) 10,501 2,038 25,184 10,347 — (8,159) — — 34,728<br />
Other nonoperating revenue received 536,499 578,840 64,409 39,513 204,923 (66,277) 9,877 — — 1,367,784<br />
Total adjustments 1,372,201 729,113 1,223,154 90,190 663,326 230,020 111,595 28,904 167,003 4,615,506<br />
Net cash provided by (used in)<br />
operating activities $ 1,349,186 3,077,276 (506,283) (868,594) (673,300) 1,546,015 (838,989) — (1,201,587) 1,883,724<br />
There were no significant noncash capital financing or investing activities for the year ended June 30, 2009.


