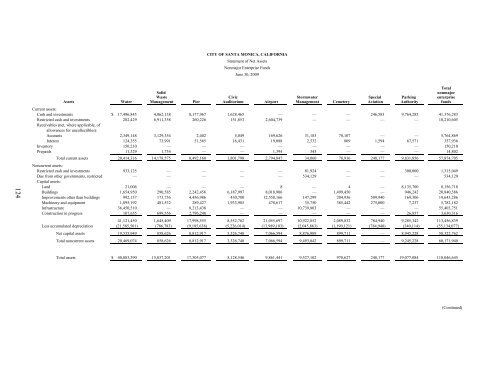
CITY OF SANTA MONICA, CALIFORNIA Statement <strong>of</strong> Net Assets Nonmajor Enterprise Funds June 30, 2009 124 Total Solid nonmajor Waste Civic Stormwater Special Parking enterprise Assets Water Management Pier Auditorium Airport Management Cemetery Aviation Authority funds Current assets: Cash and investments $ 17,496,845 4,062,138 8,177,967 1,628,465 — — — 246,583 9,764,285 41,376,283 Restricted cash and investments 282,429 6,911,358 260,226 151,853 2,604,739 — — — — 10,210,605 Receivables (net, where applicable, <strong>of</strong> allowances for uncollectibles): Accounts 2,349,148 3,129,354 2,402 5,049 169,626 31,183 78,107 — — 5,764,869 Interest 124,355 73,991 51,565 16,431 19,088 2,532 809 1,594 67,571 357,936 Inventory 150,210 — — — — — — — — 150,210 Prepaids 11,329 1,734 — — 1,394 345 — — — 14,802 Total current assets 20,414,316 14,178,575 8,492,160 1,801,798 2,794,847 34,060 78,916 248,177 9,831,856 57,874,705 Noncurrent assets: Restricted cash and investments 933,125 — — — — 81,924 — — 300,000 1,315,049 Due from other governments, restricted — — — — — 534,129 — — — 534,129 Capital assets: Land 21,006 — — — 8 — 4 — 8,135,700 8,156,718 Buildings 1,654,950 290,585 2,242,456 6,187,997 8,018,906 — 1,499,450 — 946,242 20,840,586 Improvements other than buildings 992,137 173,736 4,456,986 430,780 12,558,166 147,299 204,936 509,940 169,306 19,643,286 Machinery and equipment 1,895,192 481,532 289,427 1,933,985 478,617 35,750 385,442 275,000 7,237 5,782,182 Infrastructure 36,450,510 — 8,213,438 — — 10,739,803 — — — 55,403,751 Construction in progress 107,655 699,556 2,796,248 — — — — — 26,857 3,630,316 41,121,450 1,645,409 17,998,555 8,552,762 21,055,697 10,922,852 2,089,832 784,940 9,285,342 113,456,839 Less accumulated depreciation (21,585,501) (786,783) (9,185,638) (5,226,014) (13,989,103) (2,045,863) (1,190,121) (784,940) (340,114) (55,134,077) Net capital assets 19,535,949 858,626 8,812,917 3,326,748 7,066,594 8,876,989 899,711 — 8,945,228 58,322,762 Total noncurrent assets 20,469,074 858,626 8,812,917 3,326,748 7,066,594 9,493,042 899,711 — 9,245,228 60,171,940 Total assets $ 40,883,390 15,037,201 17,305,077 5,128,546 9,861,441 9,527,102 978,627 248,177 19,077,084 118,046,645 (Continued)
CITY OF SANTA MONICA, CALIFORNIA Statement <strong>of</strong> Net Assets, Continued Nonmajor Enterprise Funds June 30, 2009 125 Total Solid nonmajor Waste Civic Stormwater Special Parking enterprise Liabilities Water Management Pier Auditorium Airport Management Cemetery Aviation Authority funds s Current liabilities: Accounts payable $ 1,124,278 428,204 528,892 41,372 143,871 — 48,097 — 49,603 2,364,317 Accrued liabilities 298,994 448,151 91,454 145,852 78,820 — 42,002 — 210 1,105,483 Contracts payable (retained percentage) — — 227,358 — — — — — 135,879 363,237 Interest payable — — — — — 26,511 — — — 26,511 Due to other funds — — — — — 1,258,489 118,065 — — 1,376,554 Current portion <strong>of</strong> long-term obligations — — — — 22,218 243,790 — — — 266,008 Liabilities payable from restricted assets - deposits 153,064 6,911,358 260,226 — 352,952 — — — — 7,677,600 Total current liabilities 1,576,336 7,787,713 1,107,930 187,224 597,861 1,528,790 208,164 — 185,692 13,179,710 Noncurrent liabilities: Accrued liabilities 205,048 189,443 52,951 45,988 40,624 — 12,067 — — 546,121 Advances from other funds — — — — 9,519,786 — 3,166,074 — — 12,685,860 Deferred revenue — — 262,245 — — — — — — 262,245 Long-term obligations, net <strong>of</strong> current portion — — — — 22,218 2,815,182 — — — 2,837,400 Total noncurrent liabilities 205,048 189,443 315,196 45,988 9,582,628 2,815,182 3,178,141 — — 16,331,626 Total liabilities 1,781,384 7,977,156 1,423,126 233,212 10,180,489 4,343,972 3,386,305 — 185,692 29,511,336 Net Assets Invested in capital assets, net <strong>of</strong> related debt 19,535,949 858,626 8,812,917 3,326,748 7,022,158 5,818,017 899,711 — 8,945,228 55,219,354 Unrestricted 19,566,057 6,201,419 7,069,034 1,568,586 (7,341,206) (634,887) (3,307,389) 248,177 9,946,164 33,315,955 Total net assets $ 39,102,006 7,060,045 15,881,951 4,895,334 (319,048) 5,183,130 (2,407,678) 248,177 18,891,392 88,535,309
- Page 1:
Comprehensive Annual Financial Repo
- Page 5 and 6:
CITY OF SANTA MONICA, CALIFORNIA Co
- Page 7:
THIS PAGE INTENTIONALLY LEFT BLANK.
- Page 10 and 11:
amount of borrowed property taxes i
- Page 12 and 13:
five-year forecasts, and an underst
- Page 14 and 15:
Cash Management Policies and Practi
- Page 16 and 17:
OFFICIALS OF THE CITY OF SANTA MONI
- Page 18 and 19:
Certificate of Achievement for Exce
- Page 23 and 24:
CITY OF SANTA MONICA, CALIFORNIA Ma
- Page 25 and 26:
CITY OF SANTA MONICA, CALIFORNIA Ma
- Page 27 and 28:
CITY OF SANTA MONICA, CALIFORNIA Ma
- Page 29 and 30:
CITY OF SANTA MONICA, CALIFORNIA Ma
- Page 31 and 32:
CITY OF SANTA MONICA, CALIFORNIA Ma
- Page 33 and 34:
CITY OF SANTA MONICA, CALIFORNIA Ma
- Page 36 and 37:
CITY OF SANTA MONICA, CALIFORNIA St
- Page 38 and 39:
CITY OF SANTA MONICA, CALIFORNIA Ma
- Page 40 and 41:
CITY OF SANTA MONICA, CALIFORNIA St
- Page 42 and 43:
CITY OF SANTA MONICA, CALIFORNIA St
- Page 44 and 45:
CITY OF SANTA MONICA, CALIFORNIA St
- Page 46 and 47:
CITY OF SANTA MONICA, CALIFORNIA St
- Page 48 and 49:
CITY OF SANTA MONICA, CALIFORNIA Pr
- Page 50 and 51:
CITY OF SANTA MONICA, CALIFORNIA St
- Page 52 and 53:
CITY OF SANTA MONICA, CALIFORNIA St
- Page 54 and 55:
CITY OF SANTA MONICA, CALIFORNIA Fi
- Page 56 and 57:
CITY OF SANTA MONICA, CALIFORNIA No
- Page 58 and 59:
CITY OF SANTA MONICA, CALIFORNIA No
- Page 60 and 61:
CITY OF SANTA MONICA, CALIFORNIA No
- Page 62 and 63:
CITY OF SANTA MONICA, CALIFORNIA No
- Page 64 and 65:
CITY OF SANTA MONICA, CALIFORNIA No
- Page 66 and 67:
CITY OF SANTA MONICA, CALIFORNIA No
- Page 68 and 69:
CITY OF SANTA MONICA, CALIFORNIA No
- Page 70 and 71:
CITY OF SANTA MONICA, CALIFORNIA No
- Page 72 and 73:
CITY OF SANTA MONICA, CALIFORNIA No
- Page 74 and 75:
CITY OF SANTA MONICA, CALIFORNIA No
- Page 76 and 77:
CITY OF SANTA MONICA, CALIFORNIA No
- Page 78 and 79:
CITY OF SANTA MONICA, CALIFORNIA No
- Page 80 and 81:
CITY OF SANTA MONICA, CALIFORNIA No
- Page 82 and 83:
CITY OF SANTA MONICA, CALIFORNIA No
- Page 84 and 85:
CITY OF SANTA MONICA, CALIFORNIA No
- Page 86 and 87:
CITY OF SANTA MONICA, CALIFORNIA No
- Page 88 and 89:
CITY OF SANTA MONICA, CALIFORNIA No
- Page 90 and 91:
CITY OF SANTA MONICA, CALIFORNIA No
- Page 92 and 93:
CITY OF SANTA MONICA, CALIFORNIA No
- Page 94 and 95:
CITY OF SANTA MONICA, CALIFORNIA No
- Page 96 and 97: CITY OF SANTA MONICA, CALIFORNIA No
- Page 98 and 99: CITY OF SANTA MONICA, CALIFORNIA No
- Page 100 and 101: CITY OF SANTA MONICA, CALIFORNIA No
- Page 102 and 103: CITY OF SANTA MONICA, CALIFORNIA No
- Page 104 and 105: CITY OF SANTA MONICA, CALIFORNIA No
- Page 106 and 107: CITY OF SANTA MONICA, CALIFORNIA No
- Page 108 and 109: CITY OF SANTA MONICA, CALIFORNIA No
- Page 110 and 111: City of Santa Monica, California Ye
- Page 112 and 113: CITY OF SANTA MONICA, CALIFORNIA Ca
- Page 114 and 115: CITY OF SANTA MONICA, CALIFORNIA Co
- Page 116 and 117: CITY OF SANTA MONICA, CALIFORNIA Co
- Page 118 and 119: CITY OF SANTA MONICA, CALIFORNIA Co
- Page 120 and 121: CITY OF SANTA MONICA, CALIFORNIA Sc
- Page 122 and 123: CITY OF SANTA MONICA, CALIFORNIA Sc
- Page 124 and 125: CITY OF SANTA MONICA, CALIFORNIA Sc
- Page 126 and 127: CITY OF SANTA MONICA, CALIFORNIA Sc
- Page 128 and 129: CITY OF SANTA MONICA, CALIFORNIA Sc
- Page 130 and 131: CITY OF SANTA MONICA, CALIFORNIA Sc
- Page 132 and 133: CITY OF SANTA MONICA, CALIFORNIA Co
- Page 134 and 135: CITY OF SANTA MONICA, CALIFORNIA Sc
- Page 136 and 137: CITY OF SANTA MONICA, CALIFORNIA Sc
- Page 138 and 139: CITY OF SANTA MONICA, CALIFORNIA Sc
- Page 140 and 141: CITY OF SANTA MONICA, CALIFORNIA Co
- Page 142 and 143: CITY OF SANTA MONICA, CALIFORNIA Co
- Page 144 and 145: THIS PAGE INTENTIONALLY LEFT BLANK
- Page 148 and 149: CITY OF SANTA MONICA, CALIFORNIA St
- Page 150 and 151: CITY OF SANTA MONICA, CALIFORNIA St
- Page 152 and 153: CITY OF SANTA MONICA, CALIFORNIA St
- Page 154 and 155: CITY OF SANTA MONICA, CALIFORNIA St
- Page 156 and 157: CITY OF SANTA MONICA, CALIFORNIA Co
- Page 158: THIS PAGE INTENTIONALLY LEFT BLANK
- Page 161 and 162: CITY OF SANTA MONICA, CALIFORNIA Fo
- Page 163 and 164: CITY OF SANTA MONICA, CALIFORNIA Ch
- Page 165 and 166: CITY OF SANTA MONICA, CALIFORNIA Ch
- Page 167 and 168: CITY OF SANTA MONICA, CALIFORNIA Ch
- Page 169 and 170: CITY OF SANTA MONICA, CALIFORNIA Ge
- Page 171 and 172: CITY OF SANTA MONICA, CALIFORNIA Di
- Page 173 and 174: CITY OF SANTA MONICA, CALIFORNIA Pr
- Page 175 and 176: CITY OF SANTA MONICA, CALIFORNIA Ra
- Page 177 and 178: CITY OF SANTA MONICA, CALIFORNIA Di
- Page 179 and 180: CITY OF SANTA MONICA, CALIFORNIA Wa
- Page 181 and 182: CITY OF SANTA MONICA, CALIFORNIA Re
- Page 183 and 184: CITY OF SANTA MONICA, CALIFORNIA Pr
- Page 185 and 186: CITY OF SANTA MONICA, CALIFORNIA Op
- Page 187: THIS PAGE INTENTIONALLY LEFT BLANK