

Comprehensive Annual Financial Report - City of Santa Monica
Comprehensive Annual Financial Report - City of Santa Monica
Comprehensive Annual Financial Report - City of Santa Monica

Create successful ePaper yourself
Turn your PDF publications into a flip-book with our unique Google optimized e-Paper software.
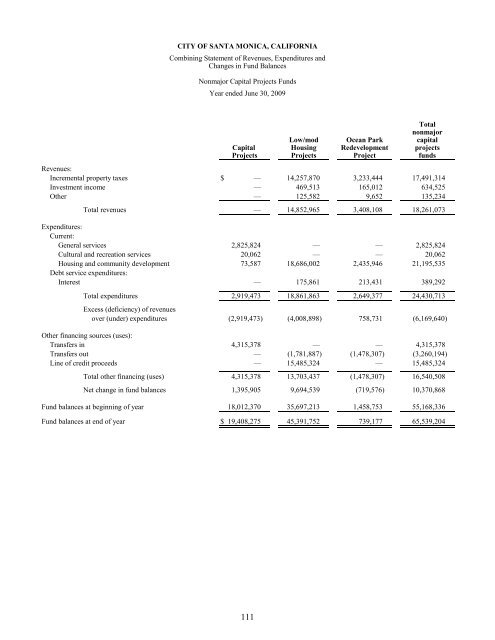
CITY OF SANTA MONICA, CALIFORNIA<br />
Combining Statement <strong>of</strong> Revenues, Expenditures and<br />
Changes in Fund Balances<br />
Nonmajor Capital Projects Funds<br />
Year ended June 30, 2009<br />
Total<br />
nonmajor<br />
Low/mod Ocean Park capital<br />
Capital Housing Redevelopment projects<br />
Projects Projects Project funds<br />
Revenues:<br />
Incremental property taxes $ — 14,257,870 3,233,444 17,491,314<br />
Investment income — 469,513 165,012 634,525<br />
Other — 125,582 9,652 135,234<br />
Total revenues — 14,852,965 3,408,108 18,261,073<br />
Expenditures:<br />
Current:<br />
General services 2,825,824 — — 2,825,824<br />
Cultural and recreation services 20,062 — — 20,062<br />
Housing and community development 73,587 18,686,002 2,435,946 21,195,535<br />
Debt service expenditures:<br />
Interest — 175,861 213,431 389,292<br />
Total expenditures 2,919,473 18,861,863 2,649,377 24,430,713<br />
Excess (deficiency) <strong>of</strong> revenues<br />
over (under) expenditures (2,919,473) (4,008,898) 758,731 (6,169,640)<br />
Other financing sources (uses):<br />
Transfers in 4,315,378 — — 4,315,378<br />
Transfers out — (1,781,887) (1,478,307) (3,260,194)<br />
Line <strong>of</strong> credit proceeds — 15,485,324 — 15,485,324<br />
Total other financing (uses) 4,315,378 13,703,437 (1,478,307) 16,540,508<br />
Net change in fund balances 1,395,905 9,694,539 (719,576) 10,370,868<br />
Fund balances at beginning <strong>of</strong> year 18,012,370 35,697,213 1,458,753 55,168,336<br />
Fund balances at end <strong>of</strong> year $ 19,408,275 45,391,752 739,177 65,539,204<br />
111


