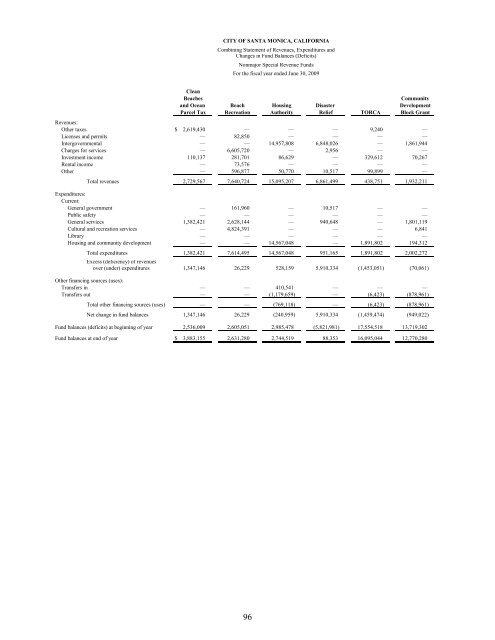
CITY OF SANTA MONICA, CALIFORNIA Combining Statement <strong>of</strong> Revenues, Expenditures and Changes in Fund Balances (Deficits) Nonmajor Special Revenue Funds For the fiscal year ended June 30, 2009 Clean Beaches Community and Ocean Beach Housing Disaster Development Parcel Tax Recreation Authority Relief TORCA Block Grant Revenues: Other taxes $ 2,619,430 — — — 9,240 — Licenses and permits — 82,850 — — — — Intergovernmental — — 14,957,808 6,848,026 — 1,861,944 Charges for services — 6,605,720 — 2,956 — — Investment income 110,137 281,701 86,629 — 329,612 70,267 Rental income — 73,576 — — — — Other — 596,877 50,770 10,517 99,899 — Total revenues 2,729,567 7,640,724 15,095,207 6,861,499 438,751 1,932,211 Expenditures: Current: General government — 161,960 — 10,517 — — Public safety — — — — — — General services 1,382,421 2,628,144 — 940,648 — 1,801,119 Cultural and recreation services — 4,824,391 — — — 6,841 Library — — — — — — Housing and community development — — 14,567,048 — 1,891,802 194,312 Total expenditures 1,382,421 7,614,495 14,567,048 951,165 1,891,802 2,002,272 Excess (deficiency) <strong>of</strong> revenues over (under) expenditures 1,347,146 26,229 528,159 5,910,334 (1,453,051) (70,061) Other financing sources (uses): Transfers in — — 410,541 — — — Transfers out — — (1,179,659) — (6,423) (878,961) Total other financing sources (uses) — — (769,118) — (6,423) (878,961) Net change in fund balances 1,347,146 26,229 (240,959) 5,910,334 (1,459,474) (949,022) Fund balances (deficits) at beginning <strong>of</strong> year 2,536,009 2,605,051 2,985,478 (5,821,981) 17,554,518 13,719,302 Fund balances at end <strong>of</strong> year $ 3,883,155 2,631,280 2,744,519 88,353 16,095,044 12,770,280 96
Total nonmajor Citizens special Miscellaneous Option for Parks and Asset revenue Grants Public Safety Rent Control AQMD Recreation Seizure Gas Tax funds 2,004,603 — — — 14,800 — — 4,648,073 — — — — — — — 82,850 7,420,356 100,000 — 229,791 — 246,096 1,850,822 33,514,843 — — 4,136,088 — — — — 10,744,764 460,330 8,861 129,847 1,763 9,373 12,704 50,714 1,551,938 — — — — — — 5,649 79,225 16,919,729 — 64,818 — — — — 17,742,610 26,805,018 108,861 4,330,753 231,554 24,173 258,800 1,907,185 68,364,303 — — — — — — — 172,477 636,236 104,172 — — — 136,077 — 876,485 5,548,779 — — 153,463 — — 793,642 13,248,216 14,642,052 — — — 30,502 — — 19,503,786 74,860 — — — — — — 74,860 1,183,957 — 4,191,182 — — — — 22,028,301 22,085,884 104,172 4,191,182 153,463 30,502 136,077 793,642 55,904,125 4,719,134 4,689 139,571 78,091 (6,329) 122,723 1,113,543 12,460,178 — — — — — — — 410,541 (2,207,467) — — — — — (1,856,471) (6,128,981) (2,207,467) — — — — — (1,856,471) (5,718,440) 2,511,667 4,689 139,571 78,091 (6,329) 122,723 (742,928) 6,741,738 18,512,612 244,015 1,704,023 183,758 257,532 376,017 1,512,032 56,368,366 21,024,279 248,704 1,843,594 261,849 251,203 498,740 769,104 63,110,104 97
- Page 1:
Comprehensive Annual Financial Repo
- Page 5 and 6:
CITY OF SANTA MONICA, CALIFORNIA Co
- Page 7:
THIS PAGE INTENTIONALLY LEFT BLANK.
- Page 10 and 11:
amount of borrowed property taxes i
- Page 12 and 13:
five-year forecasts, and an underst
- Page 14 and 15:
Cash Management Policies and Practi
- Page 16 and 17:
OFFICIALS OF THE CITY OF SANTA MONI
- Page 18 and 19:
Certificate of Achievement for Exce
- Page 23 and 24:
CITY OF SANTA MONICA, CALIFORNIA Ma
- Page 25 and 26:
CITY OF SANTA MONICA, CALIFORNIA Ma
- Page 27 and 28:
CITY OF SANTA MONICA, CALIFORNIA Ma
- Page 29 and 30:
CITY OF SANTA MONICA, CALIFORNIA Ma
- Page 31 and 32:
CITY OF SANTA MONICA, CALIFORNIA Ma
- Page 33 and 34:
CITY OF SANTA MONICA, CALIFORNIA Ma
- Page 36 and 37:
CITY OF SANTA MONICA, CALIFORNIA St
- Page 38 and 39:
CITY OF SANTA MONICA, CALIFORNIA Ma
- Page 40 and 41:
CITY OF SANTA MONICA, CALIFORNIA St
- Page 42 and 43:
CITY OF SANTA MONICA, CALIFORNIA St
- Page 44 and 45:
CITY OF SANTA MONICA, CALIFORNIA St
- Page 46 and 47:
CITY OF SANTA MONICA, CALIFORNIA St
- Page 48 and 49:
CITY OF SANTA MONICA, CALIFORNIA Pr
- Page 50 and 51:
CITY OF SANTA MONICA, CALIFORNIA St
- Page 52 and 53:
CITY OF SANTA MONICA, CALIFORNIA St
- Page 54 and 55:
CITY OF SANTA MONICA, CALIFORNIA Fi
- Page 56 and 57:
CITY OF SANTA MONICA, CALIFORNIA No
- Page 58 and 59:
CITY OF SANTA MONICA, CALIFORNIA No
- Page 60 and 61:
CITY OF SANTA MONICA, CALIFORNIA No
- Page 62 and 63:
CITY OF SANTA MONICA, CALIFORNIA No
- Page 64 and 65:
CITY OF SANTA MONICA, CALIFORNIA No
- Page 66 and 67:
CITY OF SANTA MONICA, CALIFORNIA No
- Page 68 and 69: CITY OF SANTA MONICA, CALIFORNIA No
- Page 70 and 71: CITY OF SANTA MONICA, CALIFORNIA No
- Page 72 and 73: CITY OF SANTA MONICA, CALIFORNIA No
- Page 74 and 75: CITY OF SANTA MONICA, CALIFORNIA No
- Page 76 and 77: CITY OF SANTA MONICA, CALIFORNIA No
- Page 78 and 79: CITY OF SANTA MONICA, CALIFORNIA No
- Page 80 and 81: CITY OF SANTA MONICA, CALIFORNIA No
- Page 82 and 83: CITY OF SANTA MONICA, CALIFORNIA No
- Page 84 and 85: CITY OF SANTA MONICA, CALIFORNIA No
- Page 86 and 87: CITY OF SANTA MONICA, CALIFORNIA No
- Page 88 and 89: CITY OF SANTA MONICA, CALIFORNIA No
- Page 90 and 91: CITY OF SANTA MONICA, CALIFORNIA No
- Page 92 and 93: CITY OF SANTA MONICA, CALIFORNIA No
- Page 94 and 95: CITY OF SANTA MONICA, CALIFORNIA No
- Page 96 and 97: CITY OF SANTA MONICA, CALIFORNIA No
- Page 98 and 99: CITY OF SANTA MONICA, CALIFORNIA No
- Page 100 and 101: CITY OF SANTA MONICA, CALIFORNIA No
- Page 102 and 103: CITY OF SANTA MONICA, CALIFORNIA No
- Page 104 and 105: CITY OF SANTA MONICA, CALIFORNIA No
- Page 106 and 107: CITY OF SANTA MONICA, CALIFORNIA No
- Page 108 and 109: CITY OF SANTA MONICA, CALIFORNIA No
- Page 110 and 111: City of Santa Monica, California Ye
- Page 112 and 113: CITY OF SANTA MONICA, CALIFORNIA Ca
- Page 114 and 115: CITY OF SANTA MONICA, CALIFORNIA Co
- Page 116 and 117: CITY OF SANTA MONICA, CALIFORNIA Co
- Page 120 and 121: CITY OF SANTA MONICA, CALIFORNIA Sc
- Page 122 and 123: CITY OF SANTA MONICA, CALIFORNIA Sc
- Page 124 and 125: CITY OF SANTA MONICA, CALIFORNIA Sc
- Page 126 and 127: CITY OF SANTA MONICA, CALIFORNIA Sc
- Page 128 and 129: CITY OF SANTA MONICA, CALIFORNIA Sc
- Page 130 and 131: CITY OF SANTA MONICA, CALIFORNIA Sc
- Page 132 and 133: CITY OF SANTA MONICA, CALIFORNIA Co
- Page 134 and 135: CITY OF SANTA MONICA, CALIFORNIA Sc
- Page 136 and 137: CITY OF SANTA MONICA, CALIFORNIA Sc
- Page 138 and 139: CITY OF SANTA MONICA, CALIFORNIA Sc
- Page 140 and 141: CITY OF SANTA MONICA, CALIFORNIA Co
- Page 142 and 143: CITY OF SANTA MONICA, CALIFORNIA Co
- Page 144 and 145: THIS PAGE INTENTIONALLY LEFT BLANK
- Page 146 and 147: CITY OF SANTA MONICA, CALIFORNIA St
- Page 148 and 149: CITY OF SANTA MONICA, CALIFORNIA St
- Page 150 and 151: CITY OF SANTA MONICA, CALIFORNIA St
- Page 152 and 153: CITY OF SANTA MONICA, CALIFORNIA St
- Page 154 and 155: CITY OF SANTA MONICA, CALIFORNIA St
- Page 156 and 157: CITY OF SANTA MONICA, CALIFORNIA Co
- Page 158: THIS PAGE INTENTIONALLY LEFT BLANK
- Page 161 and 162: CITY OF SANTA MONICA, CALIFORNIA Fo
- Page 163 and 164: CITY OF SANTA MONICA, CALIFORNIA Ch
- Page 165 and 166: CITY OF SANTA MONICA, CALIFORNIA Ch
- Page 167 and 168: CITY OF SANTA MONICA, CALIFORNIA Ch
- Page 169 and 170:
CITY OF SANTA MONICA, CALIFORNIA Ge
- Page 171 and 172:
CITY OF SANTA MONICA, CALIFORNIA Di
- Page 173 and 174:
CITY OF SANTA MONICA, CALIFORNIA Pr
- Page 175 and 176:
CITY OF SANTA MONICA, CALIFORNIA Ra
- Page 177 and 178:
CITY OF SANTA MONICA, CALIFORNIA Di
- Page 179 and 180:
CITY OF SANTA MONICA, CALIFORNIA Wa
- Page 181 and 182:
CITY OF SANTA MONICA, CALIFORNIA Re
- Page 183 and 184:
CITY OF SANTA MONICA, CALIFORNIA Pr
- Page 185 and 186:
CITY OF SANTA MONICA, CALIFORNIA Op
- Page 187:
THIS PAGE INTENTIONALLY LEFT BLANK