Distance-scaled, finite ideal-gas reference state ... - Yaoqi Zhou Lab
Distance-scaled, finite ideal-gas reference state ... - Yaoqi Zhou Lab
Distance-scaled, finite ideal-gas reference state ... - Yaoqi Zhou Lab

Create successful ePaper yourself
Turn your PDF publications into a flip-book with our unique Google optimized e-Paper software.
<strong>Distance</strong>-<strong>scaled</strong>, <strong>finite</strong> <strong>ideal</strong>-<strong>gas</strong> <strong>reference</strong> <strong>state</strong><br />
improves structure-derived potentials of mean force for<br />
structure selection and stability prediction<br />
HONGYI ZHOU AND YAOQI ZHOU<br />
Howard Hughes Medical Institute Center for Single Molecule Biophysics, Department of Physiology & Biophysics,<br />
State University of New York at Buffalo, Buffalo, New York 14214, USA<br />
(RECEIVED May 22, 2002; FINAL REVISION July 22, 2002; ACCEPTED August 6, 2002)<br />
Abstract<br />
The distance-dependent structure-derived potentials developed so far all employed a <strong>reference</strong> <strong>state</strong> that can<br />
be characterized as a residue (atom)-averaged <strong>state</strong>. Here, we establish a new <strong>reference</strong> <strong>state</strong> called the<br />
distance-<strong>scaled</strong>, <strong>finite</strong> <strong>ideal</strong>-<strong>gas</strong> <strong>reference</strong> (DFIRE) <strong>state</strong>. The <strong>reference</strong> <strong>state</strong> is used to construct a residuespecific<br />
all-atom potential of mean force from a database of 1011 nonhomologous (less than 30% homology)<br />
protein structures with resolution less than 2 Å. The new all-atom potential recognizes more native proteins<br />
from 32 multiple decoy sets, and raises an average Z-score by 1.4 units more than two previously developed,<br />
residue-specific, all-atom knowledge-based potentials. When only backbone and C atoms are used in<br />
scoring, the performance of the DFIRE-based potential, although is worse than that of the all-atom version,<br />
is comparable to those of the previously developed potentials on the all-atom level. In addition, the<br />
DFIRE-based all-atom potential provides the most accurate prediction of the stabilities of 895 mutants<br />
among three knowledge-based all-atom potentials. Comparison with several physical-based potentials is<br />
made.<br />
Keywords: Knowledge-based potential; decoy sets; <strong>ideal</strong>-<strong>gas</strong> <strong>reference</strong> <strong>state</strong><br />
The solution of the protein folding problem requires an<br />
accurate potential that describes the interactions among different<br />
amino acid residues. The potential that would yield a<br />
complete understanding of the folding phenomena should<br />
be derived from the laws of physics. However, the use of<br />
such physical-based potentials (Brooks et al. 1983; Weiner<br />
et al. 1986; Jorgensen et al. 1996; Scott et al.1999) for ab<br />
initio folding studies is limited by available computing<br />
power (Duan and Kollman 1998). Their applications to the<br />
recognition of native structures from nonnative conformations<br />
(Moult 1997; Hao and Scheraga 1998; Lazaridis and<br />
Karplus 2000; Petrey and Honig 2000; Wallqvist et al.<br />
Reprint requests to: <strong>Yaoqi</strong> <strong>Zhou</strong>, Howard Hughes Medical Institute Center<br />
for Single Molecule Biophysics and Department of Physiology & Biophysics,<br />
State University of New York at Buffalo, 124 Sherman Hall,<br />
Buffalo, NY 14214, USA; e-mail: yqzhou@buffalo.edu; fax: (716) 829-<br />
2344.<br />
Article and publication are at http://www.proteinscience.org/cgi/doi/<br />
10.1110/ps.0217002.<br />
2002), however, yielded results comparable to knowledgebased<br />
statistical potentials that extract interactions directly<br />
from known protein structures (Tanaka and Scheraga 1976).<br />
Knowledge-based statistical potentials are attractive because<br />
they are simple and easy to use. Knowledge-based<br />
potentials can be categorized into distance-independent contact<br />
energies (Miyazawa and Jernigan 1985; DeBolt and<br />
Skolnick 1996; Zhang et al. 1997; Skolnick et al. 2000) and<br />
distance-dependent potentials (Hendlich et al. 1990; Sippl<br />
1990; Jones et al. 1992; Samudrala and Moult 1998; Lu and<br />
Skolnick 2001). Both residue level (Miyazawa and Jernigan<br />
1985; Hendlich et al. 1990; Sippl 1990; Jones et al. 1992)<br />
and atomic level (DeBolt and Skolnick 1996; Zhang et al.<br />
1997; Samudrala and Moult 1998; Lu and Skolnick 2001)<br />
potentials were developed and applied to fold recognition<br />
and assessment (Hendlich et al. 1990; Sippl 1990; Casari<br />
and Sippl 1992; Jones et al. 1992; Bryant and Lawrence<br />
1993; Samudrala and Moult 1998; Miyazawa and Jernigan<br />
1999; Lu and Skolnick 2001; Melo et al. 2002), structure<br />
2714<br />
Protein Science (2002), 11:2714–2726. Published by Cold Spring Harbor <strong>Lab</strong>oratory Press. Copyright © 2002 The Protein Society
Structure selection and stability prediction<br />
predictions (Sun 1993; Simons et al. 1997; Skolnick et al.<br />
1997; Lee et al. 1999; Tobi and Elber 2000; Vendruscolo et<br />
al. 2000; Pillardy et al. 2001), and validations (Luthy et al.<br />
1992; Sippl 1993; MacArthur et al. 1994; Rojnuckarin and<br />
Subramaniam 1999), docking and binding (Pellegrini et al.<br />
1995; Wallqvist et al. 1995; Zhang et al. 1997), and mutation-induced<br />
changes in stability (Gilis and Rooman 1996,<br />
1997; Zhang et al. 1997).<br />
This work focuses on distance-dependent, residue-specific,<br />
all-atom, knowledge-based potentials. This is because<br />
in protein–structure selections, all-atom–based potentials<br />
perform better than residue-based potentials (Samudrala and<br />
Moult 1998; Lu and Skolnick 2001), and distance-dependent<br />
potentials better than distance-independent ones (Melo<br />
et al. 2002). The derivation of a distance-dependent, pairwise,<br />
statistical potential ū(i,j,r) starts from a common equation<br />
given by<br />
ui,j,r =−<br />
RT ln N obsi,j,r<br />
N exp i,j,r<br />
where R is the <strong>gas</strong> constant, T is the temperature, N obs (i,j,r)<br />
is the observed number of atomic pairs (i,j) within a distance<br />
shell r − r/2 to r + r/2 in a database of folded structures,<br />
and N exp (i,j,r) is the expected number of atomic pairs (i,j)in<br />
the same distance shell if there were no interactions between<br />
atoms (the <strong>reference</strong> <strong>state</strong>). Clearly, the method used to<br />
calculate N exp (i,j,r) is what makes one potential<br />
differ from another because the method to calculate<br />
N obs (i,j,r) is the same (except minor differences in database<br />
and bin procedures). Samudrala and Moult (1998) used a<br />
conditional probability function<br />
N exp i,j,r =<br />
(1)<br />
N obs i,j<br />
N total<br />
N obs r, (2)<br />
where N obs (r) ≡∑ i,j N obs (i,j,r), N obs (i,j) ≡∑ r N obs (i,j,r) and<br />
N total ≡∑ i,j,r N obs (i,j,r). Lu and Skolnick (2001) employed a<br />
quasi-chemical approximation:<br />
N exp i,j,r = i j N obs r, (3)<br />
where k is the mole fraction of atom type k. The common<br />
approximation made by the above two potentials is that ∑ i,j<br />
N exp (i,j,r) ≡ N obs (r). This approximation has its origin in the<br />
“uniform density” <strong>reference</strong> <strong>state</strong> used by Sippl (1990) to<br />
derive the residue-based, distance-dependent potential. In<br />
this approximation, the total number of pairs in any given<br />
distance shell for a <strong>reference</strong> <strong>state</strong> is the same as that for<br />
folded proteins. In other words, the distance dependence of<br />
the pair probability distribution of the <strong>reference</strong> <strong>state</strong> is an<br />
averaged distribution over all residue or atomic pairs. This<br />
<strong>reference</strong> <strong>state</strong> is a noninteracting <strong>ideal</strong>-<strong>gas</strong> <strong>reference</strong> <strong>state</strong><br />
only if the average interaction of all residue or atomic pairs<br />
is zero (i.e., attractive and repulsive interactions cancel each<br />
other). However, it is highly unlikely that attractive and<br />
repulsive interactions could cancel each other exactly.<br />
These missing residual interactions may well be important<br />
for an accurate potential.<br />
To explore the missing residual interactions, we establish<br />
a noninteracting <strong>reference</strong> <strong>state</strong> without using the abovementioned<br />
assumption. This is done by using uniformly<br />
distributed noninteracting points in <strong>finite</strong> spheres. The <strong>reference</strong><br />
<strong>state</strong> coupled with a simple distance scaling method<br />
is employed to derive an all-atom potential of mean force<br />
from 1011 known protein structures (Hobohm et al. 1992).<br />
It is shown that the new atomic potential is slightly more<br />
attractive than other knowledge-based all-atom potentials<br />
(Samudrala and Moult 1998; Lu and Skolnick 2001). This<br />
small residual interaction leads to an improved potential of<br />
mean force for structure selections from single and multiple<br />
decoy sets and for the prediction of the changes in the<br />
stabilities of 895 mutants.<br />
Methods<br />
Fundamental equations of statistical mechanics<br />
The observed number of pairs of atoms i and j, N obs (i,j,r),<br />
between spatial distances r − r/2 and r + r/2 is related to<br />
the pair distribution function g ij (r) as follows (Friedman<br />
1985).<br />
N obs i,j,r =<br />
1<br />
V N iN j g ij r4r 2 r, (4)<br />
where V is the volume of the system and N i and N j are the<br />
number of atoms i and j, respectively. Because the atom–<br />
atom potential of mean force, ū(i,j,r), is equal to −RTln g ij (r)<br />
(Friedman 1985), we have<br />
ui,j,r =−<br />
RT ln N obsi,j,rV<br />
N i N j 4r 2 r<br />
When the interaction is turned off (ū(i,j,r) 0), we have<br />
(5)<br />
N exp i,j,r = N obs i,j,r = N i N j 4r 2 rV. (6)<br />
This is a simple expression for an <strong>ideal</strong> mixture of atoms i<br />
and j that have a uniform number of densities of N i /V and<br />
N j /V, respectively.<br />
Finite <strong>ideal</strong>-<strong>gas</strong> <strong>reference</strong> <strong>state</strong><br />
The above equations from liquid-<strong>state</strong> statistical mechanics<br />
cannot be directly applied to proteins. Proteins are <strong>finite</strong><br />
www.proteinscience.org 2715
<strong>Zhou</strong> and <strong>Zhou</strong><br />
systems, and as a result, N exp (i,j,r) will not increase in r 2 as<br />
in an in<strong>finite</strong> system (Equation 6). We remedy this problem<br />
by assuming that N exp (i,j,r) increases in r with a to-bedetermined<br />
constant . Thus, Equation 6 becomes<br />
This leads to (cf. Equation 5)<br />
N exp i,j,r = N i N j 4r rV. (7)<br />
ui,j,r =− RT ln N obsi,j,rV<br />
N i N j 4r r . (8)<br />
Equation 8 can be further simplified by assuming that<br />
ū(i,j,r) is a short-range interaction with a cutoff distance of<br />
r cut . That is, ū(i,j,r ) 0 for r r cut . In this case, Equation<br />
8 can be rewritten in terms of variables at r r cut as below:<br />
ui,j,r =−<br />
N obs i,j,r<br />
RT ln<br />
r <br />
. (9)<br />
r<br />
r cut N<br />
r obs i,j,r cut <br />
cut<br />
Here, a constant factor is placed in front of RT to facilitate<br />
a quantitative comparison with mutation-induced changes in<br />
stability. This factor is needed because temperature is a free<br />
parameter in potentials derived from static structures. Equation<br />
9 implies a new equation for N exp (i,j,r):<br />
N exp i,j,r = rr cut rr cut N obs i,j,r cut . (10)<br />
Unlike early expressions for N exp (i,j,r) (Equations 2 and 3),<br />
this equation does not contain any distance-dependent information<br />
from protein structures but is a natural extension<br />
of the <strong>ideal</strong>-<strong>gas</strong> <strong>reference</strong> <strong>state</strong> (Equation 6) to a <strong>finite</strong> system.<br />
We shall call this <strong>reference</strong> <strong>state</strong> the <strong>Distance</strong>-<strong>scaled</strong>,<br />
Finite Ideal-<strong>gas</strong> REference (DFIRE) <strong>state</strong>. A potential generated<br />
from Equation 9 is called the DFIRE-based potential.<br />
DFIRE-A and DFIRE-B denote the residue-specific allatom–based<br />
and backbone + C atom-based potentials, respectively.<br />
Structural database<br />
The common approximation used in all structure-derived<br />
potentials is that the structures of different proteins are belong<br />
to an ensemble of the thermodynamically equilibrated<br />
structures of one system. We employ a structural database<br />
of 1011 nonhomologous (less than 30% homology)<br />
proteins with resolution
Structure selection and stability prediction<br />
G =<br />
1<br />
2 <br />
i,j,r<br />
ui,j,r (11)<br />
where the summation is over atomic pairs that are not in the<br />
same residue. The native <strong>state</strong> is correctly identified if its<br />
structure has the lowest value of G. Z-score is defined as<br />
(< G >−G native / √ < G 2 >− 2 , where 〈〉 denotes the<br />
average over all decoy structures of a given native protein,<br />
and G native is the total atom–atom potential of mean force of<br />
the native structure. Z-score is a quantitative measure of the<br />
free-energy bias against nonnative conformations.<br />
The predicted free energy change due to mutation is calculated<br />
by G mutant − G native assuming no structural relaxation<br />
after mutations. Only those mutations that have a decreased<br />
number of atoms are used in prediction. This is to<br />
avoid the possible strains associated with small-to-large mutations<br />
(Liu et al. 2000) and the uncertainty about the placement<br />
of extra atoms.<br />
The RAPDF and atomic KBP potentials<br />
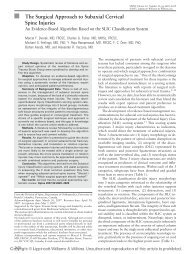
Fig. 1. Scaling behavior of uniformly distributed heavy atoms in 1011<br />
spheres. Number of pairs was counted in every 1 Å shell, and r is the<br />
middle point of the shell. (a) Relative fluctuation , and (b) reduced distance-dependent<br />
function f(r) N(r)/r .<br />
1.57 is applied to any atomic pair. We also assess the new<br />
potential at 1.45 and 1.70 to ensure that 1.57<br />
gives the best performance. The positive outcome (see below)<br />
validates the overall approach used to obtain .<br />
One approximation made in this derivation is that the<br />
contributions of backbone entropy and the structure of denatured<br />
<strong>state</strong> to stability are not included. These terms are<br />
difficult to evaluate, and are not included in other distancedependent<br />
knowledge-based potentials as well.<br />
Structure selections from decoys and<br />
stability prediction<br />
In structure selections from decoy sets, the total atom–atom<br />
potential of mean force, G, is calculated for each decoy<br />
To compare the DFIRE-based potentials with the RAPDF<br />
(Samudrala and Moult 1998) and atomic KBP (Lu and Skolnick<br />
2001) potentials, we regenerate the two potentials using<br />
the procedures described below. For RAPDF<br />
(Samudrala and Moult 1998), the first bin covers 0–3.0 Å,<br />
the distance between 3.0–20 Å is binned every 1 Å. The<br />
total number of bins is 18. All 18 bins with a cutoff distance<br />
of 20 Å are used for scoring. For atomic KBP (Lu and<br />
Skolnick 2001), the distance between 1.5 to 14.5 Å, is<br />
binned every 1 Å and the last bin is from 14.5 Å to in<strong>finite</strong>.<br />
The total number of bins is 14. The first and second sequence<br />
neighbors are excluded while backbone atoms are<br />
included in counting contacts. When used in scoring, only<br />
the bins covering 3.5–6.5 Å are used. In all cases, contacts<br />
between atoms within a single residue are excluded from the<br />
counts and scoring. In case of zero pairs, both potentials are<br />
set to be 2 kcal/mole. The structural database is the 1011<br />
structures described above for the DFIRE-based potentials<br />
rather than 265 proteins used in RAPDF and 1291 proteins<br />
used in atomic KBP in respective original publications. As<br />
we discussed below, the change of the database has little<br />
effect on the overall accuracy of the RAPDF and atomic<br />
KBP potentials.<br />
Results<br />
Single decoy sets<br />
In this paper, both single and multiple decoy sets are used to<br />
assess DFIRE-based potentials. We did not exclude the homologous<br />
proteins to the test decoy sets from the 1011<br />
training database because the exclusion has very little effect<br />
www.proteinscience.org 2717
<strong>Zhou</strong> and <strong>Zhou</strong><br />
on the results. For example, 1ctf is in the training database<br />
and also in many of the decoy sets to test the potential; the<br />
results for 1ctf with a database that includes or excludes 1ctf<br />
are essentially the same. The large database of 1011 proteins<br />
makes the contribution of a single protein to the number of<br />
pairs observed too small to have any bias toward the protein.<br />
The single decoy sets are obtained from the PROSTAR<br />
website, http://prostar.carb.nist.gov/. Results are compiled<br />
in Table 1. For decoy sets misfold (Holm and Sander 1992),<br />
asilomar (Mosimann et al. 1995), pdberr & sgpa (Avbelj et<br />
al. 1990), all three potentials (RAPDF, Atomic KBP, and<br />
DFIRE-A) achieved 100% correct identifications.<br />
The worst performance for all three potentials is in the ifu<br />
decoy set (Pedersen and Moult 1997). DFIRE-A is slightly<br />
better than RAPDF and KBP. It identified 34 out of 44,<br />
compared to 31 for RAPDF and 33 for atomic KBP. The<br />
results of RAPDF and atomic KBP shown here are identical<br />
to the performance of the original RAPDF and atomic KBP<br />
potentials derived from different structural databases (Lu<br />
and Skolnick 2001). The relatively poor performance made<br />
by the knowledge-based potentials in the ifu decoy set is<br />
perhaps because the “independent folding units” are peptide<br />
fragments (between 10–20 residues) that may not be foldable<br />
when isolated (Samudrala and Moult 1998).<br />
Multiple decoy sets<br />
The Park and Levitt 4<strong>state</strong>_reduced decoy set contains<br />
seven proteins and each has 600 to 700 decoys. The set was<br />
built using a 4-<strong>state</strong> off-lattice model (Park and Levitt<br />
1996). RAPDF and atomic KBP correctly identified all<br />
seven proteins (Table 2, A). DFIRE-A identified six out<br />
seven proteins. Although the native <strong>state</strong> of 3icb was ranked<br />
as the fourth lowest energy by DFIRE-A, three lower energy<br />
decoys all have rmsd within 1.7 Å from the 3icb native<br />
structure that has a 2.3 Å resolution. Moreover, the native<br />
structure 4icb, a higher resolution version (1.6 Å) of the<br />
same protein (Svensson et al. 1992), is correctly identified<br />
as the lowest energy by DFIRE-A. In term of the bias<br />
against nonnative structures, DFIRE-A has the highest Z-<br />
score (3.49), followed by atomic KBP (3.24), and RAPDF<br />
(3.01).<br />
DFIRE-A, atomic KBP, and RAPDF are tested using 25<br />
additional multiple decoy sets listed on the website http://<br />
dd.stanford.edu/. It includes fisa (Simons et al. 1997),<br />
fisa_casp3 (Simons et al. 1997), lmds, and lattice_ssfit (Xia<br />
et al. 2000). The fisa (Simons et al. 1997), fisa_casp3 (Simons<br />
et al. 1997), and lmds decoy sets are more challenging<br />
than the 4<strong>state</strong>_reduced and lattice_ssfit decoy sets (Table<br />
2, B–E). The relative performance of RAPDF to that of<br />
atomic KBP is different for different decoy sets. Atomic<br />
KBP performs better in the 4<strong>state</strong>_reduced and lmds decoy<br />
sets, while RAPDF is better in the fisa, fisa_casp3, and<br />
lattice_ssfit sets. Thus, many decoy sets are needed to be<br />
certain about the overall quality of a potential. DFIRE-A is<br />
consistently the best based on the average Z-core and the<br />
number of correctly identified native structures. In summary,<br />
DFIRE-A significantly improves over the previous<br />
potentials in the multiple decoy sets (Table 2). The most<br />
significant improvement is in the average Z-score. The average<br />
Z-score is 4.27 for DFIRE-A, compared to 2.83 for<br />
RAPDF and 2.87 for atomic KBP. Further, it correctly identified<br />
27 native conformations out of 32 decoy sets. The<br />
corresponding number is 22 for RAPDF and 18 for atomic<br />
KBP, respectively. Only five proteins were missed by<br />
DFIRE-A. They are 3icb in 4<strong>state</strong>_reduced, 1fc2 in fisa,<br />
1b0n-B, 1bba, and 1fc2 in lmds. The failure to identify 3icb<br />
is not really a failure, as discussed above. The other four<br />
proteins were missed by all three potentials. For example,<br />
1bba and 1fc2 were all ranked as either the 500th or the<br />
Table 1. Number of correctly identified decoys from single decoy sets by<br />
different potentials<br />
RAPDF a Atomic KBP b DFIRE-A c DFIRE-A 1.45<br />
d<br />
DFIRE-A 1.70<br />
e<br />
DFIRE-B f<br />
Misfold 25/25 g 25/25 25/25 25/25 25/25 23/25<br />
Asilomar h 33/33 33/33 33/33 33/33 33/33 32/33<br />
Pdberr & sgpa 5/5 5/5 5/5 5/5 5/5 5/5<br />
Ifu 31/44 33/44 34/44 32/44 34/44 18/44<br />
a All atom potential from Samudrala and Moult (1998).<br />
b All atom potential from Lu and Skolnick (2001).<br />
c All-atom DFIRE-based potential ( 1.57).<br />
d DFIRE-based potential ( 1.45)<br />
e DFIRE-based potential ( 1.70)<br />
f DFIRE-based potential ( 1.57) for backbone and C atoms.<br />
g The first number and the second number in each cell are the number of correctly identified decoys and<br />
the total number of decoys, respectively.<br />
h As in (Petrey and Honig, 2000), the native structure of protein NDK is replaced by the structure of PDB<br />
code 1nue; the following eight decoys were excluded from the original set because of mismatched<br />
sequences: crabpi_vriend, edn_biosym, edn_weber, mchpr_vihinen, ndk_abagyan, ndk_vihenen,<br />
p450_abagyan, p450_weber.<br />
2718 Protein Science, vol. 11
Structure selection and stability prediction<br />
Table 2. Native rank and Z-score of different potentials using multiple decoy sets<br />
RAPDF Atomic KBP DFIRE-A DFIRE-A 1.45 DFIRE-A 1.70 DFIRE-B<br />
(A) 4<strong>state</strong>-reduced a<br />
1ctf 1/3.26 b 1/3.53 1/3.86 1/3.33 1/4.01 1/3.03<br />
1r69 1/3.49 1/3.76 1/4.23 1/3.76 1/4.10 1/2.95<br />
1sn3 1/3.26 1/3.50 1/3.79 1/3.83 1/3.13 1/3.40<br />
2cro 1/2.93 1/2.91 1/3.29 1/2.97 1/3.24 2/2.74<br />
3icb 1/2.22 1/2.41 4/2.28 c 1/2.15 4/2.29 24/1.68<br />
4pti 1/3.12 1/3.47 1/3.62 1/3.54 1/3.16 1/3.15<br />
4rxn 1/2.79 1/3.12 1/3.33 1/2.78 1/3.42 19/1.88<br />
Z¯ d 3.01 3.24 3.49 3.19 3.34 2.69<br />
(B) fisa e<br />
1fc2 497/−2.74 413/−1.05 254/0.23 406/−0.91 60/1.05 1/2.76<br />
1hdd-C 17/2.00 25/1.78 1/4.50 1/3.77 1/4.45 1/6.76<br />
2cro 14/1.93 24/1.64 1/6.33 1/5.47 1/6.08 1/7.84<br />
4icb 1/3.89 6/2.46 1/6.91 1/6.34 1/6.96 1/8.47<br />
Z¯ d 1.27 1.21 4.49 3.67 4.64 6.46<br />
(C) fisa_casp f<br />
1bg8-A 1/4.39 2/2.84 1/5.35 1/5.13 1/4.92 1/3.82<br />
1bl0 1/3.19 215/0.76 1/4.50 1/4.01 1/4.32 3/2.27<br />
1jwe 1/4.69 4/2.64 1/6.26 1/5.96 1/5.94 1/4.81<br />
Z¯ d 4.09 2.08 5.37 5.03 5.06 3.63<br />
(D) lmds<br />
1b0n-B 359/−0.45 74/1.03 430/−1.17 398/−0.82 438/−1.33 261/0.03<br />
1bba 501/−11.11 500/−3.51 501/−16.28 501/−18.34 501/−11.78 501/−21.38<br />
1fc2 501/−7.75 501/−8.86 501/−5.72 501/−6.32 501/−4.19 441/−1.22<br />
1ctf 1/2.84 1/3.45 1/3.54 1/3.56 1/3.42 1/2.77<br />
1dtk 116/−0.08 31/1.16 1/2.62 62/0.56 1/3.69 5/2.46<br />
1igd 1/4.21 1/4.16 1/5.16 1/5.54 1/4.26 1/4.69<br />
1shf-A 1/5.15 2/2.83 1/6.68 1/6.01 1/6.29 1/5.44<br />
2cro 416/−0.96 175/0.40 1/4.70 109/0.85 1/6.51 1/4.50<br />
2ovo 4/2.76 1/2.86 1/3.21 1/3.27 1/2.92 27/1.48<br />
4pti 157/0.20 13/1.75 1/3.96 5/2.18 1/4.72 1/3.47<br />
Z¯ d −0.52 0.53 0.67 −0.35 1.45 0.22<br />
(E) lattice_ssfit g<br />
lbco 1/9.79 1/9.47 1/12.09 1/10.80 1/7.36 1/7.95<br />
1ctf 1/6.99 1/7.20 1/10.05 1/7.26 1/8.13 1/6.89<br />
1dkt-A 1/6.78 1/6.78 1/6.87 1/6.38 1/4.50 1/4.92<br />
lfca 1/5.57 1/3.36 1/7.18 1/6.13 1/5.26 1/5.30<br />
1nkl 1/8.33 1/8.16 1/9.29 1/7.15 1/7.15 1/5.83<br />
1pgb 1/8.42 1/6.86 1/11.87 1/8.60 1/9.18 1/9.64<br />
1trl-A 1/4.84 1/5.58 1/6.32 1/4.81 1/5.00 1/3.73<br />
4icb 1/6.68 1/5.65 1/7.81 1/6.12 1/7.06 1/4.25<br />
Z¯ d 7.18 6.61 8.94 7.16 6.70 6.06<br />
Summary<br />
# Correct/Total 22/32 18/32 27/32 25/32 27/32 23/32<br />
Z¯ h 2.83 2.87 4.27 3.31 3.91 3.32<br />
a Park and Levitt, 1996.<br />
b The first number in each cell is rank and the second number is the Z-score.<br />
c See text for discussion.<br />
d The average Z-score for the decoy set.<br />
e Simons et al., 1997.<br />
f Simons et al., 1997.<br />
g Xia et al., 2000.<br />
h The average Z-score for all 32 decoy sets.<br />
501st lowest energy. All residue-based statistical potentials<br />
also failed to recognize these four proteins (Tobi and Elber<br />
2000). The reason for this massive failure is not entirely<br />
clear. Perhaps, this is because 1bba is an atypical small<br />
protein without a significant hydrophobic core while the<br />
other three proteins have many missing coordinates (15<br />
residues) in their native structures, and the number of residues<br />
with coordinates is less than 45.<br />
Another multiple decoy set is loops (Moult and James<br />
1986; Fidelis et al. 1994) from http://prostar.carb.nist.gov/.<br />
www.proteinscience.org 2719
<strong>Zhou</strong> and <strong>Zhou</strong><br />
Table 3. The rmsd (Å) of the lowest energy conformation from the loops decoy set (Moult and James 1986; Fidelis et al. 1994)<br />
PDB ID Residue range rmsd range RAPDF Atomic KBP DFIRE-A DFIRE-A 1.45 DFIRE-A 1.70 DFIRE-B<br />
3dfr 20–23 0.75–4.58 0.88 0.88 0.75 1.63 0.75 4.17<br />
3dfr 27–30 0.81–3.47 0.87 1.69 1.69 1.69 1.10 1.27<br />
3dfr 64–67 0.89–4.19 2.32 2.61 1.24 2.41 1.14 1.82<br />
3dfr 120–124 0.57–2.91 0.75 1.28 1.18 0.62 1.18 1.25<br />
3dfr 136–139 1.39–2.15 1.57 1.71 1.54 1.54 1.67 1.66<br />
2sga 35–39 1.20–3.17 1.32 1.22 1.28 1.28 1.28 1.23<br />
2sga 97–101 0.60–3.34 0.79 3.34 0.63 0.63 0.61 1.08<br />
2sga 116–119 0.47–4.91 0.99 1.09 0.99 0.99 1.05 4.28<br />
2sga 132–136 0.97–2.58 1.29 1.56 1.62 1.62 1.42 1.53<br />
2fbj 265–269 0.96–3.90 3.90 3.67 1.03 2.15 1.03 2.15<br />
2hfl 264–268 1.11–2.81 1.46 1.50 1.50 1.50 1.50 1.58<br />
They consist of conformations of short (four or five residues)<br />
loops in protein structures. The challenge is to locate<br />
the low rmsd structure from a large database of a few hundred<br />
to 70 thousand possible conformations. Results are<br />
compiled in Table 3. For DFIRE-A, the rmsds of the lowest<br />
energy structure are all within 1Å from the lowest rmsd of<br />
the decoy. This is better than either RAPDF or atomic KBP.<br />
For example, the rmsd of the lowest energy structure of 3dfr<br />
for the residue range from 64 to 67 is 2.32 Å (2.61 Å) for<br />
RAPDF (atomic KBP), compared to 1.24 Å for DFIRE-A.<br />
Significant improvement of DFIRE-A over RAPDF and<br />
atomic KBP is also observed for selecting the loop structure<br />
in protein 2fbj.<br />
The correlation between the scores and rmsd values of the<br />
decoys is another way to assess knowledge-based potentials.<br />
Of all the multiple decoy sets tested here, we found<br />
that only the 4<strong>state</strong>_reduced and loops sets have significant<br />
correlations between scores and rmsd values. This is because<br />
the secondary structures in these two decoy sets are<br />
mostly unchanged and rmsd values are small while most<br />
decoys in the other sets have large rmsd values. The correlation<br />
coefficients between the scores and rmsd values obtained<br />
from the RAPDF, atomic KBP, and DFIRE-A potentials<br />
are given in Tables 4 and 5 for the 4<strong>state</strong>_reduced and<br />
loops sets, respectively. The three potentials yield comparable<br />
correlations for the 4<strong>state</strong>_reduced set. The average<br />
Table 4. The correlation coefficients between the scores and<br />
the rmsd values for the 4<strong>state</strong>_reduced set<br />
PDB ID RAPDF Atomic KBP DFIRE-A<br />
1ctf 0.73 0.67 0.70<br />
1r69 0.72 0.70 0.68<br />
1sn3 0.47 0.49 0.32<br />
2cro 0.76 0.73 0.75<br />
3icb 0.86 0.83 0.83<br />
4pti 0.52 0.53 0.45<br />
4rxn 0.61 0.59 0.66<br />
Ave. 0.67 0.65 0.63<br />
correlation coefficients are 0.67, 0.65, and 0.63 for the<br />
RAPDF, atomic KBP, and DFIRE-A potentials, respectively.<br />
For the loops decoy set, the DFIRE-A potential<br />
yields the most significant correlation among the three potentials.<br />
The average correlation coefficients are 0.51, 0.41,<br />
and 0.74 for the RAPDF, atomic KBP, DFIRE-A potentials,<br />
respectively. Thus, DFIRE-A is potentially useful for loop<br />
modeling and structural refinement.<br />
Dependence on <br />
For single decoy sets, the performance of DFIRE-A at<br />
1.70 is the same as that of DFIRE-A (at 1.57),<br />
while DFIRE-A at 1.45 identified 32 out of 44 in the<br />
ifu decoy set (Table 1). For multiple decoy sets, other<br />
choices of will lead to a reduction of the average Z-score<br />
at both 1.45 and 1.70 (Table 2). Thus, indeed,<br />
1.57 produces the most accurate potential.<br />
Dependence on atomic detail<br />
For single decoy sets, the performance of the DFIRE-B<br />
potential based on backbone and C atoms is significantly<br />
Table 5. The correlation coefficients between scores and rmsd<br />
values for the loops decoy set<br />
PDB ID<br />
Residue<br />
range rmsd range RAPDF<br />
Atomic<br />
KBP<br />
DFIRE-A<br />
3dfr 20–23 0.75–4.58 0.83 0.60 0.91<br />
3dfr 27–30 0.81–3.47 0.60 0.56 0.71<br />
3dfr 64–67 0.89–4.19 0.48 0.20 0.76<br />
3dfr 120–124 0.57–2.91 0.93 0.84 0.93<br />
3dfr 136–139 1.39–2.15 0.61 0.14 0.66<br />
2sga 35–39 1.20–3.17 0.61 0.72 0.79<br />
2sga 97–101 0.60–3.34 0.83 0.44 0.93<br />
2sga 116–119 0.47–4.91 0.82 0.82 0.75<br />
2sga 132–136 0.97–2.58 0.30 0.08 0.26<br />
2fbj 265–269 0.96–3.90 −0.84 −0.10 0.82<br />
2hfl 264–268 1.11–2.81 0.45 0.23 0.61<br />
Ave. 0.51 0.41 0.74<br />
2720 Protein Science, vol. 11
Structure selection and stability prediction<br />
worse than that of the RAPDF and atomic KBP potentials.<br />
The former did not achieve 100% correct in structure selections<br />
in misfold and asilomar decoy sets, similar to other<br />
residue-based potentials (Samudrala and Moult 1998; Lu<br />
and Skolnick 2001). However, the DFIRE-B potential, performs<br />
slightly better for 32 more-challenging multiple decoys<br />
sets. The average Z-score of the 32 decoy sets is 3.32<br />
for DFIRE-B, compared to 2.83 for RAPDF and 2.87 for<br />
atomic KBP. Thus, the accuracy of the DFIRE-B potential<br />
(with a reduced representation) is comparable to the<br />
RAPDF and atomic KBP potentials with full atomic detail.<br />
Mutation-induced change in stability<br />
Mutation-induced change in stability can be predicted as<br />
described in the Methods section assuming that there is no<br />
structural relaxation after mutation. We use a database of<br />
895 large-to-small mutations defined by a decreased number<br />
of heavy atoms upon mutation (a list is provided in<br />
http://www.smbs.buffalo.edu/phys_bio/paper.html). The<br />
measured changes in stability are compared with predicted<br />
ones in Figure 2. In generating Figures 2a, 2b, and 2c,<br />
different scaling factors are used so that the regression slope<br />
is equal to 1. At T 300 K, 0.025 for RAPDF, 0.026<br />
for atomic KBP, and 0.017 for DFIRE-A. The scaling factor<br />
for DFIRE-A is close to 0.015, the inverse of the coordination<br />
number at r r cut (the number of pairs per atom),<br />
which was the physical quantity used to scale the structurederived<br />
atomic contact energy (Zhang et al. 1997). The<br />
correlation coefficient between experimental measured and<br />
theoretical predicted changes in stability is 0.67 for<br />
DFIRE-A (Fig. 2c). The corresponding coefficients are 0.52<br />
for RAPDF (Fig. 2a) and 0.55 for atomic KBP (Fig. 2b),<br />
respectively. The root-mean-squared deviation between the<br />
experimental data and theoretical predictions is 1.52 kcal/<br />
mole for DFIRE-A, compared to 1.89 kcal/mole for<br />
RAPDF, and 2.11 kcal/mole for atomic KBP. Thus,<br />
DFIRE-A provides the most accurate prediction. One obvious<br />
improvement of the DFIRE-A potential over the other<br />
two potentials is in predicting the strongly stabilizing mutations<br />
(G
<strong>Zhou</strong> and <strong>Zhou</strong><br />
Fig. 3. The distance dependence of three knowledge-based potentials (a)<br />
between atom N of residue Cys and atom O of residue Trp, and (b) between<br />
atom C of residue Ile and atom C 2 of residue Leu.<br />
Fig. 2. The experimentally measured changes in stability versus theoretically<br />
predicted ones in a database of 895 large-to-small mutations. (a)<br />
RAPDF, (b) atomic KBP, (c) DFIRE-A. Lines represent the results from<br />
linear regression fit. The correlation coefficients are 0.52, 0.55, and 0.67<br />
for RAPDF, atomic KBP and DFIRE-A, respectively.<br />
ber of expected pairs of atomic types i and j, N exp (i,j,r), is<br />
uniformly overcounted by 10% for RAPDF or KBP in the<br />
distance range of 4–12 Å. In other words, the RAPDF or<br />
KBP potential can be improved by subtracting − RTln(1/<br />
1.1) ≈ 0.1 RT in this range. Indeed, such a modified<br />
RAPDF increases the average Z-score from 2.83 to 4.11 and<br />
the number of correctly identified proteins from 22 to 27.<br />
Both results are close to or the same as those from the<br />
DFIRE-A potential (4.27 and 27, respectively). The improvement<br />
of the atomic KBP is also visible, although it is<br />
not as significant. The average Z-score increases from 2.87<br />
to 3.14 and the number of correctly identified proteins from<br />
2722 Protein Science, vol. 11
Structure selection and stability prediction<br />
Sippl (1990), Samudrala and Moult (1998), and Lu and<br />
Skolnick (2001) are all based on a <strong>reference</strong> <strong>state</strong> that can be<br />
better characterized as a residue (atom)-averaged <strong>state</strong>. A<br />
residue (atom)-averaged <strong>state</strong> can be approximated as a<br />
noninteracting <strong>ideal</strong>-<strong>gas</strong> <strong>state</strong>, assuming that all interactions<br />
cancel each other during average. Here we employed an<br />
<strong>ideal</strong>-<strong>gas</strong> <strong>state</strong> directly. The new potentials are tested by<br />
using decoys and mutation database. The results show that<br />
the DFIRE-based all-atom potential consistently performs<br />
better than previous all-atom knowledge-based potentials.<br />
The latter’s performance is comparable to that of the<br />
DFIRE-B potential based on backbone and C atoms only.<br />
The most significant improvement is in the average Z-score<br />
of 32 multiple decoy sets. A larger Z-score indicates a stronger<br />
bias against decoys. A large Z-score is a necessary condition<br />
for a potential to be useful in structure prediction (Lu<br />
and Skolnick 2001).<br />
Perhaps, more significantly, the DFIRE-A potential can<br />
provide a reasonably accurate prediction of mutation-induced<br />
change in folding stability. Both stabilizing and destabilizing<br />
mutations are predicted reasonably well (Fig. 2).<br />
This indicates that it is possible to use knowledge-based<br />
potentials to interpret and predict mutation-induced change<br />
in stability as has been demonstrated previously (Gilis and<br />
Rooman 1996, 1997; Zhang et al. 1997). In particular, Gilis<br />
and Rooman (1996, 1997) found that a distance-dependent<br />
potential is less accurate in predicting the change in stability<br />
due to the mutation of solvent exposed residues. Similar<br />
results are found for RAPDF, KBP, and DFIRE-A potentials.<br />
The correlation coefficients between experimentally<br />
measured and theoretical predicted changes in stability upon<br />
the mutations of solvent exposed residues are 0.14, 0.22,<br />
and 0.44 for RAPDF, KBP, and DFIRE-A, respectively.<br />
Fig. 4. The distance dependence of three knowledge-based potentials (a)<br />
between C atoms of Leu and Ile residues, and (b) between C atoms of<br />
Leu and Asp residues.<br />
18 to 20. Because the atomic KBP only uses the 3.5–6.5 Å<br />
window to calculate scores, we also make a double shift of<br />
0.2 RT to account for the 6.5–12Å window. The atomic<br />
KBP is further improved with an average Z-score of 3.32<br />
and 24 identified proteins. Thus, a slightly more attractive<br />
potential in the region of 4–12 Å leads to the superior performance<br />
of the DFIRE-A potential.<br />
Discussion<br />
Comparison with other knowledge-based potentials<br />
In this paper, we used a <strong>finite</strong> <strong>ideal</strong>-<strong>gas</strong> <strong>reference</strong> <strong>state</strong> to<br />
derive knowledge-based potentials. Early methods due to<br />
Fig. 5. The distance dependence of N RAPDF/KBP exp (r)/N DFIRE-A exp (r).<br />
www.proteinscience.org 2723
<strong>Zhou</strong> and <strong>Zhou</strong><br />
These values are significantly smaller than the corresponding<br />
values of 0.53, 0.56, and 0.68 for the mutations of buried<br />
residues. Here, a solvent-exposed residue is defined as a<br />
residue that has more than 40% of its accessible surface area<br />
exposed. There are 293 mutants used in calculations. Recently,<br />
Guerois et al. (2002) used a training database of 339<br />
mutants to optimize the parameters and weighting factors<br />
for a given functional form of interaction potentials. The<br />
correlation coefficient between predicted and experimental<br />
measured changes in stability is 0.73.<br />
Comparison with physical based potentials<br />
The single and multiple decoy sets have also been used to<br />
assess several physical-based potentials. In the misfold decoy<br />
set, the success rates for the CHARMM 19 vacuum<br />
parameter set (Neria et al. 1996), CHARMM 19 with the<br />
effective energy function (CHARMM 19-EEF1) (Lazaridis<br />
and Karplus 1999), vacuum OPLS all-atom force field<br />
(OPLS-AA) (Jorgensen et al. 1996), and OPLS-AA surface<br />
generalized Born solvation model (OPLS-AA/SGB) (Ghosh<br />
et al. 1998; Zhang et al. 2001) are 19/22 (Lazaridis and<br />
Karplus 1998), 21/22 (Lazaridis and Karplus 1998), 24/25<br />
(Wallqvist et al. 2002), and 25/25 (Wallqvist et al. 2002),<br />
respectively. These success rates are comparable to the<br />
success rate of 25/25 for the DFIRE-A potential. In the<br />
4<strong>state</strong>_reduced multiple decoy set, the success rates are 6/6<br />
for CHARMM 19-EEF1, 4/7 for a simplified PEEF (Petrey<br />
and Honig 2000), 4/7 for vacuum OPLS-AA, 7/7 for OPLS-<br />
AA/SGB (Wallqvist et al. 2002), and 7/7 for CHARMM-<br />
GB (Dominy and Brooks 2002), respectively. OPLS-AA/<br />
SGB, CHARMM-GB, and CHARMM19-EEF1 have an average<br />
Z-score of 3.66 for 7 proteins (Wallqvist et al. 2002),<br />
3.38 for 7 proteins (Dominy and Brooks 2002), and 3.27 for<br />
6 proteins (Lazaridis and Karplus 1998), respectively.<br />
RAPDF, atomic KBP, and DFIRE-A have comparable average<br />
Z-scores ranging from 3.01 to 3.49. For the lmds<br />
decoy set, the Z-scores for 1bba, 1fc2, 1ctf, 1igd, 1shf-A,<br />
2cro, 2ovo, and 4pti from OPLS-AA/SGB are −3.29, −0.68,<br />
2.63, 4.06, 3.32, 2.85, and 14.42, respectively (Felts et al.<br />
2002). The corresponding values from DFIRE-A are<br />
−16.28, −5.72, 3.54, 5.16, 4.70, 3.21, and 3.96, respectively.<br />
These two sets of results are comparable. It should be noted<br />
that in physical-based potentials, Z-scores were calculated<br />
from minimized structures. On the other hand, no minimizations<br />
were performed for knowledge-based potentials because<br />
of their discretization.<br />
Cutoff and long-range interactions<br />
One approximation used in DFIRE-based potentials is one<br />
cutoff distance for all atomic pair potentials of mean force.<br />
Potential of mean force, unlike pair interaction potential, is<br />
long-ranged potential due to presence of solvent (Friedman<br />
1985). Here, we choose r cut 14.5 Å because f(r) starts to<br />
systematically deviate from a constant for r >15Å.The<br />
occurrence of the deviation is perhaps because the average<br />
radius of gyration of 1011 proteins is about 20 Å. (That is,<br />
the final <strong>finite</strong>-size effect occurs before the edge of a protein<br />
is reached). It is not clear if a database of large proteins<br />
would allow us to use a longer cutoff distance and whether<br />
or not a longer cutoff would improve the performance of the<br />
DFIRE-based potential, a subject that requires further studies.<br />
The cutoff problem in potential of mean force has been<br />
investigated by a number of other researchers. Samudrala<br />
and Moult (1998) found that a long cutoff of 20 Å improves<br />
the performance of their potential. A 30-Å cutoff is proposed<br />
by Melo et al. (2002) for residue-based potentials. In<br />
contrast, Lu and Skolnick (2001) showed that a short cutoff<br />
(6.5 Å) yields the best performance of their potential.<br />
Thomas and Dill (1996) pointed out that a potential derived<br />
from the Sippl approximation would produce an anomalous<br />
behavior of long-range repulsion between hydrophobic residues<br />
as a result of hydrophobic/polar partitioning. Simons et<br />
al. (1997) corrected this effect by incorporating the environmental<br />
effect of residue pairs. The RAPDF potential<br />
seems to have the problem of a long-range repulsive tail<br />
between hydrophobic residues (Figs. 3 and 4 ). On the other<br />
hand, the atomic KBP appears to have a long-range attractive<br />
tail. The extent of the problem in our potential is not<br />
clear as a result of cutoff. Incorporating the environmental<br />
effect (Simons et al. 1997) into DFIRE-based potentials did<br />
not yield any improvement in the performance of the<br />
DFIRE-based potential. This is done by further dividing<br />
residues into surface and core residues (40 residue types).<br />
The result suggests that hydrophobic/polar partitioning does<br />
not produce any major error in the DFIRE-based potential.<br />
Acknowledgments<br />
We would like to thank Professor Themis Lazaridis for providing<br />
us the CHARMM19-EEF1 data for Z-score calculations and Professor<br />
Hue Sun Chan for helpful discussion. This work was supported<br />
by a grant from HHMI to SUNY Buffalo and by the Center<br />
for Computational Research and the Keck Center for Computational<br />
Biology at SUNY Buffalo.<br />
The publication costs of this article were defrayed in part by<br />
payment of page charges. This article must therefore be hereby<br />
marked “advertisement” in accordance with 18 USC section 1734<br />
solely to indicate this fact.<br />
References<br />
Altuvia, Y., Schueler, O., and Margalit, H. 1995. Ranking potential binding<br />
peptides to MHC molecules by a computational threading approach. J. Mol.<br />
Biol. 249: 244–250.<br />
Avbelj, F., Moult, J., Kitson, D.H., James, M.N., and Hagler, A.T. 1990. Molecular<br />
dynamics study of the structure and dynamics of a protein molecule<br />
in a crystalline ionic environment, Streptomyces griseus protease A. Biochemistry<br />
29: 8658–8676.<br />
2724 Protein Science, vol. 11
Structure selection and stability prediction<br />
Brooks, B.R., Bruccoleri, R.E., Olafson, B.D., States, D.J., Swaminathan, S.,<br />
and Karplus, M. 1983. CHARMM: A program for macromolecular energy,<br />
minimization, and dynamics calculations. J. Comput. Chem. 4: 187–217.<br />
Bryant, S.H. and Lawrence, C.E. 1993. An empirical energy function for threading<br />
protein sequence through the folding motif. Proteins 16: 92–112.<br />
Casari, G. and Sippl, M.J. 1992. Structure-derived hydrophobic potential. Hydrophobic<br />
potential derived from x-ray structures of globular proteins is<br />
able to identify native folds. J. Mol. Biol. 224: 725–732.<br />
De Bolt, S.E. and Skolnick, J. 1996. Evaluation of atomic level mean force<br />
potentials via inverse folding and inverse refinement of protein structures:<br />
Atomic burial position and pairwise non-bonded interactions. Protein Eng.<br />
9: 637–655.<br />
Dominy, B.N. and Brooks III, C.L. 2002. Identifying native-like protein structures<br />
using physics-based potentials. J. Comput. Chem. 23: 147–160.<br />
Duan, Y. and Kollman, P.A. 1998. Pathways to a protein folding intermediate<br />
observed in a 1-microsecond simulation in aqueous solution. Science 282:<br />
740–744.<br />
Felts, A.K., Gallicchio, E., Wallqvist, A., and Levy, R.M. 2002. Distinquishing<br />
native conformations of proteins from decoys with an effective free energy<br />
estimator based on the OPLS all-atom force field and the surface generalized<br />
Born solvent model. Proteins 48: 404–422.<br />
Fidelis, K., Stern, P., Bacon, D., and Moult, J. 1994. Comparison of systematic<br />
search and database methods for constructing segments of protein structure.<br />
Protein Eng. 7: 953–960.<br />
Friedman, H.L. 1985. A course in statistical mechanics. Prentice-Hall, Inc.,<br />
Englewood Cliffs, NJ.<br />
Ghosh, A., Rapp, C.S., and Friesner, R.A. 1998. Generalized Born model based<br />
on a surface integral formulation. J. Phys. Chem. B 102: 10983–10990.<br />
Gilis, D. and Rooman, M. 1996. Stability changes upon mutation of solventaccessible<br />
residues in proteins evaluated by database-derived potentials. J.<br />
Mol. Biol. 257: 1112–1126.<br />
———. 1997. Predicting protein stability changes upon mutation using database-derived<br />
potentials: Solvent accessibility determines the importance of<br />
local versus non-local interactions along the sequence. J. Mol. Biol. 272:<br />
276–290.<br />
Guerois, R., Nielsen, J.E., and Serrano, L. 2002. Predicting changes in the<br />
stability of proteins and protein complexes: A study of more than 1000<br />
mutations. J. Mol. Biol. 302: 369–387.<br />
Hao, M.H. and Scheraga, H.A. 1998. Designing potential energy functions for<br />
protein folding. Curr. Opin. Struct. Biol. 9: 184–188.<br />
Hendlich, M., Lackner, P., Weitckus, S., Floeckner, H., Froschauer, R., Gottsbacher,<br />
K., Casari, G., and Sippl, M.J. 1990. Identification of native protein<br />
folds amongst a large number of incorrect models. The calculation of low<br />
energy conformations from potentials of mean force. J. Mol. Biol. 216:<br />
167–180.<br />
Hobohm, U., Scharf, M., Schneider, R., and Sander, C. 1992. Selection of<br />
representive protein data sets. Protein Sci. 1: 409–417.<br />
Holm, L. and Sander, C. 1992. Fast and simple Monte Carlo algorithm for side<br />
chain optimization in proteins: Application to model building by homology.<br />
Proteins 14: 213–223.<br />
Jones, D.T., Taylor, W.R., and Thornton, J.M. 1992. A new approach to protein<br />
fold recognition. Nature 358: 86–89.<br />
Jorgensen, W.L., Maxwell, D.S., and Tirado-Rives, J. 1996. Development and<br />
testing of the OPLS all-atom force field on conformational energetics and<br />
properties of organic liquids. J. Am. Chem. Soc. 118: 11225–11236.<br />
Lazaridis, T. and Karplus, M. 1998. Discrimination of the native from misfolded<br />
protein models with an energy function including implicit solvation. J. Mol.<br />
Biol. 288: 477–487.<br />
———. 1999. Effective energy function for proteins in solution. Proteins 35:<br />
133–152.<br />
———. 2000. Effective energy function for protein structure prediction. Curr.<br />
Opin. Struct. Biol. 10: 139–145.<br />
Lee, J., Liwo, A., and Scheraga, H.A. 1999. Energy-based de novo protein<br />
folding by conformational space annealing and an off-lattice united-residue<br />
force field: Application to the 10–55 fragment of staphylococcal protein A<br />
and to apo calbindin D9K. Proc. Natl. Acad. Sci. 96: 2025–2030.<br />
Liu, R., Baase, W.A., and Mattthews, B. 2000. The introduction of strain and its<br />
effects on the structure and stability of t4 lysozyme. J. Mol. Biol. 298:<br />
937–953.<br />
Lu, H. and Skolnick, J. 2001. A distance-dependent atomic knowledge-based<br />
potential for improved protein structure selection. Proteins 44: 223–232.<br />
Luthy, R., Bowie, J.U., and Eisenberg, D. 1992. Assessment of protein models<br />
with three-dimensional profiles. Nature 356: 83–85.<br />
MacArthur, M.W., Laskowski, R.A., and Thornton, J.M. 1994. Knowledgebased<br />
validation of protein structure coordinates derived by X-ray crystallography<br />
and NMR spectroscopy. Curr. Opin. Struct. Biol. 4: 731–737.<br />
Melo, F., Sanchez, R., and Sali, A. 2002. Statistical potentials for fold assessment.<br />
Protein Sci. 430: 430–448.<br />
Miyazawa, S., and Jernigan, R.L. 1985. Estimation of effective interresidue<br />
contact energies from protein crystal structures: Quasi-chemical approximation.<br />
Macromolecules 18: 534–552.<br />
Miyazawa, S. and Jernigan, R.L. 1999. An empirical energy potential with a <strong>reference</strong><br />
<strong>state</strong> for protein fold and sequence recognition. Proteins 36: 357–369.<br />
Mosimann, S.R.M. and James, M.N. 1995. A critical assessment of comparative<br />
molecular modeling of tertiary structures of proteins. Proteins 23: 301–317.<br />
Moult, J. 1997. Comparison of database potentials and molecular mechanics<br />
force fields. Curr. Opin. Struct. Biol. 7: 194–199.<br />
Moult, J. and James, M.N.G. 1986. An algorithm for determining the conformation<br />
of polypeptide segments in proteins by systmatic search. Proteins 2:<br />
146–163.<br />
Neria, E., Fischer, S., and Karplus, M. 1996. Simulation of activation free<br />
energies in molecular systems. J. Chem. Phys. 105: 1902–1921.<br />
Park, B. and Levitt, M. 1996. Energy functions that discriminate x-ray and near<br />
native folds from well-constructed decoys. J. Mol. Biol. 258: 367–392.<br />
Pedersen, J.T. and Moult, J. 1997. Protein folding simulations with genetic<br />
algorithms and a detailed molecular description. J. Mol. Biol. 269: 240–259.<br />
Pellegrini, M. and Doniach, S. 1993. Computer simulation of antibody binding<br />
specificity. Proteins 15: 436–444.<br />
Petrey, D. and Honig, B. 2000. Free energy determinants of tertiary structure<br />
and the evaluation of protein models. Protein Sci. 9: 2181–2191.<br />
Pillardy, J., Czaplewski, C., Liwo, A., Lee, J., Ripoll, D.R., Kamierkiewicz, R.,<br />
Oldziej, S., Wedemeyer, W.J., Gibson, K.D., Arnautova, Y.A., Saunders, J.,<br />
Ye, Y.-J., and Scheraga, H.A. 2001. Recent improvements in prediction of<br />
protein structure by global optimization of a potential energy function. Proc.<br />
Natl. Acad. Sci. 98: 2329–2333.<br />
Rojnuckarin, A. and Subramaniam, S. 1999. Knowledge-based interaction potentials<br />
for proteins. Proteins 36: 54–67.<br />
Samudrala, R. and Moult, J. 1998. An all-atom distance-dependent conditional<br />
probability discriminatory function for protein structure prediction. J. Mol.<br />
Biol. 275: 895–916.<br />
Scott, W.R.P., Hunenberger, P.H., Tironi, I.G., Mark, A.E., Billeter, S.R., Fennen,<br />
J., Torda, A.E., Huber, T., Kruger, P., and van Gunsteren, W.F. 1999.<br />
The GROMOS biomolecular simulation program package. J. Phys. Chem. A<br />
103: 3596–3607.<br />
Simons, K.T., Kooperberg, C., Huang, E., and Baker, D. 1997. Assembly of<br />
protein tertiary structures from fragments with similar local sequences using<br />
simulated annealing and Bayesian scoring functions. J. Mol. Biol. 268:<br />
209–225.<br />
Sippl, M.J. 1990. Calculation of conformational ensembles from potentials of<br />
mean force. An approach to the knowledge-based prediction of local structures<br />
in globular proteins. J. Mol. Biol. 213: 859–883.<br />
Sippl, M.J. 1993. Recognition of errors in three-dimensional structures of proteins.<br />
Proteins 17: 355–362.<br />
Skolnick, J., Kolinski, A., and Ortiz, A.R. 1997. M ONSSTER: A method for<br />
folding globular proteins with a small number of distance restraints. J. Mol.<br />
Biol.265: 217–241.<br />
———. 2000. Derivation of protein-specific pair potentials based on weak<br />
sequence fragment similarity. Proteins 38: 3–16.<br />
Sun, S. 1993. Reduced representation model of protein structure prediction:<br />
Statistical potential and genetic algorithms. Protein Sci. 2: 762–785.<br />
Svensson, L.A., Thulin, E., and Forsen, S. 1992. Proline cis-trans isomers in calbindin<br />
D9k observed by X-ray crystallography. J. Mol. Biol. 223: 601–606.<br />
Tanaka, S. and Scheraga, H.A. 1976. Medium- and long-range interaction parameters<br />
between amino acids for predicting three-dimensional structures of<br />
proteins. Macromolecules 9: 945–950.<br />
Thomas, P.D. and Dill, K.A. 1996. Statistical potentials extracted from protein<br />
structures: How accurate are they? J. Mol. Biol. 257: 457–469.<br />
Tobi, D. and Elber, R. 2000. <strong>Distance</strong>-dependent, pair potential for protein<br />
folding: Results from linear optimization. Proteins 41: 40–46.<br />
www.proteinscience.org 2725
<strong>Zhou</strong> and <strong>Zhou</strong><br />
Vendruscolo, M., Mirny, L.A., Shakhnovich, E.I., and Domany, E. 2000. Comparison<br />
of two optimization methods to derive energy parameters for protein<br />
folding: Perceptron and Z score. Proteins 41: 192–201.<br />
Wallqvist, A., Jernigan, R.L., and Covell, D.G. 1995. A p<strong>reference</strong>-based freeenergy<br />
parameterization of enzyme-inhibitor binding. Applications to HIV-<br />
1-protease inhibitor design. Protein Sci. 4: 1881–1903.<br />
Wallqvist, A., Gallicchio, E., Felts, A.K., and Levy, R.M. 2002. Detecting<br />
native protein folds among large decoy sets with the OPLS all-atom potential<br />
and the surface generalized Born solvent model. Adv. Chem. Phys. 120:<br />
459–486.<br />
Weiner, S.J., Kollman, P., Nguyen, D., and Case, D. 1986. An all atom force<br />
field for simulations of proteins and nucleic acids. J. Comput. Chem. 7:<br />
230–252.<br />
Xia, Y., Huang, E.S., Levitt, M., and Samudrala, R. 2000. Ab initio construction<br />
of protein tertiary structures using a hierarchical approach. J. Mol. Biol.<br />
300: 171–185.<br />
Zhang, C., Vasmatzis, G., Cornette, J., and De Lisi, C. 1997. Determination of<br />
atomic desolvation energies from the structures of crystallized proteins. J.<br />
Mol. Biol. 267: 707–726.<br />
Zhang, L.Y., Gallicchio, E., Friesner, R.A., and Levy, R.M. 2001. Solvent<br />
models for protein–ligand binding: Comparison of implicit solvent Poisson<br />
and surface generalized Born models with explicit solvent simulations. J.<br />
Comput. Chem. 22: 591–607.<br />
2726 Protein Science, vol. 11