PDF:454KB - British Geological Survey
PDF:454KB - British Geological Survey
PDF:454KB - British Geological Survey

Create successful ePaper yourself
Turn your PDF publications into a flip-book with our unique Google optimized e-Paper software.
Multi-mode wavepath depth imaging for the SEG/EAGE salt model<br />
Alexander Druzhinin*, <strong>British</strong> <strong>Geological</strong> <strong>Survey</strong> (BGS), Leigh House, Seismic Research Center, Los Alamos<br />
National Laboratory, and Jan Pajchel, Norsk Hydro Research Center<br />
Summary<br />
Elastic multi-mode depth imaging is formulated as a<br />
degraded form of Kirchhoff migration known as Wavepath<br />
Migration (WM). We examine both symmetric and<br />
asymmetric modes. Symmetric SS and asymmetric modes<br />
without local mode conversions are referred to as S-wave<br />
data. Applications to the SEG/EAGE salt model show that<br />
the S-wave WM is sufficiently versatile and relatively<br />
inexpensive. It provides very high quality subsalt images.<br />
Introduction<br />
Prestack depth migration (PreSDM) is widely used for<br />
imaging subsalt prospects. Over the past decade, several<br />
PreSDM techniques have been proposed to improve the<br />
imaging of PP reflections associated with salt overhangs,<br />
base of salt and subsalt horizons. In addition to enhanced<br />
PP images, S-wave data have been demonstrated to be<br />
beneficial to imaging geological structure beneath highvelocity<br />
layers (Purnell, 1992; Bevc et al., 2000; Wu et al.,<br />
2001). Specifically, O'Brien et al. (1999) have shown that<br />
PS-wave images can improve seismic continuity for<br />
delineating salt geometry successfully. In multi-mode<br />
processing, it is common practice to enhance individual<br />
wave modes prior to PreSDM. However, these steps can<br />
give rise to severe migration artifacts due to incomplete<br />
wavefield separation. Moreover, multi-mode PreSDM is<br />
not cost effective because it smears all available trace<br />
samples along isochrones for various wave types. To<br />
balance S-wave image quality against computation cost, we<br />
introduce a multi-mode extension of the WM formula<br />
derived by Sun and Schuster (2001). The method is based<br />
on the stationary phase approximation applied to the elastic<br />
Kirchhoff integral. This leads to the concept of multi-mode<br />
wavepaths whose width corresponds to the size of a Fresnel<br />
zone for the given wave type. Numerical examples are<br />
presented using results of elastic modeling for the<br />
SEG/EAGE salt model (after House et al., 2000).<br />
Method<br />
In PreSDM, we define a grid of image points Q in the depth<br />
domain. Then, using the given interval velocity model, we<br />
compute the ray-trace or finite-difference traveltimes<br />
( µ )<br />
( ν )<br />
τ ( S,<br />
Q)<br />
and τ ( Q,<br />
R)<br />
along the raypaths SQ and QR<br />
for the sources S and receivers R. Here, the superscripts µ<br />
and ν refer to selected wave modes. Assuming that the<br />
observed dataset is decomposed into its dominant<br />
wavefields, conventional PreSDM smears the trace sample<br />
u( S,<br />
R,<br />
t)<br />
over the isochrone surface Ω t described by the<br />
( µν )<br />
equation t = τ ( S,<br />
Q,<br />
R)<br />
for the fixed time value t,<br />
( µν )<br />
where τ ( S,<br />
Q,<br />
R)<br />
is the total traveltime along the<br />
composite Huygens’ raypath SQR given by<br />
( µν )<br />
( µ ) ( ν )<br />
τ ( S, Q,<br />
R)<br />
= τ ( S,<br />
Q)<br />
+ τ ( Q,<br />
R)<br />
(1)<br />
(a)<br />
(b)<br />
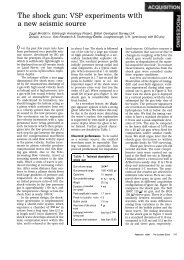
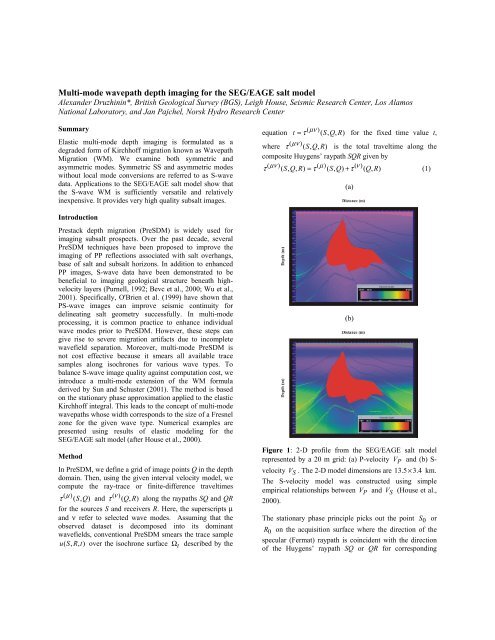
Figure 1: 2-D profile from the SEG/EAGE salt model<br />
represented by a 20 m grid: (a) P-velocity V P and (b) S-<br />
velocity V S . The 2-D model dimensions are 13 . 5× 3. 4 km.<br />
The S-velocity model was constructed using simple<br />
empirical relationships between V P and V S (House et al.,<br />
2000).<br />
The stationary phase principle picks out the point S 0 or<br />
R 0 on the acquisition surface where the direction of the<br />
specular (Fermat) raypath is coincident with the direction<br />
of the Huygens’ raypath SQ or QR for corresponding
Multi-mode wavepath depth imaging<br />
(common-shot or common-receiver) gathers. This principle<br />
also states that the surface Ω t must be tangent to the<br />
depth-migrated reflector at the reflection point Q 0 .<br />
Assuming a sufficiently high source frequency yields the<br />
stationary phase approximation to the multi-mode PreSDM<br />
formula which is referred to as the WM formula. WM<br />
smears a trace’s energy along wavepaths defined by the<br />
condition<br />
( )<br />
( , , ) ( )<br />
τ µν S Q R − τ<br />
µν ( S0<br />
, Q0, R 0 ) < T / 2 , (2)<br />
where T denotes the dominant wave period which limits the<br />
bandwidth of the source spectrum. Since the major<br />
contributions to the migration formula occur at locations<br />
where the phase is stationary, this approximation is<br />
consistent with the elastic migration principle: when the<br />
decoupled downward continuation is carried out to the<br />
point Q at the location of the reflector, the phase of the<br />
reflected P- or S-wave matches that of the direct wave<br />
coming from the point S or R. Therefore, the enhanced<br />
images are formed at these locations through the<br />
simultaneous migration of P- and S-waves. Otherwise, WM<br />
yields a negligible value.<br />
4. Apply the local diffraction stack along wavepaths<br />
according to condition (2).<br />
Dip (f-k or Radon-based) filtering or ray-trace P/S<br />
splitting and multiple removal can be applied during<br />
step 1. To achieve better illumination, upgoing<br />
(a)<br />
(b)<br />
Figure 2: Example of stable upgoing ray tracing after<br />
optimal smoothing of the velocity model in Figure 1.<br />
Raypaths and wavefronts are shown. Optimal smoothing<br />
produces reasonable approximations of traveltimes (1) that<br />
can fill in shadow zones caused by salt irregularities.<br />
Implementation<br />
As with other PreSDM techniques, the WM approach<br />
implicitly assumes that the input interval velocity model is<br />
known. Based on the method proposed, a WM algorithm<br />
can be implemented as follows:<br />
1. Prestack wavefield separation (pre-processing);<br />
2. Calculate traveltimes (1) for all observation and<br />
image points S, R and Q;<br />
3. Based on the stationary phase principle, find a full<br />
set of specular points S0<br />
, R0<br />
and Q0<br />
;<br />
Figure 3: Time-domain exploding reflector models: (a) PP<br />
versus (b) multi-mode time processing. Multiples and local<br />
mode conversions are removed at the pre-processing stage.<br />
ray tracing can be undertaken for each image point (step 2).<br />
A common type of error is associated with the interfacesampling<br />
problem. To control accuracy, ray-trace<br />
traveltimes are compared with those obtained using<br />
existing eikonal solvers in the domains where later arrivals<br />
do not occur. The input data required to solve the eikonal<br />
equation and ray equations are the original and smoothed<br />
velocity models, respectively. According to the exploding<br />
reflector model, reverse-time migration builds a complete<br />
set of points Q 0 along reflectors at depth represented by<br />
the energy snapshot at Ω 0 ( t = 0). Following Sun and
Multi-mode wavepath depth imaging<br />
Schuster (2001), the arrival angle α 0 is determined by<br />
performing a local slant stack over a window of traces<br />
centered at S or R. It is associated with<br />
(a)<br />
Results<br />
The WM algorithm has been implemented on a 16-node<br />
Linux cluster. We have taken a 2-D slice from the<br />
SEG/EAGE salt model (Figure 1). Synthetic elastic wave<br />
seismograms for the model in Figure 1 (House et al., 2000)<br />
and ray-trace illumination studies demonstrate significant<br />
coupling between P and S modes. Traveltimes (1) were<br />
computed by upgoing ray tracing through the smoothed<br />
velocity model (Figure 2). Elastic synthetic data were<br />
processed to enhance strongly polarized wave modes prior<br />
to PreSDM (step 1). Figure 3 shows acoustic (PP) and<br />
elastic (multi-mode) time-domain exploding reflector<br />
sections. These sections represent the best possible stack. It<br />
is obvious that most of subsalt structure cannot be reliably<br />
interpreted on both sections. In Figure 3, it is very difficult<br />
to correlate subsalt reflection events with their counterparts<br />
(a)<br />
(b)<br />
(b)<br />
Figure 4: Conventional (a) PP versus (b) SS acoustic<br />
Kirchhoff PreSDM (offsets 0-3 km) after Radon-type<br />
wavefield separation. SS wave code means that the only<br />
mode conversion occurs at the sea floor. SS-wave image is<br />
very weak because of insufficient reflection point coverage.<br />
the maximum stacking amplitude u within the domain (2).<br />
The stationary phase principle implies that S = S 0 or<br />
R = R 0 if α = α0<br />
, where α specifies the direction of the<br />
ray Q 0 S or Q 0 R . Finally, the amplitude value u is spread<br />
along a portion of the isochrone surface Ω t that surrounds<br />
the specular point Q 0 . This portion is confined by the<br />
Fresnel zone of the reflector given by condition (2).
Multi-mode wavepath depth imaging<br />
(c)<br />
of the trajectories of the arrival ellipses caused by strong<br />
lateral velocity variations. Recall that traveltimes were<br />
computed on coarse grids. Traveltimes on the fine grid<br />
were obtained by B-spline interpolation. To obtain a less<br />
contaminated image of subsalt reflectors, the same dataset<br />
has undergone multi-mode WM imaging tests. It appears<br />
that the base of salt image and the subsalt reflectors are<br />
defined better on Figure 5 than on Figure 4. Comparing our<br />
results with the PP Kirchhoff migration applied to similar<br />
model (Roberts et al., 2001), we conclude that the latter<br />
does not have the same high quality as the present method.<br />
The reason for the improved WM images is three-fold: (1)<br />
accurate wavepath traveltimes can be computed without<br />
grid resampling; (2) WM enhances the contribution of the<br />
specular point and suppresses false contributions far from<br />
that point; (3) This supports the conclusions of Sun and<br />
Schuster (2001).<br />
Conclusions<br />
(d)<br />
The multi-mode WM method combined with robust<br />
wavefield separation techniques is capable to improve<br />
subsalt quality from S-wave data alone. The numerical<br />
algorithm allows elastic migration to be performed<br />
inexpensively on PC-based distributed memory clusters.<br />
Acknowledgments<br />
This work was funded by Norsk Hydro and is published<br />
with the permission of the Executive Director of the BGS<br />
(NERC). We thank Xiang-Yang Li (BGS) for his support<br />
of this study.<br />
References<br />
Figure 5: Multi-mode WM depth images for the model in<br />
Figure 1 after ray-trace wavefield separation: (a) PP, (b)<br />
SP, (c) PS, and (d) SS. For PS-waves, we use the P-wave<br />
velocity to downward continue the wavefield and S-wave<br />
velocity for upward propagation below the sea floor. In SP<br />
imaging, we assume that downgoing S-waves are converted<br />
to P-waves at every image point. Observe that PS WM<br />
produces the best image. This is consistent with the field<br />
data example of O'Brien et al. (1999).<br />
in Figure 1. Ideally, migrating P-wave and S-wave data<br />
with separate velocity models should image reflectors at<br />
their correct depths. Even though Figure 4a gives a clear<br />
view of the salt body, migration artifacts dominate both PP<br />
and SS subsalt images in Figure 4. These artifacts of<br />
acoustic Kirchhoff PreSDM are likely due to errors of<br />
traveltime interpolation and frequency-dependent ellipticity<br />
Bevc, D., Pereyra, V. and Popovici, A., 2000, Subsalt<br />
imaging with converted waves, 70th Ann. Mtg: Soc. of<br />
Expl. Geophys., 469-472.<br />
House, L., Larsen, S. and Bednar, J., 2000, 3-D elastic<br />
numerical modeling of a complex salt structure, 70th Ann.<br />
Mtg: Soc. of Expl. Geophys., 2201-2204.<br />
O'Brien, M., Etgen, J., Murphy, G. and Whitmore, N. D.,<br />
1999, Multicomponent imaging with reciprocal shot<br />
records, 69th Ann. Mtg: Soc. of Expl. Geophys., 784-787.<br />
Purnell, G. W., 1992, Imaging beneath a high-velocity<br />
layer using converted waves: Geophysics, 57, 1444-1452.<br />
Roberts, P., House, L., Huang, L., Wiley, R. and Sekharan,<br />
K., 2001, 3-D imaging of seismic data from a physical<br />
model of a salt structure, 71st Ann. Mtg: Soc. of Expl.<br />
Geophys., 1119-1122.<br />
Sun, H. and Schuster, G.T., 2001, 2-D wavepath migration:<br />
Geophysics, 66, 1528-1537.<br />
Wu, R., Guan, H. and Wu, X., 2001, Imaging steep sub-salt<br />
structures using converted wave paths, 71st Ann. Mtg: Soc.<br />
of Expl. Geophys., 845-848.