PolyOne 2009 Annual Report
PolyOne 2009 Annual Report PolyOne 2009 Annual Report
POLYONE CORPORATION first quarter of 2009, we revised our estimate of goodwill impairment to $175.0 million, of which $147.8 million and $27.2 million related to the Geon Compounds and Specialty Coatings reporting units, respectively. This represented a decrease for Geon Compounds of $7.4 million and an increase in the goodwill impairment charge for Specialty Coatings of $12.4 million, as compared to the preliminary estimates recorded in the fourth quarter of 2008. Income from Equity Affiliates Income from equity affiliates for 2009, 2008 and 2007 is summarized as follows: (In millions) 2009 2008 2007 SunBelt $29.7 $32.5 $ 41.0 Other equity affiliates 2.7 3.4 3.1 Impairment of OxyVinyls investment — — (14.8) Gain on sale and (charges) related to investment in GPA 2.8 (4.7) (1.6) $35.2 $31.2 $ 27.7 During 2009, income from equity affiliates increased $4.0 million, or 12.8%, as compared to 2008. In 2008, we recorded $4.7 million of charges related to our investment in GPA, a 50% owned equity affiliate. In 2009, we sold our investment in GPA, resulting in a pre-tax gain of $2.8 million. Additionally, lower earnings from our SunBelt joint venture for 2009 were due primarily to lower pricing for caustic soda, partially offset by an increase in pricing and volume for chlorine as compared to 2008. During 2008, income from equity affiliates increased $3.5 million, or 12.6%, versus 2007. The increase was due to $11.7 million lower impairment charges recorded in 2008 as compared to 2007, partially offset by lower SunBelt earnings. The $8.5 million lower SunBelt earnings were mainly due to lower demand for chlorine in the downstream PVC resin markets as a result of the significant deterioration of the North American building and construction and basic infrastructure markets. Interest Expense, Net Interest expense, net decreased in 2009 as compared to 2008 due to lower average borrowing levels and lower interest rates on our variable rate debt. Interest expense decreased in 2008 as compared to 2007 due to lower average borrowing levels. Included in interest expense, net for the years ended December 31, 2009, 2008 and 2007 is interest income of $3.2 million, $3.4 million and $4.5 million, respectively. Premium on Early Extinguishment of Long-term Debt Cash expense from the premium on our repurchase of $241.4 million aggregate principal amount of our 10.625% senior notes in 2007 was $12.8 million. Other Expense, Net Financing costs associated with our receivables sale facility, foreign currency gains and losses and other miscellaneous items are as follows: (In millions) 2009 2008 2007 Currency exchange gain (loss) $(0.1) $ 1.2 $(5.0) Foreign exchange contracts (loss) gain (7.9) (1.3) 0.7 Fees and discount on sale of trade receivables (1.3) (3.6) (2.0) Impairment of available for sale security — (0.6) — Other expense, net (0.3) (0.3) (0.3) Other expense, net $(9.6) $(4.6) $(6.6) Income Tax (Expense) Benefit In 2009, we recorded tax benefit of $13.3 million related primarily to tax refunds in both U.S. and foreign jurisdictions. We also decreased our existing deferred tax asset valuation allowances related to various U.S. federal, state and foreign deferred tax assets by $54.6 million in 2009, resulting in a noncash tax benefit of $23.8 million. The remaining decrease of $30.8 million related primarily to changes in our liabilities for pensions and other post-retirement benefits, for which the tax impact is recorded in accumulated other comprehensive income. We review all valuation allowances related to deferred tax assets and will adjust these reserves when appropriate. We have U.S. federal net operating loss carryforwards of $66.0 million which expire at various dates from 2024 through 2028 and combined state net operating loss carryforwards of $314.6 million which expire at various dates from 2010 through 2029. Various foreign subsidiaries have net operating loss carryforwards totaling $34.5 million which expire at various dates from 2010 through 2019. We have provided valuation allowances of $42.9 million against these loss carryforwards. Segment Information Operating income is the primary financial measure that is reported to the chief operating decision maker for purposes of making decisions about allocating resources to the segment and assessing its performance. Operating income at the segment level does not include: corporate general and administrative costs that are not allocated to segments; intersegment sales and profit eliminations; charges related to specific strategic initiatives, such as the consolidation of operations; restructuring activities, including employee separation costs resulting from personnel reduction programs, plant closure and phaseout costs; executive separation agreements; share-based compensation costs; asset and goodwill impairments; environmental remediation costs for facilities no longer owned or closed in prior years; gains and losses on the divestiture of joint ventures and equity investments; and certain other items that are not included in the measure of segment profit or loss that is reported to and reviewed by the chief operating decision maker. These costs are included in Corporate and eliminations. 20
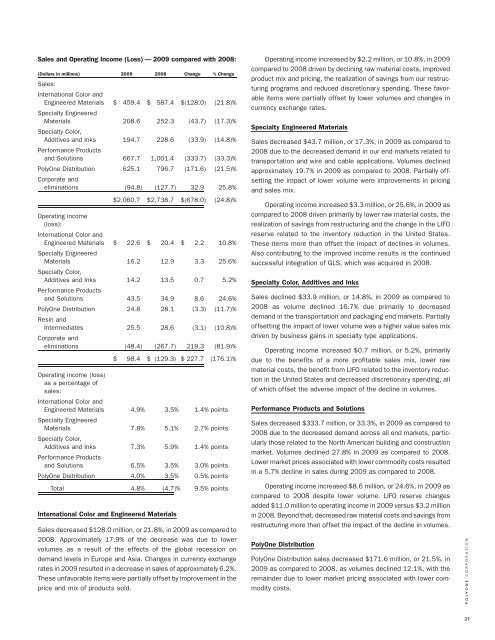
Sales and Operating Income (Loss) — 2009 compared with 2008: (Dollars in millions) 2009 2008 Change % Change Sales: International Color and Engineered Materials $ 459.4 $ 587.4 $(128.0) (21.8)% Specialty Engineered Materials 208.6 252.3 (43.7) (17.3)% Specialty Color, Additives and Inks 194.7 228.6 (33.9) (14.8)% Performance Products and Solutions 667.7 1,001.4 (333.7) (33.3)% PolyOne Distribution 625.1 796.7 (171.6) (21.5)% Corporate and eliminations (94.8) (127.7) 32.9 25.8% $2,060.7 $2,738.7 $(678.0) (24.8)% Operating income (loss): International Color and Engineered Materials $ 22.6 $ 20.4 $ 2.2 10.8% Specialty Engineered Materials 16.2 12.9 3.3 25.6% Specialty Color, Additives and Inks 14.2 13.5 0.7 5.2% Performance Products and Solutions 43.5 34.9 8.6 24.6% PolyOne Distribution 24.8 28.1 (3.3) (11.7)% Resin and Intermediates 25.5 28.6 (3.1) (10.8)% Corporate and eliminations (48.4) (267.7) 219.3 (81.9)% $ 98.4 $ (129.3) $ 227.7 (176.1)% Operating income (loss) as a percentage of sales: International Color and Engineered Materials 4.9% 3.5% 1.4% points Specialty Engineered Materials 7.8% 5.1% 2.7% points Specialty Color, Additives and Inks 7.3% 5.9% 1.4% points Performance Products and Solutions 6.5% 3.5% 3.0% points PolyOne Distribution 4.0% 3.5% 0.5% points Total 4.8% (4.7)% 9.5% points International Color and Engineered Materials Sales decreased $128.0 million, or 21.8%, in 2009 as compared to 2008. Approximately 17.9% of the decrease was due to lower volumes as a result of the effects of the global recession on demand levels in Europe and Asia. Changes in currency exchange rates in 2009 resulted in a decrease in sales of approximately 6.2%. These unfavorable items were partially offset by improvement in the price and mix of products sold. Operating income increased by $2.2 million, or 10.8%, in 2009 compared to 2008 driven by declining raw material costs, improved product mix and pricing, the realization of savings from our restructuring programs and reduced discretionary spending. These favorable items were partially offset by lower volumes and changes in currency exchange rates. Specialty Engineered Materials Sales decreased $43.7 million, or 17.3%, in 2009 as compared to 2008 due to the decreased demand in our end markets related to transportation and wire and cable applications. Volumes declined approximately 19.7% in 2009 as compared to 2008. Partially offsetting the impact of lower volume were improvements in pricing and sales mix. Operating income increased $3.3 million, or 25.6%, in 2009 as compared to 2008 driven primarily by lower raw material costs, the realization of savings from restructuring and the change in the LIFO reserve related to the inventory reduction in the United States. These items more than offset the impact of declines in volumes. Also contributing to the improved income results is the continued successful integration of GLS, which was acquired in 2008. Specialty Color, Additives and Inks Sales declined $33.9 million, or 14.8%, in 2009 as compared to 2008 as volume declined 16.7% due primarily to decreased demand in the transportation and packaging end markets. Partially offsetting the impact of lower volume was a higher value sales mix driven by business gains in specialty type applications. Operating income increased $0.7 million, or 5.2%, primarily due to the benefits of a more profitable sales mix, lower raw material costs, the benefit from LIFO related to the inventory reduction in the United States and decreased discretionary spending, all of which offset the adverse impact of the decline in volumes. Performance Products and Solutions Sales decreased $333.7 million, or 33.3%, in 2009 as compared to 2008 due to the decreased demand across all end markets, particularly those related to the North American building and construction market. Volumes declined 27.8% in 2009 as compared to 2008. Lower market prices associated with lower commodity costs resulted in a 5.7% decline in sales during 2009 as compared to 2008. Operating income increased $8.6 million, or 24.6%, in 2009 as compared to 2008 despite lower volume. LIFO reserve changes added $11.0 million to operating income in 2009 versus $3.2 million in 2008. Beyond that, decreased raw material costs and savings from restructuring more than offset the impact of the decline in volumes. PolyOne Distribution PolyOne Distribution sales decreased $171.6 million, or 21.5%, in 2009 as compared to 2008, as volumes declined 12.1%, with the remainder due to lower market pricing associated with lower commodity costs. POLYONE CORPORATION 21
- Page 1 and 2: 2009 ANNUAL REPORT leaner. stronger
- Page 3 and 4: fortified our strategic focus and t
- Page 5 and 6: The New PolyOne PolyOne launched Le
- Page 7 and 8: United States Securities and Exchan
- Page 9 and 10: manufacturing sites and 11 distribu
- Page 11 and 12: Vinyl is one of the most widely use
- Page 13 and 14: A number of foreign countries and d
- Page 15 and 16: We also conduct investigations and
- Page 17 and 18: and the availability and cost of cr
- Page 19 and 20: Executive officers are elected by o
- Page 21 and 22: PART II ITEM 5. MARKET FOR REGISTRA
- Page 23 and 24: on the opportunity to accelerate de
- Page 25: Results of Operations Variances—F
- Page 29 and 30: Sales and Operating Income (Loss)
- Page 31 and 32: $5.7 million. Additionally, liquidi
- Page 33 and 34: issuing standby letters of credit a
- Page 35 and 36: Description Pension and Other Post-
- Page 37 and 38: Description Share-Based Compensatio
- Page 39 and 40: MANAGEMENT’S REPORT The managemen
- Page 41 and 42: Consolidated Statements of Operatio
- Page 43 and 44: Consolidated Statements of Cash Flo
- Page 45 and 46: Note 1 — DESCRIPTION OF BUSINESS
- Page 47 and 48: As of December 31, 2009, included i
- Page 49 and 50: derivative agreements. This new gui
- Page 51 and 52: OxyVinyls, a former 24% owned affil
- Page 53 and 54: $127.2 million and is included in a
- Page 55 and 56: Change in AOCI: Pension Benefits He
- Page 57 and 58: pricing the asset. Unobservable inp
- Page 59 and 60: 2029. Various foreign subsidiaries
- Page 61 and 62: During 2008, RSUs were granted to e
- Page 63 and 64: partner, Producer Services offers r
- Page 65 and 66: Outstanding stock options with exer
- Page 67 and 68: for approximately $8.9 million. The
- Page 69 and 70: ITEM 12. SECURITY OWNERSHIP OF CERT
- Page 71 and 72: Exhibit No. Exhibit Description 10.
- Page 73 and 74: SIGNATURES Pursuant to the requirem
- Page 75 and 76: Exhibit No. Exhibit Description 10.
Sales and Operating Income (Loss) — <strong>2009</strong> compared with 2008:<br />
(Dollars in millions) <strong>2009</strong> 2008 Change % Change<br />
Sales:<br />
International Color and<br />
Engineered Materials $ 459.4 $ 587.4 $(128.0) (21.8)%<br />
Specialty Engineered<br />
Materials 208.6 252.3 (43.7) (17.3)%<br />
Specialty Color,<br />
Additives and Inks 194.7 228.6 (33.9) (14.8)%<br />
Performance Products<br />
and Solutions 667.7 1,001.4 (333.7) (33.3)%<br />
<strong>PolyOne</strong> Distribution 625.1 796.7 (171.6) (21.5)%<br />
Corporate and<br />
eliminations (94.8) (127.7) 32.9 25.8%<br />
$2,060.7 $2,738.7 $(678.0) (24.8)%<br />
Operating income<br />
(loss):<br />
International Color and<br />
Engineered Materials $ 22.6 $ 20.4 $ 2.2 10.8%<br />
Specialty Engineered<br />
Materials 16.2 12.9 3.3 25.6%<br />
Specialty Color,<br />
Additives and Inks 14.2 13.5 0.7 5.2%<br />
Performance Products<br />
and Solutions 43.5 34.9 8.6 24.6%<br />
<strong>PolyOne</strong> Distribution 24.8 28.1 (3.3) (11.7)%<br />
Resin and<br />
Intermediates 25.5 28.6 (3.1) (10.8)%<br />
Corporate and<br />
eliminations (48.4) (267.7) 219.3 (81.9)%<br />
$ 98.4 $ (129.3) $ 227.7 (176.1)%<br />
Operating income (loss)<br />
as a percentage of<br />
sales:<br />
International Color and<br />
Engineered Materials 4.9% 3.5% 1.4% points<br />
Specialty Engineered<br />
Materials 7.8% 5.1% 2.7% points<br />
Specialty Color,<br />
Additives and Inks 7.3% 5.9% 1.4% points<br />
Performance Products<br />
and Solutions 6.5% 3.5% 3.0% points<br />
<strong>PolyOne</strong> Distribution 4.0% 3.5% 0.5% points<br />
Total 4.8% (4.7)% 9.5% points<br />
International Color and Engineered Materials<br />
Sales decreased $128.0 million, or 21.8%, in <strong>2009</strong> as compared to<br />
2008. Approximately 17.9% of the decrease was due to lower<br />
volumes as a result of the effects of the global recession on<br />
demand levels in Europe and Asia. Changes in currency exchange<br />
rates in <strong>2009</strong> resulted in a decrease in sales of approximately 6.2%.<br />
These unfavorable items were partially offset by improvement in the<br />
price and mix of products sold.<br />
Operating income increased by $2.2 million, or 10.8%, in <strong>2009</strong><br />
compared to 2008 driven by declining raw material costs, improved<br />
product mix and pricing, the realization of savings from our restructuring<br />
programs and reduced discretionary spending. These favorable<br />
items were partially offset by lower volumes and changes in<br />
currency exchange rates.<br />
Specialty Engineered Materials<br />
Sales decreased $43.7 million, or 17.3%, in <strong>2009</strong> as compared to<br />
2008 due to the decreased demand in our end markets related to<br />
transportation and wire and cable applications. Volumes declined<br />
approximately 19.7% in <strong>2009</strong> as compared to 2008. Partially offsetting<br />
the impact of lower volume were improvements in pricing<br />
and sales mix.<br />
Operating income increased $3.3 million, or 25.6%, in <strong>2009</strong> as<br />
compared to 2008 driven primarily by lower raw material costs, the<br />
realization of savings from restructuring and the change in the LIFO<br />
reserve related to the inventory reduction in the United States.<br />
These items more than offset the impact of declines in volumes.<br />
Also contributing to the improved income results is the continued<br />
successful integration of GLS, which was acquired in 2008.<br />
Specialty Color, Additives and Inks<br />
Sales declined $33.9 million, or 14.8%, in <strong>2009</strong> as compared to<br />
2008 as volume declined 16.7% due primarily to decreased<br />
demand in the transportation and packaging end markets. Partially<br />
offsetting the impact of lower volume was a higher value sales mix<br />
driven by business gains in specialty type applications.<br />
Operating income increased $0.7 million, or 5.2%, primarily<br />
due to the benefits of a more profitable sales mix, lower raw<br />
material costs, the benefit from LIFO related to the inventory reduction<br />
in the United States and decreased discretionary spending, all<br />
of which offset the adverse impact of the decline in volumes.<br />
Performance Products and Solutions<br />
Sales decreased $333.7 million, or 33.3%, in <strong>2009</strong> as compared to<br />
2008 due to the decreased demand across all end markets, particularly<br />
those related to the North American building and construction<br />
market. Volumes declined 27.8% in <strong>2009</strong> as compared to 2008.<br />
Lower market prices associated with lower commodity costs resulted<br />
in a 5.7% decline in sales during <strong>2009</strong> as compared to 2008.<br />
Operating income increased $8.6 million, or 24.6%, in <strong>2009</strong> as<br />
compared to 2008 despite lower volume. LIFO reserve changes<br />
added $11.0 million to operating income in <strong>2009</strong> versus $3.2 million<br />
in 2008. Beyond that, decreased raw material costs and savings from<br />
restructuring more than offset the impact of the decline in volumes.<br />
<strong>PolyOne</strong> Distribution<br />
<strong>PolyOne</strong> Distribution sales decreased $171.6 million, or 21.5%, in<br />
<strong>2009</strong> as compared to 2008, as volumes declined 12.1%, with the<br />
remainder due to lower market pricing associated with lower commodity<br />
costs.<br />
POLYONE CORPORATION<br />
21


