PolyOne 2009 Annual Report
PolyOne 2009 Annual Report
PolyOne 2009 Annual Report

Create successful ePaper yourself
Turn your PDF publications into a flip-book with our unique Google optimized e-Paper software.
<strong>2009</strong> ANNUAL REPORT<br />
leaner.<br />
stronger.<br />
poised for growth.
To Our<br />
Shareholders<br />
<strong>PolyOne</strong> is the leanest and strongest we<br />
have ever been. Our confidence, resolve<br />
and focus have reached all-time highs.<br />
We are a more efficient and streamlined organization than<br />
ever before. Taken together, we are approaching our peak<br />
performance and are committed to delivering consistent,<br />
double-digit growth.<br />
Amidst the unprecedented challenges of <strong>2009</strong>—without<br />
clarity on the duration of the economic crisis and uncertain<br />
where demand decline in our end markets would trough<br />
—<strong>PolyOne</strong> reshaped and fortified the Company. We<br />
strengthened our balance sheet, focused on scaling our<br />
organizational size and structure to global demand, and<br />
far surpassed consensus earnings estimates. In trial<br />
after trial, our people flawlessly executed on our strategy,<br />
proving we have both the right team and plan in place.<br />
Given the challenging economic environment, our year-end<br />
results were nothing short of outstanding. Full year earnings<br />
were well beyond analyst estimates and even our own<br />
expectations. With annual sales of $2.1 billion, a 25% yearover-year<br />
decline, we delivered earnings per share before<br />
special items of $0.37. We are very proud of these results<br />
which were just $0.04 shy of 2008 on a comparable basis.<br />
As we enter 2010, our momentum is accelerating and we<br />
are confident in our new stride. With strength built upon the<br />
confidence we gained, the adaptability we demonstrated,<br />
and the results we generated during the most challenging<br />
economic period in our Company’s history, our credibility<br />
is without question. We are poised to consistently deliver<br />
on our commitment to our shareholders. We are the new<br />
<strong>PolyOne</strong> and we have established a new way of creating<br />
value and selling solutions. From our culture of customer<br />
first, to our stronger balance sheet, to our operational<br />
efficiency gains, to new business growth—<strong>PolyOne</strong> is<br />
unmistakably leaner, stronger and poised for growth.<br />
Leaner<br />
We began <strong>2009</strong> with a global restructuring aimed at aligning<br />
our organization with near-term demand, while concurrently<br />
planning for future growth. Our restructuring efforts, which<br />
are saving $60 million annually, were completed ahead of<br />
schedule and below cost estimates, without compromising<br />
the safety of our associates. In fact, our <strong>2009</strong> lost time<br />
incidence rate was 0.8, placing <strong>PolyOne</strong> far ahead of our<br />
industry average of 5.7 and firmly in the elite class of the<br />
world’s safest companies.<br />
Our efficiency improvements were not merely structural—<br />
they were also operational. We realized significant efficiency<br />
gains with the launch of our award-winning global Lean Six<br />
Sigma (LSS) initiative. As evidenced by the size and scope<br />
of the deployment, we are fully committed to optimizing<br />
every aspect of our performance and the service we provide<br />
customers. In fact, our global on-time delivery performance<br />
demonstrated that our customer care remained exemplary.<br />
Stronger<br />
Our balance sheet is another measure of <strong>PolyOne</strong>’s strength.<br />
Prioritizing and driving LSS projects focused on efficiency<br />
improvements contributed to creating the strongest balance<br />
sheet in the history of our Company—we increased cash<br />
from $44 million at the end of 2008 to $223 million at the<br />
end of <strong>2009</strong> and net debt declined $223 million.<br />
Our resolve was further strengthened by delivering<br />
estimate-beating year-end results. This achievement<br />
This is our time. We have prepared for it. We are ready to grow.<br />
We are the new <strong>PolyOne</strong>—a company with limitless potential.
fortified our strategic focus and the inherent discipline in<br />
our culture. Confidence in our value-creating solutions<br />
positions us ahead of those in our industry who employ the<br />
failed strategies of maintaining unprofitable business and<br />
pursuing volume instead of a solid return for shareholders.<br />
We have assembled the best commercial team in our<br />
industry and equipped them with world-class training, tools<br />
and resources. Last year, they persevered—fighting for<br />
new business, concentrating on higher-margin solutions,<br />
leveraging the full spectrum of <strong>PolyOne</strong> solutions and<br />
uncovering new ways to create value for our customers.<br />
Our commercial excellence initiatives will be further<br />
enhanced in 2010 by the numerous customer-centric LSS<br />
projects underway.<br />
Throughout <strong>2009</strong>, we strengthened our Company by<br />
pursuing growth from new sources. Building on our<br />
solutions-oriented approach to selling, <strong>PolyOne</strong> secured<br />
agreements with key suppliers that reinforced our<br />
leadership position in the distribution industry. Foremost<br />
among these agreements was DuPont Engineered<br />
Polymers’ selecting <strong>PolyOne</strong> Distribution as its primary<br />
North American distributor. Additionally, as <strong>2009</strong> drew to a<br />
close, we acquired substantially all of the assets of specialty<br />
healthcare compounder New England Urethane, Inc.<br />
More Agile<br />
Agility requires responsiveness to our customers,<br />
shareholders and employees in a new economic<br />
environment, while steadfastly adhering to our strategy.<br />
Guided by our strategy of specialization, globalization,<br />
and operational and commercial excellence, we have<br />
transformed <strong>PolyOne</strong> into a nimble, focused team that<br />
possesses the collective commitment, determination, and<br />
passion to put customers first and grow our company with<br />
the highest sense of urgency.<br />
The expansion of our Specialty operating income<br />
demonstrates our ability to execute on the strategy. First,<br />
our innovations distinguish <strong>PolyOne</strong> from the competition<br />
by offering specialized solutions that fill unmet needs and<br />
create value for our customers. We have a robust and<br />
growing portfolio of sustainable solutions that address<br />
demand driven by emerging trends such as government<br />
regulations, consumer preference and the rising cost<br />
of non-renewable resources. An additional benefit of<br />
expanding our Specialty platform is our reduced exposure<br />
to the cyclicality of commodity markets and our equity<br />
investments. As an example, healthcare—a target market<br />
for us—has proven more resilient to the economic<br />
downturn than most other markets we traditionally serve.<br />
Our Specialty platform provides flexibility that positions<br />
<strong>PolyOne</strong> to capitalize on changes in economic conditions,<br />
consumer demand and regulatory trends.<br />
To improve our agility and performance, we made a series<br />
of major improvements to our organizational structure,<br />
effective January 1, 2010. By globalizing our Specialty<br />
businesses and sourcing, we will better serve our global<br />
customers, drive execution of our four strategic pillars, and<br />
leverage our strong geographic footprint.<br />
We also have launched a cross selling initiative to take<br />
advantage of the breadth and depth of product offerings<br />
represented by our three strategic platforms and the<br />
number of customer touch points provided by our<br />
Distribution business. Cross selling, combined with our<br />
new global organization, improves our agility and allows<br />
us to more swiftly identify value-added customer solutions<br />
and win new business around the world.<br />
Poised for Growth<br />
Our <strong>2009</strong> profitability was not the result of luck, but of focus,<br />
drive and solid execution. By year-end, <strong>PolyOne</strong> returned<br />
to revenue growth. Now our top priority is to consistently<br />
deliver expanded earnings and double-digit sales growth,<br />
regardless of the economic outlook.<br />
We have reached an inflection point in our transformation.<br />
The extensive and lasting efficiency gains we achieved,<br />
coupled with the proven ability of our management team<br />
to transform <strong>PolyOne</strong> into a specialty company, will propel<br />
our growth. The path before us is clear. Our leadership<br />
team, polymer-formulation expertise, global footprint, and<br />
product portfolio provide the credibility; our determination<br />
to complete our transformation provides the fuel.<br />
This is our time. We have prepared for it. We are ready to grow.<br />
We are the new <strong>PolyOne</strong>—a company with limitless potential.<br />
As always, we appreciate your continued faith and<br />
support in <strong>PolyOne</strong>, and we look forward to our future<br />
with great enthusiasm.<br />
Sincerely,<br />
Stephen D. Newlin<br />
Chairman, President and Chief Executive Officer<br />
March 17, 2010
<strong>PolyOne</strong> Corporation, with annual revenues of $2.1 billion, is a leading global provider of specialized polymer materials,<br />
services and solutions. Headquartered outside Cleveland, Ohio, U.S.A., <strong>PolyOne</strong> has operations around the world.<br />
See www.polyone.com for additional information.<br />
<strong>PolyOne</strong> is executing a transformational strategy<br />
that consists of four core components:<br />
Specialization<br />
differentiates us through value-creating offerings that extend beyond products<br />
to help customers who care about service, technology and problem solving.<br />
Globalization<br />
takes us into high-growth markets where our customers are migrating, and<br />
positions us to serve them with consistency everywhere in the world.<br />
Operational Excellence<br />
empowers us to respond to the voice of the customer with a relentless focus<br />
on continuous improvement in everything we do.<br />
Commercial Excellence<br />
governs our activities in the marketplace, where we deliver value to customers<br />
by showing them how they can increase their profits and grow.<br />
In this annual report, statements that are not reported financial results or other historical information are the “forward-looking statements” within the meaning<br />
of the Private Securities Litigation Reform Act of 1995. Factors that could cause our actual results to differ materially from those implied by forward-looking<br />
statements are described in detail on page 2 of the Form 10-K.
The New <strong>PolyOne</strong><br />
<strong>PolyOne</strong> launched Lean Six Sigma globally in late 2008 and by the end of 2010, more than 25 percent of our 3,900<br />
associates around the world will have completed training, including 1 percent who will hold LSS Black Belt certifications.<br />
In January 2010, <strong>PolyOne</strong> earned the most prestigious process improvement award in the world for our customer centric<br />
Lean Six Sigma deployment. The Process Excellence Award for “Best Start-up Program” was presented during the<br />
International Quality and Productivity Center’s 11th <strong>Annual</strong> Lean Six Sigma and Process Improvement Summit. In the “Best<br />
Start-up” category, a panel of industry experts selected <strong>PolyOne</strong> based on our ability to set organizational direction,<br />
deliver business benefits, and initiate a culture change.<br />
“ To us it is much more than just<br />
an award, it’s a statement<br />
about the new <strong>PolyOne</strong>–<br />
and symbolizes how<br />
we have changed our<br />
corporate culture.<br />
We have made the voice of the<br />
customer the basis for our competitive<br />
differentiation and strategic execution,<br />
and LSS has helped in driving change and<br />
bringing rigor, discipline and accountability<br />
into our organization.”<br />
–Stephen D. Newlin
leaner.<br />
Aided by Lean Six Sigma and our first class of Black Belts,<br />
we created supply chain and inventory efficiencies, without<br />
sacrificing our customer care. For example, we decreased our<br />
average days sales in inventory while maintaining exemplary<br />
on-time delivery performance.<br />
stronger.<br />
By reducing our dependence on traditionally cyclical commodity<br />
end markets and equity investment earnings, we have radically<br />
shifted the earnings profile of our company. Our stated goal is<br />
to derive at least 50 percent of our earnings from the Specialty<br />
platform by 2012.<br />
Days Sales in Inventory<br />
Specialty Operating Income<br />
50%<br />
52<br />
48<br />
43<br />
39<br />
$60<br />
$40<br />
$20<br />
35%<br />
20%<br />
Q1 09 Q2 09 Q3 09 Q4 09<br />
34<br />
2005 2006 2007 2008 <strong>2009</strong><br />
poised for growth.<br />
Specialty Operating Income (in millions)<br />
Percentage of Operating Income*<br />
*Excluding corporate and eliminations<br />
Our two priorities are 1) profitable top-line growth and 2) the continued successful deployment of Lean Six Sigma to reduce costs<br />
and working capital, as well as enhance our customer-facing operations. We expect to grow earnings from each of our three<br />
strategic platforms through increased sales.<br />
POL Stock Price<br />
January–December <strong>2009</strong><br />
$7<br />
$5<br />
$4<br />
$2<br />
J F M A M J J A S O N D
United States<br />
Securities and Exchange Commission<br />
Washington, DC 20549<br />
FORM 10-K<br />
¥ ANNUAL REPORT PURSUANT TO SECTION 13 OR 15(d) OF THE SECURITIES EXCHANGE ACT OF 1934<br />
For the fiscal year ended December 31, <strong>2009</strong><br />
n TRANSITION REPORT PURSUANT TO SECTION 13 OR 15(d) OF THE SECURITIES EXCHANGE ACT OF 1934<br />
For the transition period from to .<br />
Commission file number 1-16091<br />
Polyone Corporation<br />
(Exact name of registrant as specified in its charter)<br />
Ohio 34-1730488<br />
(State or other jurisdiction of<br />
incorporation or organization)<br />
33587 Walker Road,<br />
Avon Lake, Ohio<br />
(Address of principal executive offices)<br />
(IRS Employer Identification No.)<br />
44012<br />
(Zip Code)<br />
Registrant’s telephone number, including area code (440) 930-1000<br />
Securities registered pursuant to Section 12(b) of the Act:<br />
Title of each class<br />
Name of each exchange on which registered<br />
Common Stock, par value $.01 per share<br />
New York Stock Exchange<br />
Securities registered pursuant to Section 12(g) of the Act:<br />
None<br />
Indicate by check mark if the registrant is a well-known seasoned issuer, as defined in Rule 405 of the Securities<br />
Act. Yes n No ¥<br />
Indicate by check mark if the registrant is not required to file reports pursuant to Section 13 or Section 15(d) of the<br />
Act. Yes n No ¥<br />
Indicate by check mark whether the registrant: (1) has filed all reports required to be filed by Section 13 or 15(d) of the<br />
Securities Exchange Act of 1934 during the preceding 12 months (or for such shorter period that the registrant was<br />
required to file such reports), and (2) has been subject to such filing requirements for the past<br />
90 days. Yes ¥ No n<br />
Indicate by check mark if disclosure of delinquent filers pursuant to Item 405 of Regulation S-K is not contained herein,<br />
and will not be contained, to the best of registrant’s knowledge, in definitive proxy or information statements<br />
incorporated by reference in Part III of this Form 10-K or any amendment to this Form 10-K. ¥<br />
Indicate by check mark whether the registrant has submitted electronically and posted on its corporate Web site, if any,<br />
every Interactive Data File required to be submitted and posted pursuant to Rule 405 of Regulation S-T during the<br />
preceding 12 months (or for such shorter period that the registrant was required to submit and post such<br />
files). Yes n No n<br />
Indicate by check mark whether the registrant is a large accelerated filer, an accelerated filer, a non-accelerated filer, or<br />
a smaller reporting company. See the definitions of “large accelerated filer,” “accelerated filer” and “smaller reporting<br />
company” in Rule 12b-2 of the Exchange Act. (Check one):<br />
Large accelerated filer n Accelerated filer ¥ Non-accelerated filer n Smaller reporting company n<br />
(Do not check if a smaller reporting company)<br />
Indicate by check mark whether the registrant is a shell company (as defined in Rule 12b-2 of the Exchange<br />
Act). Yes n No ¥<br />
The aggregate market value of the registrant’s outstanding common stock held by non-affiliates on June 30, <strong>2009</strong>,<br />
determined using a per share closing price on that date of $2.71, as quoted on the New York Stock Exchange, was<br />
$228,620,378.<br />
The number of shares of common stock outstanding as of February 16, 2010 was 92,542,800.<br />
DOCUMENTS INCORPORATED BY REFERENCE<br />
Part III of this <strong>Annual</strong> <strong>Report</strong> on Form 10-K incorporates by reference certain information from the registrant’s definitive<br />
Proxy Statement with respect to the 2010 <strong>Annual</strong> Meeting of Shareholders.<br />
POLYONE CORPORATION
POLYONE CORPORATION<br />
PART I<br />
CAUTIONARY NOTE ON FORWARD-LOOKING STATEMENTS<br />
In this <strong>Annual</strong> <strong>Report</strong> on Form 10-K, statements that are not<br />
reported financial results or other historical information are “forward-looking<br />
statements” within the meaning of the Private Securities<br />
Litigation Reform Act of 1995. Forward-looking statements<br />
give current expectations or forecasts of future events and are not<br />
guarantees of future performance. They are based on management’s<br />
expectations that involve a number of business risks and<br />
uncertainties, any of which could cause actual results to differ<br />
materially from those expressed in or implied by the forward-looking<br />
statements. You can identify these statements by the fact that they<br />
do not relate strictly to historic or current facts. They use words such<br />
as “anticipate,” “estimate,” “expect,” “project,” “intend,” “plan,”<br />
“believe” and other words and terms of similar meaning in connection<br />
with any discussion of future operating or financial performance<br />
and/or sales. In particular, these include statements<br />
relating to future actions; prospective changes in raw material<br />
costs, product pricing or product demand; future performance;<br />
results of current and anticipated market conditions and market<br />
strategies; sales efforts; expenses; the outcome of contingencies<br />
such as legal proceedings; and financial results. Factors that could<br />
cause actual results to differ materially include, but are not limited<br />
to:<br />
• the effect on foreign operations of currency fluctuations,<br />
tariffs and other political, economic and regulatory risks;<br />
• changes in polymer consumption growth rates where we<br />
conduct business;<br />
• changes in global industry capacity or in the rate at which<br />
anticipated changes in industry capacity come online in the<br />
polyvinyl chloride (PVC), chlor alkali, vinyl chloride monomer<br />
(VCM) or other industries in which we participate;<br />
• fluctuations in raw material prices, quality and supply and in<br />
energy prices and supply;<br />
• production outages or material costs associated with scheduled<br />
or unscheduled maintenance programs;<br />
• unanticipated developments that could occur with respect to<br />
contingencies such as litigation and environmental matters,<br />
including any developments that would require any increase<br />
in our costs and/or reserves for such contingencies;<br />
• an inability to achieve or delays in achieving or achievement<br />
of less than the anticipated financial benefit from initiatives<br />
related to our specialization strategy, operational excellence<br />
initiatives, cost reductions and employee productivity goals;<br />
• an inability to raise or sustain prices for products or services;<br />
• an inability to maintain appropriate relations with unions and<br />
employees;<br />
• the possibility of further degradation in the North American<br />
building and construction market;<br />
• amounts for non-cash charges relating to property, plant and<br />
equipment that differ from the original estimates because of<br />
the ultimate fair market value of such property, plant and<br />
equipment;<br />
• amounts required for capital expenditures at remaining locations<br />
changing based on the level of expenditures required to<br />
shift production capacity;<br />
• our ability to continue to realize anticipated savings and<br />
operational benefits from our realigning of assets, including<br />
those related to closure of certain production facilities;<br />
• disruptions, uncertainty or volatility in the credit markets<br />
that may limit our access to capital;<br />
• other factors affecting our business beyond our control,<br />
including, without limitation, changes in the general economy,<br />
changes in interest rates and changes in the rate of<br />
inflation; and<br />
• other factors described in this <strong>Annual</strong> <strong>Report</strong> on Form 10-K<br />
under Item 1A, “Risk Factors.”<br />
We cannot guarantee that any forward-looking statement will<br />
be realized, although we believe we have been prudent in our plans<br />
and assumptions. Achievement of future results is subject to risks,<br />
uncertainties and inaccurate assumptions. Should known or<br />
unknown risks or uncertainties materialize, or should underlying<br />
assumptions prove inaccurate, actual results could vary materially<br />
from those anticipated, estimated or projected. Investors should<br />
bear this in mind as they consider forward-looking statements. We<br />
undertake no obligation to publicly update forward-looking statements,<br />
whether as a result of new information, future events or<br />
otherwise, except as otherwise required by law. You are advised,<br />
however, to consult any further disclosures we make on related<br />
subjects in our reports on Forms 10-Q, 8-K and 10-K furnished to<br />
the SEC. You should understand that it is not possible to predict or<br />
identify all risk factors. Consequently, you should not consider any<br />
such list to be a complete set of all potential risks or uncertainties.<br />
ITEM 1. BUSINESS<br />
Business Overview<br />
We are a premier provider of specialized polymer materials, services<br />
and solutions with operations in thermoplastic compounds,<br />
specialty polymer formulations, color and additive systems, thermoplastic<br />
resin distribution and specialty PVC resins. We also have<br />
two equity investments: SunBelt Chlor-Alkali Partnership, a manufacturer<br />
of caustic soda and chlorine and BayOne Urethane Systems,<br />
L.L.C., a formulator of polyurethane compounds. When used<br />
in this <strong>Annual</strong> <strong>Report</strong> on Form 10-K, the terms “we,” “us,” “our” and<br />
the “Company” mean <strong>PolyOne</strong> Corporation and its subsidiaries.<br />
We are incorporated in Ohio and our headquarters are in Avon<br />
Lake, Ohio. We employ approximately 3,900 people and have 47<br />
2
manufacturing sites and 11 distribution facilities in North America,<br />
Europe and Asia, and joint ventures in North America. We offer more<br />
than 35,000 polymer solutions to over 10,000 customers across<br />
the globe. In <strong>2009</strong>, we had sales of $2.1 billion, 37% of which were<br />
to customers outside the United States.<br />
We provide value to our customers through our ability to link our<br />
knowledge of polymers and formulation technology with our manufacturing<br />
and supply chain processes to provide an essential link<br />
between large chemical producers (our raw material suppliers) and<br />
designers, assemblers and processors of plastics (our customers).<br />
We believe that large chemical producers are increasingly outsourcing<br />
less-than-railcar business; polymer and additive producers need<br />
multiple channels to market; processors continue to outsource<br />
compounding; and international companies need suppliers with<br />
global reach. Our goal is to provide our customers with specialized<br />
material and service solutions through our global reach, product<br />
platforms, low-cost manufacturing operations, a fully integrated<br />
information technology network, broad market knowledge and raw<br />
material procurement leverage. Our end markets are primarily in the<br />
building and construction materials, wire and cable, transportation,<br />
durable goods, packaging, electrical and electronics, medical and<br />
telecommunications markets, as well as many industrial<br />
applications.<br />
<strong>PolyOne</strong> was formed on August 31, 2000 from the consolidation<br />
of The Geon Company (Geon) and M.A. Hanna (Hanna). Geon’s<br />
roots date back to 1927 when BFGoodrich scientist Waldo Semon<br />
produced the first usable vinyl polymer. In 1948, BFGoodrich created<br />
a vinyl plastic division that was subsequently spun off through<br />
a public offering in 1993, creating Geon, a separate publicly-held<br />
company. Hanna was formed in 1885 as a privately-held company<br />
and became publicly-held in 1927. In the mid-1980s, Hanna began<br />
to divest its historic mining and shipping businesses to focus on<br />
polymers. Hanna purchased its first polymer company in 1986 and<br />
completed its 26th polymer company acquisition in 2000.<br />
Polymer Industry Overview<br />
Polymers are a class of organic materials that are generally<br />
produced by converting natural gas or crude oil derivatives into<br />
monomers, such as ethylene, propylene, vinyl chloride and styrene.<br />
These monomers are then polymerized into chains called polymers,<br />
or plastic resin, in its most basic form. Large petrochemical companies,<br />
including some in the petroleum industry, produce a majority<br />
of the monomers and base resins because they have direct<br />
access to the raw materials needed for production. Monomers<br />
make up the majority of the variable cost of manufacturing the base<br />
resin. As a result, the cost of a base resin tends to move in tandem<br />
with the industry market prices for monomers and the cost of raw<br />
materials and energy used during production. Resin selling prices<br />
can move in tandem with costs, but are largely driven by supply and<br />
demand balances. Through our equity interest in SunBelt Chlor-<br />
Alkali Partnership (SunBelt), we realize a portion of the economic<br />
benefits of a base resin producer for PVC resin, one of our major raw<br />
materials.<br />
Thermoplastic polymers make up a substantial majority of the<br />
resin market and are characterized by their ability to be reshaped<br />
repeatedly into new forms after heat and pressure are applied.<br />
Thermoplastics offer versatility and a wide range of applications.<br />
The major types of thermoplastics include polyethylene, polyvinyl<br />
chloride, polypropylene, polystyrene, polyester and a range of specialized<br />
engineering resins. Each type of thermoplastic has unique<br />
qualities and characteristics that make it appropriate for use in a<br />
particular product.<br />
Thermoplastic resins are found in a number of end-use products<br />
and in a variety of markets, including packaging, building and<br />
construction, wire and cable, transportation, medical, furniture and<br />
furnishings, durable goods, institutional products, electrical and<br />
electronics, adhesives, inks and coatings. Each type of thermoplastic<br />
resin has unique characteristics (such as flexibility, strength or<br />
durability) suitable for use in a particular end-use application. The<br />
packaging industry, the largest consumer of plastics, requires<br />
plastics that help keep food fresh and free of contamination while<br />
providing a variety of options for product display, and offering<br />
advantages in terms of weight and user-friendliness. In the building<br />
and construction industry, plastic provides an economical and<br />
energy efficient replacement for other traditional materials in piping<br />
applications, siding, flooring, insulation, windows and doors, as well<br />
as structural and interior or decorative uses. In the wire and cable<br />
industry, thermoplastics serve to protect by providing electrical<br />
insulation, flame resistance, durability, water resistance, and color<br />
coding to wire coatings and connectors. In the transportation industry,<br />
plastic has proved to be durable, lightweight and corrosion<br />
resistant while offering fuel savings, design flexibility and high<br />
performance. In the medical industry, plastics help save lives by<br />
safely providing a range of transparent and opaque thermoplastics<br />
that are used for a vast array of devices including blood and intravenous<br />
bags, medical tubing, masks, lead replacement for radiation<br />
shielding, clamps and connectors to bed frames, curtains and<br />
sheeting, and electronic enclosures. In the electronics industry,<br />
plastic enclosures and connectors not only enhance safety through<br />
electrical insulation, but thermally and electrically conductive plastics<br />
provide heat transferring, cooling, antistatic, electrostatic discharge,<br />
and electromagnetic shielding performance for critical<br />
applications including integrated circuit chip packaging.<br />
Various additives can be combined with a base resin to provide<br />
it with greater versatility and performance. These combinations are<br />
known as plastic compounds. Plastic compounds have advantages<br />
over metals, wood, rubber and other traditional materials, which<br />
have resulted in the replacement of these materials across a wide<br />
spectrum of applications that range from automobile parts to construction<br />
materials. Plastic compounds offer advantages compared<br />
to traditional materials that include processability, weight reduction,<br />
chemical resistance, flame retardance and lower cost. Plastics<br />
have a reputation for durability, aesthetics, ease of handling and<br />
recyclability.<br />
POLYONE CORPORATION<br />
3
POLYONE CORPORATION<br />
<strong>PolyOne</strong> Segments<br />
We operate in six reportable segments: International Color and<br />
Engineered Materials; Specialty Engineered Materials; Specialty<br />
Color, Additives and Inks; Performance Products and Solutions;<br />
<strong>PolyOne</strong> Distribution; and Resin and Intermediates. Our segments<br />
are further discussed in Note 16, Segment Information, tothe<br />
accompanying consolidated financial statements.<br />
International Color and Engineered Materials<br />
The International Color and Engineered Materials operating segment<br />
combines the strong regional heritage of our color and additive<br />
masterbatches and engineered materials operations to create global<br />
capabilities with plants, sales and service facilities located<br />
throughout Europe and Asia.<br />
Working in conjunction with our Specialty Color, Additives and<br />
Inks and North American Engineered Materials operating segments,<br />
we provide solutions that meet our international customers’<br />
demands for both global and local manufacturing, service and<br />
technical support.<br />
Specialty Engineered Materials<br />
The Specialty Engineered Materials operating segment is a leading<br />
provider of custom plastic compounding services and solutions for<br />
processors of thermoplastic materials across a wide variety of<br />
markets and end-use applications including those that currently<br />
employ traditional materials such as metal. Specialty Engineered<br />
Materials’ product portfolio, one of the broadest in our industry,<br />
includes standard and custom formulated high-performance polymer<br />
compounds that are manufactured using a full range of thermoplastic<br />
compounds and elastomers, which are then combined<br />
with advanced polymer additive, reinforcement, filler, colorant<br />
and/or biomaterial technologies.<br />
With a depth of compounding expertise, we are able to expand<br />
the performance range and structural properties of traditional<br />
engineering-grade thermoplastic resins that meet our customers’<br />
unique performance requirements. Our product development and<br />
application reach is further enhanced by the capabilities of our<br />
North American Engineered Materials Solutions Center, which produces<br />
and evaluates prototype and sample parts to help assess<br />
end-use performance and guide product development. Our manufacturing<br />
capabilities are targeted at meeting our customers’<br />
demand for speed, flexibility and critical quality.<br />
This segment also includes GLS Corporation (GLS), which we<br />
acquired in January 2008. GLS is a global developer of innovative<br />
thermoplastic elastomer (TPE) compounds and offers the broadest<br />
range of soft-touch TPE materials in the industry.<br />
Specialty Color, Additives and Inks<br />
The Specialty Color, Additives and Inks operating segment is a<br />
leading provider of specialized color and additive concentrates as<br />
well as inks and latexes.<br />
Color and additive products include an innovative array of<br />
colors, special effects and performance-enhancing and eco-friendly<br />
solutions. Our color masterbatches contain a high concentration of<br />
color pigments and/or additives that are dispersed in a polymer<br />
carrier medium and are sold in pellet, liquid, flake or powder form.<br />
When combined with non pre-colored base resins, our colorants<br />
help our customers achieve a wide array of specialized colors and<br />
effects that are targeted at the demands of today’s highly designoriented<br />
consumer and industrial end markets. Our additive masterbatches<br />
encompass a wide variety of performance enhancing characteristics<br />
and are commonly categorized by the function that they<br />
perform, such as UV stabilization, anti-static, chemical blowing,<br />
antioxidant and lubricant, and processing enhancement.<br />
Our colorant and additives masterbatches are used in most<br />
plastics manufacturing processes, including injection molding,<br />
extrusion, sheet, film, rotational molding and blow molding throughout<br />
the plastics industry, particularly in the packaging, transportation,<br />
consumer, outdoor decking, pipe and wire and cable markets.<br />
They are also incorporated into such end-use products as stadium<br />
seating, toys, housewares, vinyl siding, pipe, food packaging and<br />
medical packaging.<br />
This segment also provides custom-formulated liquid systems<br />
that meet a variety of customer needs and chemistries, including<br />
vinyl, natural rubber and latex, polyurethane and silicone. Products<br />
include proprietary fabric screen-printing inks and latexes for diversified<br />
markets that range from recreational and athletic apparel,<br />
construction and filtration to outdoor furniture and healthcare. In<br />
addition, we have a 50% interest in BayOne, a joint venture between<br />
<strong>PolyOne</strong> and Bayer Corporation, which sells liquid polyurethane<br />
systems into many of the same markets.<br />
Performance Products and Solutions<br />
The Performance Products and Solutions operating segment is a<br />
global leader offering an array of products and services for vinyl<br />
coating, molding and extrusion processors. Our product offerings<br />
include: rigid, flexible and dry blend vinyl compounds; industryleading<br />
dispersion, blending and specialty suspension grade vinyl<br />
resins; and specialty coating materials based largely on vinyl. These<br />
products are sold to a wide variety of manufacturers of plastic parts<br />
and consumer-oriented products. We also offer a wide range of<br />
services to the customer base utilizing these products to meet the<br />
ever changing needs of our multi-market customer base. These<br />
services include materials testing and component analysis, custom<br />
compound development, colorant and additive services, design<br />
assistance, structural analyses, process simulations and extruder<br />
screw design.<br />
Much of the revenue and income for Performance Products and<br />
Solutions is generated in North America. However, sales in Asia and<br />
Europe constitute a minor but growing portion of this segment. In<br />
addition, we owned 50% of a joint venture producing and marketing<br />
vinyl compounds in Latin America through the disposition date of<br />
October 13, <strong>2009</strong>.<br />
4
Vinyl is one of the most widely used plastics, utilized in a wide<br />
range of applications in building and construction, wire and cable,<br />
consumer and recreation markets, transportation, packaging and<br />
healthcare. Vinyl resin can be combined with a broad range of<br />
additives, resulting in performance versatility, particularly when fire<br />
resistance, chemical resistance or weatherability is required. We<br />
believe we are well-positioned to meet the stringent quality, service<br />
and innovation requirements of this diverse and highly competitive<br />
marketplace.<br />
This operating segment also includes Producer Services, which<br />
offers custom compounding services to resin producers and processors<br />
that design and develop their own compound and masterbatch<br />
recipes. Customers often require high quality, cost effective<br />
and confidential services. As a strategic and integrated supply chain<br />
partner, Producer Services offers resin producers a way to develop<br />
custom products for niche markets by using our compounding<br />
expertise and multiple manufacturing platforms.<br />
<strong>PolyOne</strong> Distribution<br />
The <strong>PolyOne</strong> Distribution operating segment distributes more than<br />
3,500 grades of engineering and commodity grade resins, including<br />
<strong>PolyOne</strong>-produced compounds, to the North American market.<br />
These products are sold to over 5,000 custom injection molders<br />
and extruders who, in turn, convert them into plastic parts that are<br />
sold to end-users in a wide range of industries. Representing over<br />
20 major suppliers, we offer our customers a broad product portfolio,<br />
just-in-time delivery from multiple stocking locations and local<br />
technical support.<br />
Resin and Intermediates<br />
We report the results of our Resin and Intermediates operating<br />
segment on the equity method. This segment consists almost<br />
entirely of our 50% equity interest in SunBelt and our former<br />
24% equity interest in OxyVinyls LP (OxyVinyls), through its disposition<br />
date of July 6, 2007. SunBelt, a producer of chlorine and<br />
caustic soda, is a partnership with Olin Corporation. OxyVinyls, a<br />
producer of PVC resins, VCM and chlorine and caustic soda, was a<br />
partnership with Occidental Chemical Corporation. In <strong>2009</strong>, Sun-<br />
Belt had production capacity of approximately 320 thousand tons of<br />
chlorine and 358 thousand tons of caustic soda. Most of the<br />
chlorine manufactured by SunBelt is consumed by OxyVinyls to<br />
produce PVC resin. Caustic soda is sold on the merchant market<br />
to customers in the pulp and paper, chemical, building and construction<br />
and consumer products industries.<br />
Competition<br />
The production of compounded plastics and the manufacture of<br />
custom and proprietary formulated color and additives systems for<br />
the plastics industry are highly competitive. Competition is based<br />
on service, performance, product innovation, product recognition,<br />
speed, delivery, quality and price. The relative importance of these<br />
factors varies among our products and services. We believe that we<br />
are the largest independent compounder of plastics and producer of<br />
custom and proprietary formulated color and additive masterbatch<br />
systems in the United States and Europe, with a growing presence<br />
in Asia. Our competitors range from large international companies<br />
with broad product offerings to local independent custom compounders<br />
whose focus is a specific market niche or product<br />
offering.<br />
The distribution of polymer resin is also highly competitive.<br />
Speed, service, reputation, product line, brand recognition, delivery,<br />
quality and price are the principal factors affecting competition.<br />
We compete against other national independent resin distributors<br />
in North America, along with other regional distributors. Growth in<br />
the thermoplastic resin and compound distribution market is<br />
directly correlated with growth in the base polymer resins market.<br />
We believe that the strength of our company name and reputation,<br />
the broad range of product offerings from our suppliers and<br />
our speed and responsiveness, coupled with the quality of products<br />
and flexibility of our distribution network, allow us to compete<br />
effectively.<br />
Raw Materials<br />
The primary raw materials used by our manufacturing operations<br />
are PVC resin, VCM, polyolefin and other thermoplastic resins,<br />
plasticizers, inorganic and organic pigments, all of which we believe<br />
are in adequate supply. We have long-term supply contracts with<br />
OxyVinyls under which the majority of our PVC resin and all of our<br />
VCM is supplied. These contracts will expire in 2013, although they<br />
contain two five-year renewal provisions that are at our option. We<br />
believe these contracts should assure the availability of adequate<br />
amounts of PVC resin and VCM. We also believe that the pricing<br />
under these contracts provides PVC resins and VCM to us at a<br />
competitive cost. We also periodically obtain raw materials from<br />
foreign suppliers. See discussion of risks associated with raw<br />
material supply and costs in Item 1A. Risk Factors.<br />
Patents and Trademarks<br />
We own and maintain a large number of U.S. and foreign patents<br />
and trademarks that contribute to our competitiveness in the markets<br />
we serve because they protect our inventions and product<br />
names against infringement by others. Patents exist for 20 years if<br />
all fees are paid, and trademarks have an indefinite life based upon<br />
continued use. While we view our patents and trademarks to be<br />
valuable because of the broad scope of our products and services<br />
and brand recognition we enjoy, we do not believe that the loss or<br />
expiration of any single patent or trademark would have a material<br />
adverse effect on our results of operations, financial position or the<br />
continuation of our business. Nevertheless, we have implemented<br />
management processes designed to protect our inventions and<br />
trademarks.<br />
Seasonality and Backlog<br />
Sales of our products and services are slightly seasonal as demand<br />
is generally slower in the first and fourth calendar quarters of the<br />
year. Because of the nature of our business, we do not believe that<br />
POLYONE CORPORATION<br />
5
POLYONE CORPORATION<br />
our backlog is a meaningful indicator of the level of our present or<br />
future business.<br />
Working Capital Practices<br />
Our products are generally manufactured with a short turnaround<br />
time, and the scheduling of manufacturing activities from customer<br />
orders generally includes enough lead time to assure delivery of an<br />
adequate supply of raw materials. We offer payment terms to our<br />
customers that are competitive. We generally allow our customers<br />
to return merchandise if pre-agreed quality standards or specifications<br />
are not met; however, we employ quality assurance practices<br />
that seek to minimize customer returns. Our customer returns are<br />
immaterial.<br />
Significant Customers<br />
No customer accounts for more than 3% of our consolidated revenues,<br />
and neither we nor any of our operating segments would<br />
suffer a material adverse effect if we were to lose any single<br />
customer.<br />
Research and Development<br />
We have substantial technology and development capabilities. Our<br />
efforts are largely devoted to developing new product formulations<br />
to satisfy defined market needs, providing quality technical services<br />
to evaluate alternative raw materials, assuring the continued success<br />
of our products for customer applications, providing technology<br />
to improve our products, processes and applications, and<br />
providing support to our manufacturing plants for cost reduction,<br />
productivity and quality improvement programs. We operate<br />
research and development centers that support our commercial<br />
development activities and manufacturing operations. These facilities<br />
are equipped with state-of-the-art analytical, synthesis, polymer<br />
characterization and testing equipment, along with pilot plants<br />
and polymer compounding operations that simulate specific production<br />
processes that allow us to rapidly translate new technologies<br />
into new products.<br />
Our investment in product research and development was<br />
$22.9 million in <strong>2009</strong>, $26.5 million in 2008 and $21.6 million<br />
in 2007. In 2010, we expect our investment in research and<br />
development to increase moderately as we deploy greater<br />
resources to focus on material and service innovations.<br />
Methods of Distribution<br />
We sell products primarily through direct sales personnel, distributors,<br />
including our <strong>PolyOne</strong> Distribution segment, and commissioned<br />
sales agents. We primarily use truck carriers to transport our<br />
products to customers, although some customers pick up product<br />
at our operating facilities or warehouses. We also ship some of our<br />
manufactured products to customers by railroad cars.<br />
Employees<br />
As of February 1, 2010, we employed approximately 3,900 people.<br />
Less than 2% of our employees are represented by labor unions<br />
under collective bargaining agreements. We believe that relations<br />
with our employees are good, and we do not anticipate significant<br />
operating issues to occur as a result of current negotiations or when<br />
we renegotiate collective bargaining agreements as they expire.<br />
Environmental, Health and Safety<br />
We are subject to various environmental laws and regulations that<br />
apply to the production, use and sale of chemicals, emissions into<br />
the air, discharges into waterways and other releases of materials<br />
into the environment and the generation, handling, storage, transportation,<br />
treatment and disposal of waste material. We endeavor<br />
to ensure the safe and lawful operation of our facilities in the<br />
manufacture and distribution of products, and we believe we are<br />
in material compliance with all applicable laws and regulations.<br />
We maintain a disciplined environmental and occupational<br />
safety and health compliance program and conduct periodic internal<br />
and external regulatory audits at our facilities to identify and categorize<br />
potential environmental exposures, including compliance<br />
matters and any actions that may be required to address them. This<br />
effort can result in process or operational modifications, the installation<br />
of pollution control devices or cleaning up grounds or facilities.<br />
We believe that we are in material compliance with all<br />
applicable requirements.<br />
We are strongly committed to safety as evidenced by our injury<br />
incidence rate of 0.9 per 100 full-time workers per year in <strong>2009</strong>, an<br />
improvement from 1.1 in 2008. The 2008 average injury incidence<br />
rate for our NAICS Code (326 Plastics and Rubber Products Manufacturing)<br />
was 5.7.<br />
In our operations, we must comply with product-related governmental<br />
law and regulations affecting the plastics industry generally<br />
and also with content-specific law, regulations and nongovernmental<br />
standards. We believe that compliance with current<br />
governmental laws and regulations and with non-governmental content-specific<br />
standards will not have a material adverse effect on<br />
our financial position, results of operations or cash flows. The risk<br />
of additional costs and liabilities, however, is inherent in certain<br />
plant operations and certain products produced at these plants, as<br />
is the case with other companies in the plastics industry. Therefore,<br />
we may incur additional costs or liabilities in the future. Other<br />
developments, such as increasingly strict environmental, safety<br />
and health laws, regulations and related enforcement policies,<br />
including those under the Restrictions on the Use of Certain Hazardous<br />
Substances (RoHS) and the Consumer Product Safety Information<br />
Act of 2008, the implementation of additional contentspecific<br />
standards, discovery of unknown conditions, and claims<br />
for damages to property, persons or natural resources resulting<br />
from plant emissions or products could also result in additional<br />
costs or liabilities.<br />
6
A number of foreign countries and domestic communities have<br />
enacted, or are considering enacting, laws and regulations concerning<br />
the use and disposal of plastic materials. Widespread adoption<br />
of these laws and regulations, along with public perception, may<br />
have an adverse impact on sales of plastic materials. Although<br />
many of our major markets are in durable, longer-life applications<br />
that could reduce the impact of these kinds of environmental regulations,<br />
more stringent regulation of the use and disposal of<br />
plastics may have an adverse effect on our business.<br />
During 2004, the U.S. Environmental Protection Agency (EPA)<br />
conducted multimedia audits at two of our facilities, pursuant to<br />
which certain fines and penalties have been asserted by the EPA.<br />
See Item 3., “Legal Proceedings”, for additional information.<br />
We have been notified by federal and state environmental<br />
agencies and by private parties that we may be a potentially responsible<br />
party (PRP) in connection with their investigation and remediation<br />
of a number of environmental waste disposal sites. While<br />
government agencies assert that PRPs are jointly and severally<br />
liable at these sites, in our experience, interim and final allocations<br />
of liability costs are generally made based on the relative contribution<br />
of waste. However, even when allocations of costs based on<br />
relative contribution of waste have been made, we cannot assure<br />
that our allocation will not increase if other PRPs do not pay their<br />
allocated share of these costs.<br />
Based on September 2007 court rulings (see Note 12, Commitments<br />
and Related-Party Information, to the accompanying consolidated<br />
financial statements) in the case of Westlake Vinyls,<br />
Inc. v. Goodrich Corporation, et al. and a settlement agreement<br />
related to the former Goodrich Corporation (now owned by Westlake<br />
Vinyls, Inc.) Calvert City facility, we recorded a charge during 2007 of<br />
$15.6 million for past remediation costs payable to Goodrich Corporation.<br />
We also adjusted our environmental reserve for future<br />
remediation costs, a portion of which already related to the Calvert<br />
City site, resulting in an additional charge of $28.8 million in 2007.<br />
We incurred environmental expenses of $11.7 million in <strong>2009</strong>,<br />
$17.1 million in 2008 and $48.8 million in 2007. Our environmental<br />
expense in <strong>2009</strong> related mostly to ongoing remediation. Our<br />
environmental expense in 2008 consisted of higher utility cost<br />
estimates necessary to support remediation. Our environmental<br />
expenses in 2007 were largely driven by the charges stemming from<br />
the aforementioned Calvert City settlement and subsequent<br />
reserve adjustment. Additionally, in <strong>2009</strong>, we received $23.9 million<br />
from our former parent company as partial reimbursement of<br />
certain previously incurred environmental remediation costs. In<br />
2008, we received $1.5 million of insurance recoveries. There were<br />
no insurance recoveries in 2007.<br />
We also conduct investigations and remediation at certain of our<br />
active and inactive facilities and have assumed responsibility for the<br />
resulting environmental liabilities from operations at sites we or our<br />
predecessors formerly owned or operated. We believe that our potential<br />
continuing liability at these sites will not have a material adverse<br />
effect on our results of operations or financial position. In addition,<br />
we voluntarily initiate corrective and preventive environmental<br />
projects at our facilities. Based on current information and estimates<br />
prepared by our environmental engineers and consultants, we had<br />
reserves as of December 31, <strong>2009</strong> on our accompanying consolidated<br />
balance sheet totaling $81.7 million to cover probable future<br />
environmental expenditures related to previously contaminated sites.<br />
This figure represents our best estimate of probable costs for<br />
remediation, based upon the information and technology currently<br />
available and our view of the most likely remedy.<br />
Depending upon the results of future testing, the ultimate<br />
remediation alternatives undertaken, changes in regulations,<br />
new information, newly discovered conditions and other factors,<br />
it is reasonably possible that we could incur additional costs in<br />
excess of the amount accrued at December 31, <strong>2009</strong>. Such costs,<br />
if any, cannot be currently estimated. We may revise our estimate of<br />
this liability as new regulations or technologies are developed or<br />
additional information is obtained.<br />
We expect cash paid for environmental remediation expenditures<br />
will be approximately $15 million in 2010.<br />
International Operations<br />
Our international operations are subject to a variety of risks, including<br />
currency fluctuations and devaluations, exchange controls, currency<br />
restrictions and changes in local economic conditions. While<br />
the impact of these risks is difficult to predict, any one or more of<br />
them could adversely affect our future operations. For more information<br />
about our international operations, see Note 16, Segment<br />
Information, to the accompanying consolidated financial statements,<br />
which is incorporated by reference into this Item 1.<br />
Where You Can Find Additional Information<br />
Our principal executive offices are located at 33587 Walker Road,<br />
Avon Lake, Ohio 44012, and our telephone number is<br />
(440) 930-1000. We are subject to the information reporting<br />
requirements of the Exchange Act, and, in accordance with these<br />
requirements, we file annual, quarterly and other reports, proxy<br />
statements and other information with the SEC relating to our<br />
business, financial results and other matters. The reports, proxy<br />
statements and other information we file may be inspected and<br />
copied at prescribed rates at the SEC’s Public Reference Room and<br />
via the SEC’s website (see below for more information).<br />
You may inspect a copy of the reports, proxy statements and<br />
other information we file with the SEC, without charge, at the SEC’s<br />
Public Reference Room, 100 F Street, N.E., Room 1580, Washington,<br />
D.C. 20549, and you may obtain copies of the reports, proxy<br />
statements and other information we file with the SEC, from those<br />
offices for a fee. You may obtain information on the operation of the<br />
Public Reference Room by calling the SEC at 1-800-SEC-0330. Our<br />
filings are available to the public at the SEC’s website at<br />
http://www.sec.gov.<br />
Our Internet address is www.polyone.com. Our <strong>Annual</strong> <strong>Report</strong>s<br />
on Form 10-K, Quarterly <strong>Report</strong>s on Form 10-Q, Current <strong>Report</strong>s on<br />
Form 8-K and amendments to those reports filed or furnished<br />
POLYONE CORPORATION<br />
7
POLYONE CORPORATION<br />
pursuant to Section 13(a) or 15(d) of the Exchange Act are available,<br />
free of charge, on our website (www.polyone.com, select Investors<br />
and then SEC Edgar filings) or upon written request, as soon as<br />
reasonably practicable after we electronically file or furnish them to<br />
the SEC. These reports are also available on the SEC’s website at<br />
www.sec.gov.<br />
ITEM 1A. RISK FACTORS<br />
The following are certain risk factors that could affect our business,<br />
financial position, results of operations or cash flows. These risk<br />
factors should be considered along with the forward-looking statements<br />
contained in this <strong>Annual</strong> <strong>Report</strong> on Form 10-K because these<br />
factors could cause our actual results or financial condition to differ<br />
materially from those projected in forward-looking statements. The<br />
following discussion is not an all-inclusive listing of risks, although<br />
we believe these are the more material risks that we face. If any of<br />
the following occur, our business, financial position, results of<br />
operations or cash flows could be negatively affected.<br />
Demand for and supply of our products and services may be<br />
adversely affected by several factors, some of which we cannot<br />
predict or control, that could adversely affect our financial position,<br />
results of operations or cash flows.<br />
Several factors may affect the demand for and supply of our products<br />
and services, including:<br />
• economic downturns in the significant end markets that we<br />
serve;<br />
• product obsolescence or technological changes that unfavorably<br />
alter the value / cost proposition of our products and<br />
services;<br />
• competition from existing and unforeseen polymer and nonpolymer<br />
based products;<br />
• declines in general economic conditions or reductions in<br />
industrial production growth rates, both domestically and<br />
globally, which could impact our customers ability to pay<br />
amounts owed to us;<br />
• changes in environmental regulations that would limit our<br />
ability to sell our products and services in specific markets;<br />
and<br />
• inability to obtain raw materials or supply products to customers<br />
due to factors such as supplier work stoppages,<br />
supply shortages, plant outages or regulatory changes that<br />
may limit or prohibit overland transportation of certain hazardous<br />
materials and exogenous factors, like severe<br />
weather.<br />
If any of these events occur, the demand for and supply of our<br />
products and services could suffer, which would adversely affect<br />
our financial position, results of operations and cash flows.<br />
Our manufacturing operations are subject to hazards and other<br />
risks associated with polymer production and the related storage<br />
and transportation of raw materials, products and wastes.<br />
Our manufacturing operations are subject to the usual hazards and<br />
risks associated with polymer production and the related storage<br />
and transportation of raw materials, products and wastes. These<br />
hazards and risks include, but are not limited to:<br />
• explosions, fires, inclement weather and natural disasters;<br />
• mechanical failure resulting in protracted or short duration<br />
unscheduled downtime;<br />
• regulatory changes that affect or limit the transportation of<br />
raw materials;<br />
• inability to obtain or maintain any required licenses or<br />
permits;<br />
• interruptions and environmental hazards such as chemical<br />
spills, discharges or releases of toxic or hazardous substances<br />
or gases into the environment or workplace; and<br />
• storage tank leaks or other issues resulting from remedial<br />
activities.<br />
The occurrence of any of these operating problems at our<br />
facilities may have a material adverse effect on the productivity<br />
and profitability of a particular manufacturing facility or on our<br />
operations as a whole, during and after the period of these operating<br />
difficulties. These operating problems may also cause personal<br />
injury and loss of life, severe damage to or destruction of<br />
property and equipment and environmental damage. We are subject<br />
to present and potential future claims with respect to workplace<br />
exposure, workers’ compensation and other matters. Although we<br />
maintain property and casualty insurance of the types and in the<br />
amounts that we believe are customary for the industry, we may not<br />
be fully insured against all potential hazards that are incident to our<br />
business.<br />
Extensive environmental, health and safety laws and regulations<br />
impact our operations and assets and compliance with<br />
these regulations could adversely affect our financial position,<br />
results of operations or cash flows.<br />
Our operations on, and ownership of, real property are subject to<br />
extensive environmental, health and safety laws and regulations at<br />
the national, state and local governmental levels. The nature of our<br />
business exposes us to compliance costs and risks of liability under<br />
these laws and regulations due to the production, storage, transportation,<br />
recycling or disposal and/or sale of materials that can<br />
cause contamination and other harm to the environment or personal<br />
injury if they are released. Environmental compliance requirements<br />
on us and our vendors may significantly increase the costs of<br />
these activities involving raw materials, energy, finished products<br />
and wastes. We may incur substantial costs, including fines, damages,<br />
criminal or civil sanctions, remediation costs or experience<br />
interruptions in our operations for violations of these laws.<br />
8
We also conduct investigations and remediation at some of our<br />
active and inactive facilities and have assumed responsibility for<br />
environmental liabilities at sites formerly owned or operated by our<br />
predecessors or by us. Also, federal and state environmental statutes<br />
impose strict, and under some circumstances, joint and several<br />
liability for the cost of investigations and remedial actions on<br />
any company that generated the waste, arranged for disposal of the<br />
waste, transported the waste to the disposal site or selected the<br />
disposal site as well as on the owners and operators of these sites.<br />
Any or all of the responsible parties may be required to bear all of<br />
the costs of clean up, regardless of fault or legality of the waste<br />
disposal or ownership of the site, and may also be subject to liability<br />
for natural resource damages. We have been notified by federal and<br />
state environmental agencies and private parties that we may be a<br />
potentially responsible party in connection with certain sites. We<br />
may incur substantial costs for some of these sites. It is possible<br />
that we will be identified as a potentially responsible party at more<br />
sites in the future which could result in our being assessed substantial<br />
investigation or cleanup costs.<br />
We may also incur additional costs and liabilities as a result of<br />
increasingly strict environmental, safety and health laws, regulations<br />
and related enforcement policies, restrictions on the use of<br />
lead and phthalates under the Restriction on the Use of Certain<br />
Hazardous Substances (RoHS) and the Consumer Product Safety<br />
Information Act of 2008 and restrictions on greenhouse gases<br />
emissions.<br />
The European Union has adopted REACH, a legislative act to<br />
cover Registration, Evaluation, Authorization and Restriction of<br />
Chemicals. The goal of this legislation, which became effective in<br />
June 2007, is to minimize risk to human health and to the environment<br />
by regulating the use of chemicals. As these regulations<br />
evolve, we will endeavor to remain in compliance with REACH.<br />
We accrue costs for environmental matters that have been<br />
identified when it is probable that these costs will be required and<br />
when they can be reasonably estimated. However, we may be<br />
subject to additional environmental liabilities or potential liabilities<br />
that have not been identified. We expect that we will continue to be<br />
subject to increasingly stringent environmental, health and safety<br />
laws and regulations. We anticipate that compliance with these laws<br />
and regulations will continue to require capital expenditures and<br />
operating costs, which could adversely affect our financial position,<br />
results of operations or cash flows.<br />
Because our operations are conducted worldwide, they are<br />
inherently affected by risk.<br />
As noted above in Item 1. “Business,” we have extensive operations<br />
outside of the United States. Revenue from these operations (principally<br />
from Canada, Mexico, Europe and Asia) was approximately<br />
37% in each of <strong>2009</strong>, 2008 and 2007. Long-lived assets of our<br />
foreign operations represented 36% in <strong>2009</strong>, 35% in 2008 and 36%<br />
in 2007 of our total long-lived assets.<br />
International operations are subject to risks, which include, but<br />
are not limited to, the following:<br />
• changes in local government regulations and policies including,<br />
but not limited to foreign currency exchange controls or<br />
monetary policy; repatriation of earnings; expropriation of<br />
property; duty or tariff restrictions; investment limitations;<br />
and tax policies;<br />
• political and economic instability and disruptions, including<br />
labor unrest, civil strife, acts of war, guerilla activities, insurrection<br />
and terrorism;<br />
• legislation that regulates the use of chemicals;<br />
• disadvantages of competing against companies from countries<br />
that are not subject to U.S. laws and regulations,<br />
including the Foreign Corrupt Practices Act (FCPA);<br />
• difficulties in staffing and managing multi-national<br />
operations;<br />
• limitations on our ability to enforce legal rights and<br />
remedies;<br />
• reduced protection of intellectual property rights; and<br />
• other risks arising out of foreign sovereignty over the areas<br />
where our operations are conducted.<br />
In addition, we could be adversely affected by violations of the<br />
FCPA and similar worldwide anti-bribery laws. The FCPA and similar<br />
anti-bribery laws in other jurisdictions generally prohibit companies<br />
and their intermediaries from making improper payments to<br />
non-U.S. officials for the purpose of obtaining or retaining business.<br />
Our policies mandate compliance with these anti-bribery laws. We<br />
operate in many parts of the world that have experienced governmental<br />
corruption to some degree and, in certain circumstances,<br />
strict compliance with anti-bribery laws may conflict with local customs<br />
and practices. We cannot assure you that our internal controls<br />
and procedures always will protect us from the reckless or criminal<br />
acts committed by our employees or agents. If we are found to be<br />
liable for FCPA violations, we could suffer from criminal or civil<br />
penalties or other sanctions, which could have a material adverse<br />
effect on our business.<br />
Any of these risks could have an adverse effect on our international<br />
operations by reducing the demand for our products or<br />
reducing the prices at which we can sell our products, which could<br />
result in an adverse effect on our business, financial position,<br />
results of operations or cash flows. We may not be able to continue<br />
to operate in compliance with applicable customs, currency<br />
exchange control regulations, transfer pricing regulations or any<br />
other laws or regulations that we may be subject to. In addition,<br />
these laws or regulations may be modified in the future, and we may<br />
not be able to operate in compliance with those modifications.<br />
POLYONE CORPORATION<br />
9
POLYONE CORPORATION<br />
We engage in acquisitions and joint ventures, and may encounter<br />
unexpected difficulties integrating those businesses.<br />
Attainment of our strategic plan objectives may require, in part,<br />
strategic acquisitions or joint ventures intended to complement or<br />
expand our businesses globally or add product technology that<br />
accelerates our specialization strategy, or both. Success will<br />
depend on our ability to complete these transactions or arrangements,<br />
and integrate the businesses acquired in these transactions<br />
as well as develop satisfactory working arrangements with our<br />
strategic partners in the joint ventures. Unexpected difficulties in<br />
completing and integrating acquisitions with our existing operations<br />
and in managing strategic investments could occur. Furthermore,<br />
we may not realize the degree, or timing, of benefits initially anticipated,<br />
which could adversely affect our business, financial position,<br />
results of operations or cash flows.<br />
Our results of operations may be adversely affected by the<br />
results of operations of SunBelt.<br />
SunBelt is our largest equity investment. The earnings of this<br />
partnership may be significantly affected by changes in the commodity<br />
cycle for hydrocarbon feedstocks and for chlor-alkali products.<br />
If the profitability of SunBelt is adversely affected, cash<br />
distributions from the partnership may decline or we may be<br />
required to make cash contributions to the partnership, either of<br />
which could adversely affect our financial position, results of operations<br />
or cash flows.<br />
Natural gas, electricity, fuel and raw material costs, and other<br />
external factors beyond our control, as well as downturns in the<br />
home repair and remodeling and new home sectors of the economy,<br />
can cause wide fluctuations in our margins.<br />
The cost of our natural gas, electricity, fuel and raw materials, and<br />
other costs, may not correlate with changes in the prices we receive<br />
for our products, either in the direction of the price change or in<br />
absolute magnitude. Natural gas and raw materials costs represent<br />
a substantial part of our manufacturing energy costs. In particular,<br />
electricity and fuel represent a component of the costs to manufacture<br />
building products. Most of the raw materials we use are<br />
commodities and the price of each can fluctuate widely for a variety<br />
of reasons, including changes in availability because of major<br />
capacity additions or reductions or significant facility operating<br />
problems. Other external factors beyond our control can cause<br />
volatility in raw materials prices, demand for our products, product<br />
prices, sales volumes and margins. These factors include general<br />
economic conditions, the level of business activity in the industries<br />
that use our products, competitors’ actions, international events<br />
and circumstances, and governmental regulation in the United<br />
States and abroad, such as climate change regulation. These factors<br />
can also magnify the impact of economic cycles on our business.<br />
While we attempt to pass through price increases in energy<br />
costs and raw materials, we have been unsuccessful in doing so in<br />
some circumstances in the past and there can be no reassurance<br />
that we can do so in the future.<br />
Additionally, our products used in housing, transportation and<br />
building and construction markets are impacted by changes in<br />
demand in these sectors, which may be significantly affected by<br />
changes in economic and other conditions such as gross domestic<br />
product levels, employment levels, demographic trends, legislative<br />
actions and consumer confidence. These factors can lower the<br />
demand for and pricing of our products, which could cause our net<br />
sales and net income to decrease.<br />
We face competition from other polymer and chemical companies,<br />
which could adversely affect our sales, results of operations<br />
or cash flows.<br />
We actively compete with companies that produce the same or<br />
similar products, and in some instances with companies that produce<br />
different products that are designed for the same end uses.<br />
We encounter competition in price, delivery, service, performance,<br />
product innovation, product recognition and quality, depending on<br />
the product involved.<br />
We expect that our competitors will continue to develop and<br />
introduce new and enhanced products, which could cause a decline<br />
in the market acceptance of our products. In addition, our competitors<br />
could cause a reduction in the selling prices of some of our<br />
products as a result of intensified price competition. Competitive<br />
pressures can also result in the loss of major customers. An inability<br />
to compete successfully could have an adverse effect on our financial<br />
position, results of operations or cash flows.<br />
We may also experience increased competition from companies<br />
that offer products based on alternative technologies and<br />
processes that may be more competitive or better in price or<br />
performance, causing us to lose customers and result in a decline<br />
in our sales volume and earnings.<br />
Additionally, some of our customers may already be or may<br />
become large enough to justify developing in-house production<br />
capabilities. Any significant reduction in customer orders as a result<br />
of a shift to in-house production could adversely affect our sales and<br />
operating profits.<br />
A major failure of our information systems could harm our<br />
business.<br />
We depend on integrated information systems to conduct our business.<br />
We may experience operating problems with our information<br />
systems as a result of system failures, viruses, computer “hackers”<br />
or other causes. Any significant disruption or slowdown of our<br />
systems could cause customers to cancel orders or cause standard<br />
business processes to become ineffective, which could adversely<br />
affect our financial position, results of operations or cash flows.<br />
Adverse credit market conditions may significantly affect our<br />
access to capital, cost of capital and ability to meet liquidity<br />
needs.<br />
Disruptions, uncertainty or volatility in the credit markets may<br />
adversely impact our ability to access credit already arranged<br />
10
and the availability and cost of credit to us in the future. These<br />
market conditions may limit our ability to replace maturing liabilities<br />
in a timely manner and access the capital necessary to grow and<br />
maintain our business. Accordingly, we may be forced to delay<br />
raising capital, issue shorter tenors than we prefer or pay unattractive<br />
interest rates, which could increase our interest expense,<br />
decrease our profitability and significantly reduce our financial<br />
flexibility. There can be no assurances that government responses<br />
to the disruptions in the financial markets will stabilize the markets<br />
or increase liquidity and the availability of credit. Longer term<br />
disruptions in the capital and credit markets as a result of uncertainty,<br />
changing or increased regulation, reduced alternatives or<br />
failures of significant financial institutions could adversely affect<br />
our access to liquidity needed for our business. Any disruption could<br />
require us to take measures to conserve cash until the markets<br />
stabilize or until alternative credit arrangements or other funding for<br />
our business needs can be arranged. Such measures could include<br />
deferring capital expenditures and reducing or eliminating future<br />
share repurchases or other discretionary uses of cash. Overall, our<br />
results of operations, financial condition and cash flows could be<br />
materially adversely affected by disruptions in the credit markets.<br />
The recent global financial crisis may have significant effects<br />
on our customers and suppliers that would result in material<br />
adverse effects on our business and operating results.<br />
The recent global financial crisis, which has included, among other<br />
things, significant reductions in available capital and liquidity from<br />
banks and other providers of credit, substantial reductions and<br />
fluctuations in equity and currency values worldwide, and concerns<br />
that the worldwide economy may enter into a prolonged recessionary<br />
period, may materially adversely affect our customers’<br />
access to capital or willingness to spend capital on our products<br />
or their ability to pay for products that they will order or have already<br />
ordered from us. In addition, the current global financial crisis may<br />
materially adversely affect our suppliers’ access to capital and<br />
liquidity with which to maintain their inventories, production levels<br />
and product quality, which could cause them to raise prices or lower<br />
production levels.<br />
Also, availability under our receivables sales facility may be<br />
adversely impacted by credit quality and performance of our customer<br />
accounts receivable. The availability under the receivable<br />
sales facility is based on the amount of receivables that meet the<br />
eligibility criteria of the receivables sales facility. As sales decline,<br />
receivable losses increase or credit quality deteriorates, the<br />
amount of eligible receivables declines and, in turn, lowers the<br />
availability under the facility.<br />
These potential effects of the recent global financial crisis are<br />
difficult to forecast and mitigate. As a consequence, our operating<br />
results for a particular period are difficult to predict, and, therefore,<br />
prior results are not necessarily indicative of results to be expected<br />
in future periods. Any of the foregoing effects could have a material<br />
adverse effect on our business, results of operations and financial<br />
condition.<br />
We have a significant amount of goodwill, and any future goodwill<br />
impairment charges could adversely impact our results of<br />
operations.<br />
As of December 31, <strong>2009</strong>, we had goodwill of $163.5 million. The<br />
future occurrence of a potential indicator of impairment, such as a<br />
significant adverse change in legal factors or business climate, an<br />
adverse action or assessment by a regulator, unanticipated competition,<br />
a material negative change in relationships with significant<br />
customers, strategic decisions made in response to economic or<br />
competitive conditions, loss of key personnel or a more-likely-thannot<br />
expectation that a reporting unit or a significant portion of a<br />
reporting unit will be sold or disposed of, could result in goodwill<br />
impairment charges, which could adversely impact our results of<br />
operations.<br />
Poor investment performance by our pension plan assets may<br />
increase our pension liability and expense, which may increase<br />
the required funding of our pension obligations and divert funds<br />
from other potential uses.<br />
We provide defined benefit pension plans to eligible employees. Our<br />
pension expense and our required contributions to our pension<br />
plans are directly affected by the value of plan assets, the projected<br />
rate of return on plan assets, the actual rate of return on plan<br />
assets and the actuarial assumptions we use to measure our<br />
defined benefit pension plan obligations, including the rate at which<br />
future obligations are discounted to a present value, or the discount<br />
rate. As of December 31, <strong>2009</strong>, for pension accounting purposes,<br />
we assumed an 8.5% rate of return on pension assets.<br />
Poor investment performance by our pension plan assets<br />
resulting from a decline in the stock market could significantly<br />
increase the deficit position of our plans. Should the assets earn<br />
an average return less than 8.5% over time, it is likely that future<br />
pension expenses and funding requirements would increase.<br />
We establish the discount rate used to determine the present<br />
value of the projected and accumulated benefit obligation at the end<br />
of each year based upon the available market rates for high quality,<br />
fixed income investments. An increase in the discount rate would<br />
reduce the future pension expense and, conversely, a lower discount<br />
rate would raise the future pension expense.<br />
Based on current guidelines, assumptions and estimates,<br />
including stock market prices and interest rates, we anticipate that<br />
we will be required to make a cash contribution of approximately<br />
$20.8 million to our pension plans in 2010.<br />
We cannot predict whether changing market or economic conditions,<br />
regulatory changes or other factors will further increase our<br />
pension expense or funding obligations, diverting funds we would<br />
otherwise apply to other uses.<br />
ITEM 1B. UNRESOLVED STAFF COMMENTS<br />
We have no outstanding or unresolved comments from the staff of<br />
the SEC.<br />
POLYONE CORPORATION<br />
11
ITEM 2. PROPERTIES<br />
As of February 1, 2010, we operated facilities in the United States and internationally. Our corporate office is located in Avon Lake, Ohio.<br />
We employ approximately 3,900 people and have 47 manufacturing sites and 11 distribution facilities in North America, Europe, and Asia,<br />
and joint ventures in North America. We own substantially all of our manufacturing sites and lease our distribution facilities. We believe that<br />
the quality and production capacity of our facilities is sufficient to maintain our competitive position for the foreseeable future. The following<br />
table identifies the principal facilities of our segments:<br />
Performance Products and<br />
Solutions<br />
International Color and<br />
Engineered Materials<br />
Specialty Color, Additives<br />
and Inks<br />
<strong>PolyOne</strong> Distribution<br />
Long Beach, California Assesse, Belgium Glendale, Arizona Livermore, California<br />
Commerce, California Pudong (Shanghai), China Kennesaw, Georgia Rancho Cucamonga, California<br />
Kennesaw, Georgia (1) Shenzhen, China Suwanee, Georgia (2) Chicago, Illinois (4)<br />
Henry, Illinois Suzhou, China Elk Grove Village, Illinois Ayer, Massachusetts<br />
Terre Haute, Indiana Tianjin, China (2) St. Louis, Missouri Chesterfield Township, Michigan<br />
Louisville, Kentucky Cergy, France Massillon, Ohio Eagan, Minnesota<br />
Sullivan, Missouri Tossiat, France Norwalk, Ohio Statesville, North Carolina<br />
Pedricktown, New Jersey Bendorf, Germany Lehigh, Pennsylvania Massillon, Ohio<br />
Avon Lake, Ohio Gaggenau, Germany Vonore, Tennessee La Porte, Texas<br />
North Baltimore, Ohio Melle, Germany Shenzhen, China (1) Fife, Washington<br />
Clinton, Tennessee Gyor, Hungary Toluca, Mexico Mississauga, Ontario, Canada<br />
Dyersburg, Tennessee Kutno, Poland (9 manufacturing plants) (11 distribution facilities)<br />
Pasadena, Texas<br />
Mumbai, India<br />
Seabrook, Texas Jurong, Singapore (3) Specialty Resin and Intermediates<br />
Orangeville, Ontario, Canada Barbastro, Spain Engineered Materials SunBelt joint venture —<br />
St. Remi de Napierville, Pamplona, Spain McHenry, Illinois McIntosh, Alabama (5)<br />
Quebec, Canada Angered, Sweden Avon Lake, Ohio<br />
Dongguan, China Bangkok, Thailand Dyersburg, Tennessee (1)<br />
(16 manufacturing plants) Istanbul, Turkey North Haven, Connecticut<br />
(18 manufacturing plants) Seabrook, Texas (1)<br />
Suzhou, China<br />
Gaggenau, Germany (1)<br />
Jurong, Singapore (1)<br />
Barbastro, Spain (1)<br />
(4 manufacturing plants)<br />
(1)<br />
(2)<br />
(3)<br />
(4)<br />
(5)<br />
Facility is not included in manufacturing plants total as it is also included as part of another segment.<br />
Facility is not included in manufacturing plants total as it is a design center/lab.<br />
As part of the restructuring actions announced in January <strong>2009</strong>, the Jurong, Singapore facility will be closed during 2010.<br />
Facility is not owned by <strong>PolyOne</strong>, however it is included in distribution facility total as it is a primary distribution location.<br />
Facility is shared as part of a joint venture, not included in manufacturing plants total.<br />
POLYONE CORPORATION<br />
ITEM 3. LEGAL PROCEEDINGS<br />
During 2004, the EPA conducted multimedia inspections at our<br />
polyvinyl chloride resin manufacturing facilities located in Henry,<br />
Illinois and Pedricktown, New Jersey. In December 2007, the EPA<br />
met with the Company for the first time since those inspections to<br />
discuss possible violations of the Clean Air Act, the Clean Water Act<br />
and the Resource Conservation and Recovery Act at each of the<br />
Henry, Illinois and Pedricktown, New Jersey facilities. Discussions<br />
between representatives for the Company and the EPA occurred in<br />
2008, during which we provided additional information as well as<br />
our position regarding the compliance status of the facilities and<br />
discussed certain modifications to testing procedures and record<br />
keeping. In January <strong>2009</strong>, we received a letter from the EPA proposing<br />
a resolution of any violations identified as a result of the<br />
2004 inspection that would include our payment of fines and penalties<br />
in the amount of $1.3 million. We continue to discuss with the<br />
EPA resolution of proposed violations on a mutually agreed basis.<br />
In addition to the matters regarding the environment described<br />
above and in Item 1. under the heading “Environmental, Health and<br />
Safety,” we are involved in various pending or threatened claims,<br />
lawsuits and administrative proceedings, all arising from the ordinary<br />
course of business concerning commercial, product liability,<br />
employment and environmental matters that seek remedies or<br />
damages. We believe that the probability is remote that losses in<br />
excess of the amounts we have accrued could be materially adverse<br />
to our financial position, results of operations or cash flows.<br />
ITEM 4. SUBMISSION OF MATTERS TO A VOTE OF SECURITY<br />
HOLDERS<br />
No matters were submitted to a vote of security holders during the<br />
fourth quarter of <strong>2009</strong>.<br />
EXECUTIVE OFFICERS OF THE REGISTRANT<br />
(Included pursuant to Instruction 3 to paragraph (b) of Item 401 of<br />
Regulation S-K)<br />
12
Executive officers are elected by our Board of Directors to serve one-year terms. The following table lists the name of each person currently<br />
serving as an executive officer of our company, his age as of February 18, 2010 and his current position with our company:<br />
Name Age Position<br />
Stephen D. Newlin 57 Chairman, President and Chief Executive Officer<br />
Robert M. Patterson 37 Senior Vice President and Chief Financial Officer<br />
Bernard P. Baert 60 Senior Vice President, President of Europe and International<br />
Michael E. Kahler 52 Senior Vice President, Chief Commercial Officer<br />
Thomas J. Kedrowski 51 Senior Vice President, Supply Chain and Operations<br />
Craig M. Nikrant 48 Senior Vice President, President of Global Specialty Engineered<br />
Materials<br />
Michael L. Rademacher 59 Senior Vice President, President of Distribution<br />
Robert M. Rosenau 55 Senior Vice President, President of Performance Products and<br />
Solutions<br />
Kenneth M. Smith 55 Senior Vice President, Chief Information and Human Resources Officer<br />
John V. Van Hulle 52 Senior Vice President, President of Global Color, Additives and Inks<br />
Stephen D. Newlin: Chairman, President and Chief Executive Officer,<br />
February 2006 to date. President — Industrial Sector of Ecolab<br />
Inc. (a global developer and marketer of cleaning and sanitizing<br />
specialty chemicals, products and services) from 2003 to 2006.<br />
Mr. Newlin served as President and a Director of Nalco Chemical<br />
Company (a manufacturer of specialty chemicals, services and<br />
systems) from 1998 to 2001 and was Chief Operating Officer<br />
and Vice Chairman from 2000 to 2001. Mr. Newlin serves on the<br />
Boards of Directors of Black Hills Corporation and The Valspar<br />
Corporation.<br />
Robert M. Patterson: Senior Vice President and Chief Financial<br />
Officer, May 2008 to date. Vice President and Treasurer of Novelis,<br />
Inc. (an aluminum rolled products manufacturer) from 2007 to May<br />
2008. Vice President, Controller and Chief Accounting Officer of<br />
Novelis from 2006 to 2007. Mr. Patterson served as Vice President<br />
and Segment Chief Financial Officer, Thermal and Flow Technology<br />
Segments of SPX Corporation (a multi-industry manufacturer and<br />
developer) from 2005 to 2006 and as Vice President and Chief<br />
Financial Officer, Cooling Technologies and Services of SPX from<br />
2004 to 2005. Mr. Patterson served as Vice President and Chief<br />
Financial Officer of Marley Cooling Tower Company, a cooling tower<br />
manufacturer and subsidiary of SPX, from 2002 to 2004.<br />
Bernard P. Baert: Senior Vice President, President of Europe and<br />
International, January 2010 to date. Senior Vice President and<br />
General Manager, Color and Engineered Materials, Europe and Asia,<br />
May 2006 to January 2010. Vice President and General Manager,<br />
Colors and Engineered Materials, Europe and Asia, September<br />
2000, upon formation of <strong>PolyOne</strong>, to April 2006. General Manager,<br />
Color Europe, M.A. Hanna Company, 1997 to August 2000.<br />
Michael E. Kahler: Senior Vice President, Chief Commercial Officer,<br />
January 2010 to date. Senior Vice President, Commercial Development,<br />
May 2006 to January 2010. President, Process Technology<br />
Division, Alfa Laval Inc. (a global provider of heat transfer, separation<br />
and fluid handling products and engineering solutions) from<br />
January 2004 to March 2006. Group Vice President, Nalco Chemical<br />
Company (a manufacturer of specialty chemicals, services and<br />
systems) from December 1999 to October 2002.<br />
Thomas J. Kedrowski: Senior Vice President, Supply Chain and<br />
Operations, September 2007 to date. Vice President of Strategy<br />
and Process Improvement, H.B. Fuller Company (a global manufacturer<br />
and marketer of adhesives and specialty chemical products)<br />
from November 2005 to April 2007. Vice President of Global Operations,<br />
H.B. Fuller Company from February 2002 to November<br />
2005.<br />
Craig M. Nikrant: Senior Vice President, President of Global Specialty<br />
Engineered Materials, January 2010 to date. Vice President<br />
and General Manager, Specialty Engineered Materials, September<br />
2006 to December <strong>2009</strong>. General Manager, Specialty Film & Sheet,<br />
General Electric Plastics, June 2004 to September 2006. Director,<br />
Global Commercial Effectiveness, General Electric Plastics (a<br />
former division of General Electric specializing in supplying plastics),<br />
December 2003 to June 2004. Six Sigma Master Black Belt,<br />
General Electric Company Plastics Business, March 2001 to<br />
December 2002. General Manager, Commercial Operations, North<br />
Central Region, General Electric Plastics, June 1999 to March<br />
2001.<br />
Michael L. Rademacher: Senior Vice President, President of Distribution,<br />
January 2010 to date. Senior Vice President and General<br />
Manager, Distribution, May 2006 to January 2010. Vice President<br />
and General Manager, <strong>PolyOne</strong> Distribution, September 2000, upon<br />
formation of <strong>PolyOne</strong>, to April 2006. Senior Vice President — Plastics<br />
Americas, M.A. Hanna Company, January 2000 to August<br />
2000. Vice President and General Manager, Industrial Chemical<br />
and Solvents Division, Ashland Chemical Company (chemical manufacturing<br />
and distribution), 1998 to January 2000.<br />
Robert M. Rosenau: Senior Vice President, President of Performance<br />
Products and Solutions, January 2010 to date. Senior Vice<br />
President and General Manager, Performance Products and Solutions,<br />
June 2008 to January 2010, Senior Vice President and<br />
General Manager, Vinyl Business, May 2006 to June 2008. Vice<br />
President and General Manager, Vinyl Compounds, January 2003 to<br />
April 2006. General Manager, Extrusion Products, September 2000<br />
to December 2002. General Manager, Custom Profile Compounds,<br />
The Geon Company, April 1998 to August 2000.<br />
POLYONE CORPORATION<br />
13
Kenneth M. Smith: Senior Vice President, Chief Information and<br />
Human Resources Officer, May 2006 to date. Chief Human<br />
Resources Officer, January 2003 to date, and Vice President and<br />
Chief Information Officer, September 2000, upon formation of<br />
<strong>PolyOne</strong>, to April 2006. Vice President, Information Technology,<br />
The Geon Company, May 1999 to August 2000, and Chief Information<br />
Officer, August 1997 to May 1999.<br />
John V. Van Hulle: Senior Vice President, President of Global Color,<br />
Additives and Inks, January 2010 to date. Senior Vice President and<br />
General Manager, Specialty Color, Additives and Inks, July 2006 to<br />
January 2010. President and Chief Executive Officer — ChemDesign<br />
Corporation (a custom chemical manufacturer), December<br />
2001 to July 2006. President, Specialty & Fine Chemicals — Cambrex<br />
Corporation (a specialty chemical and pharmaceutical business)<br />
August 1994 to November 2000.<br />
POLYONE CORPORATION<br />
14
PART II<br />
ITEM 5. MARKET FOR REGISTRANT’S COMMON EQUITY, RELATED STOCKHOLDER MATTERS AND ISSUER PURCHASES OF EQUITY<br />
SECURITIES<br />
The following table sets forth the range of the high and low sale prices for our common stock, $0.01 par value per share, as reported by the<br />
New York Stock Exchange, where the shares are traded under the symbol “POL,” for the periods indicated:<br />
<strong>2009</strong> Quarters 2008 Quarters<br />
Fourth Third Second First Fourth Third Second First<br />
Common stock price:<br />
High $7.74 $7.19 $3.65 $3.56 $6.39 $8.57 $8.23 $7.15<br />
Low $5.45 $2.50 $2.23 $1.32 $2.33 $6.26 $6.30 $5.11<br />
As of February 16, 2010, there were 2,514 holders of record of our common stock.<br />
We did not pay dividends in <strong>2009</strong> or 2008. Future declarations of dividends on common stock are at the discretion of the Board of<br />
Directors, and the declaration of any dividends will depend on, among other things, earnings, capital requirements and our financial position,<br />
results of operations and cash flows. Additionally, the agreements that govern our receivables sale facility contain restrictions that could limit<br />
our ability to pay future dividends.<br />
The table below sets forth information regarding repurchases of our common shares during the fourth quarter of <strong>2009</strong>:<br />
Period<br />
Total Number of<br />
Shares Purchased<br />
Average Price Paid<br />
Per Share<br />
Total Number of<br />
Shares Purchased as<br />
Part of Publicly<br />
Announced Program<br />
Maximum Number of<br />
Shares that May Yet<br />
be Purchased Under<br />
the Program (1)<br />
October 1 to October 31 — $— — 8,750,000<br />
November 1 to November 30 — — — 8,750,000<br />
December 1 to December 31 — — — 8,750,000<br />
Total — $— —<br />
(1)<br />
On August 18, 2008, our Board of Directors approved a stock repurchase program authorizing us, depending upon market conditions and other<br />
factors, to repurchase up to 10.0 million shares of our common stock, in the open market or in privately negotiated transactions.<br />
ITEM 6. SELECTED FINANCIAL DATA<br />
You should refer to Item 7., “Management’s Discussion and Analysis of Financial Condition and Results of Operations”, in Part II of this<br />
<strong>Annual</strong> <strong>Report</strong> on Form 10-K and the notes to our accompanying consolidated financial statements for additional information regarding the<br />
financial data presented below, including matters that might cause this data not to be indicative of our future financial condition, results of<br />
operations or cash flows.<br />
(In millions, except per share data) <strong>2009</strong> (1) 2008 (2) 2007 2006 (3) 2005<br />
Sales $2,060.7 $2,738.7 $2,642.7 $2,622.4 $2,450.6<br />
Operating income (loss) $ 98.4 $ (129.3) $ 33.9 $ 190.6 $ 141.3<br />
Income (loss) before discontinued operations $ 67.8 $ (272.9) $ 11.4 $ 125.6 $ 63.2<br />
Discontinued operations — — — (2.7) (15.3)<br />
Net income (loss) $ 67.8 $ (272.9) $ 11.4 $ 122.9 $ 47.9<br />
Basic and diluted (loss) earnings per common share:<br />
Before discontinued operations $ 0.73 $ (2.94) $ 0.12 $ 1.36 $ 0.69<br />
Discontinued operations — — — (0.03) (0.17)<br />
Basic and diluted (loss) earnings per common share $ 0.73 $ (2.94) $ 0.12 $ 1.33 $ 0.52<br />
Total assets $1,385.9 $1,277.7 $1,583.0 $1,780.8 $1,695.3<br />
Long-term debt, net of current portion $ 389.2 $ 408.3 $ 308.0 $ 567.7 $ 638.7<br />
POLYONE CORPORATION<br />
15
(1)<br />
Included in operating income for <strong>2009</strong> results are charges of $27.2 million related to employee separation and plant phaseout and benefits of<br />
$23.9 million related to reimbursement of previously incurred environmental expenses and $21.1 million related to a curtailment gain from<br />
amendments to certain of our employee benefit plans.<br />
(2)<br />
Included in operating expense for 2008 results are charges of $39.7 million related to employee separation and plant phaseout and<br />
$170.0 million related to goodwill impairment. Included in net loss for 2008 are charges of $105.9 million to record deferred a deferred tax<br />
valuation allowance.<br />
(3)<br />
In February 2006, we sold 82% of our Engineered Films business. This business was previously reported as discontinued operations and is<br />
recognized as such in our historical results. The retained ownership of 18% is reported on the cost method of accounting and is recognized in our<br />
accompanying consolidated financial statements as such.<br />
POLYONE CORPORATION<br />
ITEM 7. MANAGEMENT’S DISCUSSION AND ANALYSIS OF<br />
FINANCIAL CONDITION AND RESULTS OF OPERATIONS<br />
Overview<br />
Management’s Discussion and Analysis of Financial Condition and<br />
Results of Operations (MD&A) is designed to provide information<br />
that is supplemental to, and should be read together with, our<br />
consolidated financial statements and the accompanying notes<br />
contained in this <strong>Annual</strong> <strong>Report</strong> on Form 10-K. Information in this<br />
Item 7 is intended to assist the reader in obtaining an understanding<br />
of our consolidated financial statements, the changes in certain<br />
key items in those financial statements from year to year, the<br />
primary factors that accounted for those changes, and any known<br />
trends or uncertainties that we are aware of that may have a<br />
material effect on our future performance, as well as how certain<br />
accounting principles affect our consolidated financial statements.<br />
MD&A includes the following sections:<br />
• Our Business<br />
• Business Model and Key Concepts<br />
• Key Challenges<br />
• Strategy and Key Trends<br />
• Recent Developments<br />
• Highlights and Executive Summary<br />
• Results of Operations — an analysis of our consolidated<br />
results of operations for the three years presented in our<br />
consolidated financial statements<br />
• Liquidity and Capital Resources — an analysis of the effect<br />
of our operating, financing and investing activities on our<br />
liquidity and capital resources<br />
• Off-Balance Sheet Arrangements — a discussion of such<br />
arrangements<br />
• Contractual Obligations — a summary of our aggregate contractual<br />
obligations<br />
• Critical Accounting Policies and Estimates — a discussion of<br />
accounting policies that require significant judgments and<br />
estimates<br />
• New Accounting Pronouncements — a summary and discussion<br />
of our plans for the adoption of new accounting standards<br />
relevant to us<br />
The following discussion contains forward-looking statements<br />
that reflect our plans, estimates and beliefs. Our actual results<br />
could differ materially from those discussed in these forward-looking<br />
statements. Factors that could cause or contribute to these<br />
differences include, but are not limited to, those discussed below<br />
and elsewhere in this <strong>Annual</strong> <strong>Report</strong> on Form 10-K particularly in<br />
“Cautionary Note On Forward-Looking Statements” and Item 1A.<br />
“Risk Factors.”<br />
Our Business<br />
We are a premier provider of specialized polymer materials, services<br />
and solutions with operations in thermoplastic compounds,<br />
specialty polymer formulations, color and additive systems, thermoplastic<br />
resin distribution and specialty vinyl resins. We also have<br />
two equity investments: one in a manufacturer of caustic soda and<br />
chlorine and one in a formulator of polyurethane compounds. Headquartered<br />
in Avon Lake, Ohio, with <strong>2009</strong> sales of $2.1 billion, we<br />
have manufacturing sites and distribution facilities in North America,<br />
Europe and Asia and joint ventures in North America. We<br />
currently employ approximately 3,900 people and offer more than<br />
35,000 polymer solutions to over 10,000 customers across the<br />
globe. We provide value to our customers through our ability to link<br />
our knowledge of polymers and formulation technology with our<br />
manufacturing and supply chain to provide an essential link<br />
between large chemical producers (our raw material suppliers)<br />
and designers, assemblers and processors of plastics (our<br />
customers).<br />
Business Model and Key Concepts<br />
The central focus of our business model is to provide specialized<br />
material and service solutions to our customers by leveraging our<br />
global footprint, product and technology breadth, manufacturing<br />
expertise, fully integrated information technology network, broad<br />
market reach and raw material procurement strength. These<br />
resources enable us to capitalize on dynamic changes in the end<br />
markets we serve, which include appliances, building and construction<br />
materials, electrical and electronics, medical, industrial, packaging,<br />
transportation, and wire and cable markets.<br />
Key Challenges<br />
Overall, our business faces a number of issues resulting from the<br />
recent economic downturn, especially as it relates to critically<br />
affected markets such as building and construction and transportation.<br />
Maintaining profitability during periods of raw material price<br />
volatility is another critical challenge. Further, we need to capitalize<br />
16
on the opportunity to accelerate development of products that meet<br />
a growing body of environmental laws and regulations such as lead<br />
and phthalate restrictions included in the RoHS and the Consumer<br />
Product Safety Information Act of 2008.<br />
Strategy and Key Trends<br />
To address these challenges and achieve our vision, we have<br />
implemented a strategy with four core components: specialization,<br />
globalization, operational excellence and commercial excellence.<br />
Specialization differentiates us through products, services, technology,<br />
and solutions that add value. Globalization takes us into<br />
growth markets to service our customers with consistency wherever<br />
their operations might be. Operational excellence empowers us to<br />
respond to the voice of the customer while focusing on continuous<br />
improvement. Commercial excellence enables us to deliver value to<br />
customers by supporting their growth and profitability.<br />
In the short term, we will maintain our focus on top-line growth,<br />
improving or maintaining the cost/price relationship with regard to<br />
raw materials and improving working capital efficiency. In addition to<br />
driving top-line growth, we have established margin improvement<br />
targets for all businesses. In 2010, most of our capital expenditures<br />
will be focused on maintenance spending and supporting<br />
growth in top-line sales. We will also consider smaller, bolt-on<br />
strategic acquisitions and other synergy opportunities that complement<br />
our core platforms. These actions will ensure that we continue<br />
to invest in capabilities that advance the pace of our transformation<br />
but do not adversely impact our liquidity.<br />
We will continue our enterprise-wide Lean Six Sigma program<br />
directed at improving profitability and cash flow by applying proven<br />
management techniques and strategies to key areas of the business,<br />
such as pricing, supply chain and operations management,<br />
productivity and quality.<br />
Long-term trends that currently provide opportunities to leverage<br />
our strategy include the drive toward sustainability in polymers<br />
and their processing, the emergence of biodegradable and biobased<br />
polymers, consumer concern over the use of bisphenol-A<br />
(BPA) in infant-care products and developing legislation that bans<br />
lead and certain phthalates from toys and child-care items.<br />
Recent Developments<br />
Acquisition of New England Urethane<br />
On December 23, <strong>2009</strong>, we acquired substantially all of the assets<br />
of New England Urethane, Inc. (NEU), a specialty healthcare engineered<br />
materials provider for a cash purchase price of $11.5 million<br />
paid at close and an earnout of up to $0.5 million payable in 2011,<br />
resulting in goodwill of $4.5 million and $5.9 million of identifiable<br />
intangible assets. NEU had sales of $7.7 million for the year ended<br />
December 31, 2008. Our purchase price allocation is preliminary as<br />
of December 31, <strong>2009</strong>.<br />
Sale of Columbian Joint Venture Interest<br />
On October 13, <strong>2009</strong>, we sold our investment in Geon Polimeros<br />
Andinos (GPA), previously a 50% owned equity affiliate and part of<br />
the Performance Products and Solutions operating segment, to<br />
Mexichem Compuestos, S.A. de C.V. We received cash proceeds of<br />
$13.5 million and recorded a pre-tax gain of $2.8 million in our<br />
fourth quarter <strong>2009</strong> results of operations.<br />
Pension plan changes<br />
On January 15, <strong>2009</strong>, we adopted amendments to the Geon Pension<br />
Plan (Geon Plan), the Benefit Restoration Plan (BRP), the<br />
voluntary retirement savings plan (RSP) and the Supplemental<br />
Retirement Benefit Plan (SRP). Effective March 20, <strong>2009</strong>, the<br />
amendments to the Geon Plan and the BRP permanently froze<br />
future benefit accruals and provide that participants will not receive<br />
credit under the Geon Plan or the BRP for any eligible earnings paid<br />
on or after that date. Additionally, certain benefits provided under<br />
the RSP and SRP were eliminated after March 20, <strong>2009</strong>. These<br />
actions resulted in a reduction of our <strong>2009</strong> annual benefit expense<br />
of $3.7 million and are expected to reduce our future pension fund<br />
contribution requirements by approximately $20 million.<br />
On September 1, <strong>2009</strong>, we adopted changes to our postretirement<br />
healthcare plan whereby, effective January 1, 2010,<br />
the plan, for certain eligible retirees, was discontinued, and benefits<br />
will be phased out through December 31, 2012. As a result of<br />
the plan change, our liability for post-retirement healthcare was<br />
reduced by $58.1 million.<br />
Highlights and Executive Summary<br />
Selected Financial Data<br />
(In millions) <strong>2009</strong> 2008 2007<br />
Sales $2,060.7 $2,738.7 $2,642.7<br />
Operating income (loss) $ 98.4 $ (129.3) $ 33.9<br />
Net income (loss) $ 67.8 $ (272.9) $ 11.4<br />
Cash and cash equivalents $ 222.7 $ 44.3 $ 79.4<br />
Accounts receivable availability 112.8 121.4 151.2<br />
Liquidity $ 335.5 $ 165.7 $ 230.6<br />
Debt, short- and long-term $ 409.6 $ 434.3 $ 336.7<br />
<strong>2009</strong> vs. 2008<br />
The decrease in sales was primarily attributable to a 21.6% decline<br />
in volume in <strong>2009</strong> as compared to 2008, reflecting the adverse<br />
impact of the global recession on demand levels across all end<br />
markets. Particularly hardest hit were the transportation and building<br />
and construction end markets. Additionally, changes in currency<br />
exchange rates had a negative impact on sales of approximately 3%<br />
in <strong>2009</strong>.<br />
The improvement in operating income for <strong>2009</strong> reflects the<br />
favorable impact of higher margin business gains, lower raw material<br />
costs, the realization of restructuring savings, and an incremental<br />
benefit from LIFO related to the significant inventory reduction in<br />
POLYONE CORPORATION<br />
17
the United States. These factors more than offset the impact of the<br />
decrease in volumes and the negative impact of changes in currency<br />
exchange rates in <strong>2009</strong>. Operating income in <strong>2009</strong> also included<br />
gains of $21.9 million associated with the curtailment of certain of<br />
our employee benefit plans, $23.9 million related to the reimbursement<br />
of previously incurred environmental costs and a $2.8 million<br />
gain associated with the sale of our interest in a previously 50%<br />
owned equity affiliate, GPA. We recognized charges of $27.2 million<br />
related to restructuring and employee separation in <strong>2009</strong> as compared<br />
to $39.7 million in 2008. Our operating income was also<br />
negatively impacted by a $170.0 million goodwill impairment charge<br />
in 2008, and a subsequent $5.0 million charge to finalize this<br />
preliminary estimate in the first quarter of <strong>2009</strong>. Changes in currency<br />
exchange rates unfavorably impacted operating income by<br />
$5.2 million in <strong>2009</strong> as compared to 2008, driven primarily by<br />
changes in the U.S. dollar versus the Euro and Canadian dollar.<br />
The increase in net income in <strong>2009</strong> as compared to 2008 was<br />
primarily due to the items discussed in the paragraph above. Additionally,<br />
net interest expense was lower in <strong>2009</strong> than in the prior<br />
year primarily due to lower average interest rates on our variable<br />
rate debt and a lower average debt balance. Income tax benefit was<br />
$13.3 million in <strong>2009</strong> as compared to expense of $101.8 million in<br />
2008 as the 2008 amount reflects a $105.9 million charge to<br />
record a tax valuation allowance.<br />
Since December 31, 2008, our liquidity increased by<br />
$169.8 million to $335.5 million as the increase in our cash<br />
balance has more than offset the decrease in our borrowing capacity<br />
under the accounts receivable facility. The increase in cash and<br />
cash equivalents of $178.4 million was primarily the result of<br />
improved earnings coupled with substantially lower working capital<br />
investment at December 31, <strong>2009</strong> as compared to December 31,<br />
2008. Our cash balance was favorably impacted by the $23.9 million<br />
reimbursement of previously incurred environmental costs and<br />
$13.5 million of proceeds associated with the sale of our interest in<br />
GPA. These items more than offset the impact of $17.2 million of<br />
pension contributions, $31.3 million of payments in <strong>2009</strong> for our<br />
previously announced restructuring activities, the payment of<br />
$11.5 million related to the acquisition of NEU, the repayment of<br />
$20.0 million aggregate principal amount of our 6.91% mediumterm<br />
notes and a reduction in short-term debt of $5.7 million.<br />
2008 vs. 2007<br />
The acquisition of GLS in January of 2008, the favorable impact<br />
from foreign exchange and higher prices driven by an improved sales<br />
mix and the result of offsetting rising raw material and energy costs<br />
helped counterbalance the adverse impact of lower volume driven<br />
by a significant slowing in global economic activity in the late third<br />
quarter and the fourth quarter of 2008. This downturn in economic<br />
activity and the underlying financial credit crisis that precipitated it<br />
had a significant negative impact on our businesses, particularly the<br />
Performance Products and Solutions segment. The International<br />
Color and Engineered Materials business, while benefiting from<br />
favorable foreign exchange rates, saw demand contract in the third<br />
quarter and then more dramatically in the fourth quarter of 2008 as<br />
the economies in Europe and Asia slowed and declining exports<br />
from Asia offset any sales increase during the prior quarters in<br />
2008.<br />
Operating income declined due to a $170 million goodwill<br />
impairment charge taken in the fourth quarter of 2008, $39.7 million<br />
of restructuring charges, and year-over-year declines in Performance<br />
Products and Solutions and International Color and<br />
Engineered Materials segment operating income. The acquisition<br />
of GLS, margin and mix improvements and the impact from foreign<br />
exchange were favorable items that partially offset the overall<br />
decrease.<br />
The decline in net income was due to the items described<br />
previously and the recording of a $105.9 million tax valuation<br />
allowance.<br />
Liquidity declined $64.9 million due to a lower available pool of<br />
receivables to sell and a year-over-year decline in cash and cash<br />
equivalents driven by a higher investment in working capital, pension<br />
funding, and lower dividends from our equity affiliates due<br />
primarily to the divestiture of our ownership stake in OxyVinyls. The<br />
increase in total debt resulted from the financing activities necessary<br />
to support the acquisition of GLS.<br />
POLYONE CORPORATION<br />
18
Results of Operations<br />
Variances—Favorable (Unfavorable)<br />
<strong>2009</strong> versus 2008 2008 versus 2007<br />
%<br />
Change<br />
%<br />
Change<br />
(Dollars in millions, except per share data) <strong>2009</strong> 2008 2007 Change<br />
Change<br />
Sales $2,060.7 $2,738.7 $2,642.7 $(678.0) (24.8)% $ 96.0 3.6%<br />
Cost of sales 1,720.2 2,442.1 2,381.7 721.9 29.6% (60.4) (2.5)%<br />
Gross margin 340.5 296.6 261.0 43.9 14.8% 35.6 13.6%<br />
Selling and administrative 272.3 287.1 254.8 14.8 5.2% (32.3) (12.7)%<br />
Impairment of goodwill 5.0 170.0 — 165.0 NM (170.0) NM<br />
Income from equity affiliates and minority interest 35.2 31.2 27.7 4.0 12.8% 3.5 12.6%<br />
Operating income (loss) 98.4 (129.3) 33.9 227.7 NM (163.2) NM<br />
Interest expense, net (34.3) (37.2) (46.9) 2.9 7.8% 9.7 20.7%<br />
Premium on early extinguishment of long-term debt — — (12.8) — — 12.8 100.0%<br />
Other expense, net (9.6) (4.6) (6.6) (5.0) (108.7)% 2.0 30.3%<br />
Income (loss) before income taxes 54.5 (171.1) (32.4) 225.6 NM (138.7) NM<br />
Income tax benefit (expense) 13.3 (101.8) 43.8 115.1 NM (145.6) NM<br />
Net income (loss) $ 67.8 $ (272.9) $ 11.4 $ 340.7 NM $(284.3) NM<br />
Basic and diluted (loss) earnings per common share: $ 0.73 $ (2.94) $ 0.12<br />
NM — Not meaningful<br />
Sales<br />
Sales decreased in <strong>2009</strong> as compared to 2008 due to a decrease<br />
in volume of 21.6% and the unfavorable impact of foreign exchange<br />
on sales of approximately 3%. All operating segments experienced a<br />
decline in sales in <strong>2009</strong>. The end markets most impacted globally<br />
were transportation and building and construction.<br />
The increase in sales in 2008, as compared to 2007, includes<br />
6.3% from acquisitions and other, 1.7% due to the favorable impact<br />
of foreign exchange, and a 9.7% favorable impact from price and<br />
mix, which offset an unfavorable impact of 14.1% due to the decline<br />
in volume. The impact of the decline in volume was evident across<br />
all of our operating segments but of greatest magnitude in our<br />
businesses tied to the North American building and construction<br />
and transportation end markets.<br />
Cost of Sales<br />
These costs include raw materials, plant conversion, distribution,<br />
environmental remediation and plant related restructuring charges.<br />
As a percentage of sales, these costs declined to 83.5% of sales in<br />
<strong>2009</strong> as compared to 89.2% in 2008. Cost of sales in <strong>2009</strong><br />
includes a gain of $23.9 million associated with the reimbursement<br />
of previously incurred environmental costs. Charges related to<br />
environmental remediation and plant related restructuring were<br />
$36.1 million in <strong>2009</strong> as compared to $44.9 million in 2008.<br />
The benefit of LIFO, primarily related to inventory reductions in<br />
the United States, favorably impacted cost of sales by $18.3 million,<br />
as compared to $4.6 million in 2008. Additionally, lower raw material<br />
costs and the realization of restructuring savings favorably<br />
impacted cost of goods sold in <strong>2009</strong> as compared to 2008.<br />
As a percentage of sales, these costs declined to 89.2% of<br />
sales in 2008 as compared to 90.1% in 2007. GLS contributed<br />
0.5 percentage points of the improvement reflecting the margin<br />
impact of its specialty sales mix. Charges related to environmental<br />
remediation and plant related restructurings were $44.9 million in<br />
2008 as compared to $50.2 million in 2007. The remaining<br />
decrease in cost of sales is due to the realization of pricing initiatives<br />
and sales mix improvements partially offset by higher raw<br />
material costs.<br />
Selling and Administrative<br />
These costs include selling, technology, administrative functions<br />
and corporate and general expenses. Selling and administrative<br />
costs decreased $14.8 million, or 5.2%, in <strong>2009</strong> as compared to<br />
2008. Favorably impacting selling and administrative costs was<br />
$21.9 million of curtailment gains, $7.6 million less employee<br />
separation and plant phase-out costs, a decrease in insurance<br />
and bad debt expense and savings from our restructuring activities.<br />
These favorable items were partially offset by increased pension<br />
and incentive compensation expenses.<br />
During 2008, selling and administrative costs increased<br />
$32.3 million, or 12.7%, as compared to 2007. Selling and administrative<br />
costs was negatively impacted by an increase of $9.6 million<br />
for employee separation and approximately $17.5 million of<br />
incremental costs associated with GLS, which was acquired in<br />
January of 2008.<br />
Impairment of Goodwill<br />
During the fourth quarter of 2008, we identified indicators of<br />
potential impairment and evaluated the carrying values of goodwill<br />
and other intangible and long-lived assets. Due to the extensive<br />
work involved in performing the related asset appraisals, we initially<br />
recognized a preliminary estimate of the impairment loss of<br />
$170.0 million in 2008. Upon completion of the analysis in the<br />
POLYONE CORPORATION<br />
19
POLYONE CORPORATION<br />
first quarter of <strong>2009</strong>, we revised our estimate of goodwill impairment<br />
to $175.0 million, of which $147.8 million and $27.2 million<br />
related to the Geon Compounds and Specialty Coatings reporting<br />
units, respectively. This represented a decrease for Geon Compounds<br />
of $7.4 million and an increase in the goodwill impairment<br />
charge for Specialty Coatings of $12.4 million, as compared to the<br />
preliminary estimates recorded in the fourth quarter of 2008.<br />
Income from Equity Affiliates<br />
Income from equity affiliates for <strong>2009</strong>, 2008 and 2007 is summarized<br />
as follows:<br />
(In millions) <strong>2009</strong> 2008 2007<br />
SunBelt $29.7 $32.5 $ 41.0<br />
Other equity affiliates 2.7 3.4 3.1<br />
Impairment of OxyVinyls investment — — (14.8)<br />
Gain on sale and (charges) related to<br />
investment in GPA 2.8 (4.7) (1.6)<br />
$35.2 $31.2 $ 27.7<br />
During <strong>2009</strong>, income from equity affiliates increased $4.0 million,<br />
or 12.8%, as compared to 2008. In 2008, we recorded<br />
$4.7 million of charges related to our investment in GPA, a 50%<br />
owned equity affiliate. In <strong>2009</strong>, we sold our investment in GPA,<br />
resulting in a pre-tax gain of $2.8 million. Additionally, lower earnings<br />
from our SunBelt joint venture for <strong>2009</strong> were due primarily to<br />
lower pricing for caustic soda, partially offset by an increase in<br />
pricing and volume for chlorine as compared to 2008.<br />
During 2008, income from equity affiliates increased $3.5 million,<br />
or 12.6%, versus 2007. The increase was due to $11.7 million<br />
lower impairment charges recorded in 2008 as compared to 2007,<br />
partially offset by lower SunBelt earnings. The $8.5 million lower<br />
SunBelt earnings were mainly due to lower demand for chlorine in<br />
the downstream PVC resin markets as a result of the significant<br />
deterioration of the North American building and construction and<br />
basic infrastructure markets.<br />
Interest Expense, Net<br />
Interest expense, net decreased in <strong>2009</strong> as compared to 2008 due<br />
to lower average borrowing levels and lower interest rates on our<br />
variable rate debt. Interest expense decreased in 2008 as compared<br />
to 2007 due to lower average borrowing levels.<br />
Included in interest expense, net for the years ended December<br />
31, <strong>2009</strong>, 2008 and 2007 is interest income of $3.2 million,<br />
$3.4 million and $4.5 million, respectively.<br />
Premium on Early Extinguishment of Long-term Debt<br />
Cash expense from the premium on our repurchase of $241.4 million<br />
aggregate principal amount of our 10.625% senior notes in<br />
2007 was $12.8 million.<br />
Other Expense, Net<br />
Financing costs associated with our receivables sale facility, foreign<br />
currency gains and losses and other miscellaneous items are as<br />
follows:<br />
(In millions) <strong>2009</strong> 2008 2007<br />
Currency exchange gain (loss) $(0.1) $ 1.2 $(5.0)<br />
Foreign exchange contracts (loss) gain (7.9) (1.3) 0.7<br />
Fees and discount on sale of trade<br />
receivables (1.3) (3.6) (2.0)<br />
Impairment of available for sale security — (0.6) —<br />
Other expense, net (0.3) (0.3) (0.3)<br />
Other expense, net $(9.6) $(4.6) $(6.6)<br />
Income Tax (Expense) Benefit<br />
In <strong>2009</strong>, we recorded tax benefit of $13.3 million related primarily to<br />
tax refunds in both U.S. and foreign jurisdictions.<br />
We also decreased our existing deferred tax asset valuation<br />
allowances related to various U.S. federal, state and foreign<br />
deferred tax assets by $54.6 million in <strong>2009</strong>, resulting in a noncash<br />
tax benefit of $23.8 million. The remaining decrease of<br />
$30.8 million related primarily to changes in our liabilities for<br />
pensions and other post-retirement benefits, for which the tax<br />
impact is recorded in accumulated other comprehensive income.<br />
We review all valuation allowances related to deferred tax assets<br />
and will adjust these reserves when appropriate.<br />
We have U.S. federal net operating loss carryforwards of<br />
$66.0 million which expire at various dates from 2024 through<br />
2028 and combined state net operating loss carryforwards of<br />
$314.6 million which expire at various dates from 2010 through<br />
2029. Various foreign subsidiaries have net operating loss carryforwards<br />
totaling $34.5 million which expire at various dates from<br />
2010 through 2019. We have provided valuation allowances of<br />
$42.9 million against these loss carryforwards.<br />
Segment Information<br />
Operating income is the primary financial measure that is reported<br />
to the chief operating decision maker for purposes of making<br />
decisions about allocating resources to the segment and assessing<br />
its performance. Operating income at the segment level does not<br />
include: corporate general and administrative costs that are not<br />
allocated to segments; intersegment sales and profit eliminations;<br />
charges related to specific strategic initiatives, such as the consolidation<br />
of operations; restructuring activities, including employee<br />
separation costs resulting from personnel reduction programs,<br />
plant closure and phaseout costs; executive separation agreements;<br />
share-based compensation costs; asset and goodwill<br />
impairments; environmental remediation costs for facilities no<br />
longer owned or closed in prior years; gains and losses on the<br />
divestiture of joint ventures and equity investments; and certain<br />
other items that are not included in the measure of segment profit or<br />
loss that is reported to and reviewed by the chief operating decision<br />
maker. These costs are included in Corporate and eliminations.<br />
20
Sales and Operating Income (Loss) — <strong>2009</strong> compared with 2008:<br />
(Dollars in millions) <strong>2009</strong> 2008 Change % Change<br />
Sales:<br />
International Color and<br />
Engineered Materials $ 459.4 $ 587.4 $(128.0) (21.8)%<br />
Specialty Engineered<br />
Materials 208.6 252.3 (43.7) (17.3)%<br />
Specialty Color,<br />
Additives and Inks 194.7 228.6 (33.9) (14.8)%<br />
Performance Products<br />
and Solutions 667.7 1,001.4 (333.7) (33.3)%<br />
<strong>PolyOne</strong> Distribution 625.1 796.7 (171.6) (21.5)%<br />
Corporate and<br />
eliminations (94.8) (127.7) 32.9 25.8%<br />
$2,060.7 $2,738.7 $(678.0) (24.8)%<br />
Operating income<br />
(loss):<br />
International Color and<br />
Engineered Materials $ 22.6 $ 20.4 $ 2.2 10.8%<br />
Specialty Engineered<br />
Materials 16.2 12.9 3.3 25.6%<br />
Specialty Color,<br />
Additives and Inks 14.2 13.5 0.7 5.2%<br />
Performance Products<br />
and Solutions 43.5 34.9 8.6 24.6%<br />
<strong>PolyOne</strong> Distribution 24.8 28.1 (3.3) (11.7)%<br />
Resin and<br />
Intermediates 25.5 28.6 (3.1) (10.8)%<br />
Corporate and<br />
eliminations (48.4) (267.7) 219.3 (81.9)%<br />
$ 98.4 $ (129.3) $ 227.7 (176.1)%<br />
Operating income (loss)<br />
as a percentage of<br />
sales:<br />
International Color and<br />
Engineered Materials 4.9% 3.5% 1.4% points<br />
Specialty Engineered<br />
Materials 7.8% 5.1% 2.7% points<br />
Specialty Color,<br />
Additives and Inks 7.3% 5.9% 1.4% points<br />
Performance Products<br />
and Solutions 6.5% 3.5% 3.0% points<br />
<strong>PolyOne</strong> Distribution 4.0% 3.5% 0.5% points<br />
Total 4.8% (4.7)% 9.5% points<br />
International Color and Engineered Materials<br />
Sales decreased $128.0 million, or 21.8%, in <strong>2009</strong> as compared to<br />
2008. Approximately 17.9% of the decrease was due to lower<br />
volumes as a result of the effects of the global recession on<br />
demand levels in Europe and Asia. Changes in currency exchange<br />
rates in <strong>2009</strong> resulted in a decrease in sales of approximately 6.2%.<br />
These unfavorable items were partially offset by improvement in the<br />
price and mix of products sold.<br />
Operating income increased by $2.2 million, or 10.8%, in <strong>2009</strong><br />
compared to 2008 driven by declining raw material costs, improved<br />
product mix and pricing, the realization of savings from our restructuring<br />
programs and reduced discretionary spending. These favorable<br />
items were partially offset by lower volumes and changes in<br />
currency exchange rates.<br />
Specialty Engineered Materials<br />
Sales decreased $43.7 million, or 17.3%, in <strong>2009</strong> as compared to<br />
2008 due to the decreased demand in our end markets related to<br />
transportation and wire and cable applications. Volumes declined<br />
approximately 19.7% in <strong>2009</strong> as compared to 2008. Partially offsetting<br />
the impact of lower volume were improvements in pricing<br />
and sales mix.<br />
Operating income increased $3.3 million, or 25.6%, in <strong>2009</strong> as<br />
compared to 2008 driven primarily by lower raw material costs, the<br />
realization of savings from restructuring and the change in the LIFO<br />
reserve related to the inventory reduction in the United States.<br />
These items more than offset the impact of declines in volumes.<br />
Also contributing to the improved income results is the continued<br />
successful integration of GLS, which was acquired in 2008.<br />
Specialty Color, Additives and Inks<br />
Sales declined $33.9 million, or 14.8%, in <strong>2009</strong> as compared to<br />
2008 as volume declined 16.7% due primarily to decreased<br />
demand in the transportation and packaging end markets. Partially<br />
offsetting the impact of lower volume was a higher value sales mix<br />
driven by business gains in specialty type applications.<br />
Operating income increased $0.7 million, or 5.2%, primarily<br />
due to the benefits of a more profitable sales mix, lower raw<br />
material costs, the benefit from LIFO related to the inventory reduction<br />
in the United States and decreased discretionary spending, all<br />
of which offset the adverse impact of the decline in volumes.<br />
Performance Products and Solutions<br />
Sales decreased $333.7 million, or 33.3%, in <strong>2009</strong> as compared to<br />
2008 due to the decreased demand across all end markets, particularly<br />
those related to the North American building and construction<br />
market. Volumes declined 27.8% in <strong>2009</strong> as compared to 2008.<br />
Lower market prices associated with lower commodity costs resulted<br />
in a 5.7% decline in sales during <strong>2009</strong> as compared to 2008.<br />
Operating income increased $8.6 million, or 24.6%, in <strong>2009</strong> as<br />
compared to 2008 despite lower volume. LIFO reserve changes<br />
added $11.0 million to operating income in <strong>2009</strong> versus $3.2 million<br />
in 2008. Beyond that, decreased raw material costs and savings from<br />
restructuring more than offset the impact of the decline in volumes.<br />
<strong>PolyOne</strong> Distribution<br />
<strong>PolyOne</strong> Distribution sales decreased $171.6 million, or 21.5%, in<br />
<strong>2009</strong> as compared to 2008, as volumes declined 12.1%, with the<br />
remainder due to lower market pricing associated with lower commodity<br />
costs.<br />
POLYONE CORPORATION<br />
21
Operating income decreased $3.3 million, or 11.7%, in <strong>2009</strong><br />
as compared to 2008 due primarily to the decline in volume.<br />
Resin and Intermediates<br />
During <strong>2009</strong>, income from equity affiliates included in Resin and<br />
Intermediates decreased $3.1 million due to lower earnings from<br />
our SunBelt joint venture.<br />
Corporate and Eliminations<br />
Operating loss from Corporate and eliminations was $48.4 million<br />
in <strong>2009</strong> as compared to $267.7 million in 2008 as summarized in<br />
the following table:<br />
(In millions)<br />
Year Ended<br />
December 31,<br />
<strong>2009</strong><br />
Year Ended<br />
December 31,<br />
2008<br />
Curtailment of post-retirement health care<br />
plan and other (a) $ 21.9 $ —<br />
Impairment of goodwill (b) (5.0) (170.0)<br />
Environmental remediation costs, net of<br />
recoveries (c) 12.2 (15.6)<br />
Employee separation and plant<br />
phaseout (d) (27.2) (39.7)<br />
Recognition of inventory step-up<br />
associated with GLS acquisition (e) — (1.6)<br />
Gain on sale and (charges) related to<br />
investment in equity affiliate (f) 2.8 (4.7)<br />
Share-based compensation (2.6) (3.0)<br />
Incentive compensation (19.6) (4.2)<br />
Unallocated pension and post-retirement<br />
medical expense (13.6) (5.4)<br />
All other and eliminations (g) (17.3) (23.5)<br />
Total Corporate and eliminations $(48.4) $(267.7)<br />
(a)<br />
(b)<br />
(c)<br />
(d)<br />
(e)<br />
(f)<br />
(g)<br />
During the third quarter of <strong>2009</strong>, we amended certain of our postretirement<br />
healthcare plans whereby benefits to be paid under<br />
these plans will be phased out through 2012, resulting in a curtailment<br />
gain of $21.1 million. We also recorded curtailment gains<br />
totaling approximately $0.8 million related to other employee benefit<br />
plans.<br />
In the first quarter of <strong>2009</strong>, we increased our estimated year-end<br />
goodwill impairment charge of $170.0 million by $5.0 million, which<br />
is comprised of an increase of $12.4 million related to our Specialty<br />
Coatings reporting unit and a decrease of $7.4 million to our Geon<br />
Compounds reporting unit. See Note 2, Goodwill, to the accompanying<br />
consolidated financial statements for further information.<br />
During the third quarter of <strong>2009</strong>, we received $23.9 million from our<br />
former parent company, as partial reimbursement for certain previously<br />
incurred environmental remediation costs.<br />
During the third quarter of 2008 and subsequently in January <strong>2009</strong>,<br />
we announced the restructuring of certain manufacturing assets,<br />
primarily in North America. See Note 3, Employee Separation and<br />
Plant Phaseout, to the accompanying consolidated financial statements<br />
for further information.<br />
Upon acquisition of GLS in 2008, GLS’s inventory was initially<br />
stepped up from cost to fair value. This difference was recognized<br />
with the first turn of inventory within Corporate and eliminations.<br />
On October 13, <strong>2009</strong>, we sold our 50% interest in GPA, previously<br />
part of the Performance Products and Solutions operating segment,<br />
to Mexichem Compuestos, S.A. de C.V, resulting in a pre-tax<br />
gain of approximately $2.8 million in our <strong>2009</strong> results of operations.<br />
In the third quarter of 2008, we recorded $2.6 million related<br />
to our proportionate share of the write-down of certain assets by<br />
GPA and a $2.1 million charge related to an impairment of our<br />
investment in this equity affiliate.<br />
All other and eliminations is comprised of intersegment eliminations<br />
and corporate general and administrative costs that are not<br />
allocated to segments.<br />
POLYONE CORPORATION<br />
22
Sales and Operating Income (Loss) — 2008 compared with<br />
2007:<br />
(Dollars in millions) 2008 2007 Change % Change<br />
Sales:<br />
International Color and<br />
Engineered Materials $ 587.4 $ 588.6 $ (1.2) (0.2)%<br />
Specialty Engineered<br />
Materials 252.3 124.3 128.0 103.0%<br />
Specialty Color,<br />
Additives and Inks 228.6 232.0 (3.4) (1.5)%<br />
Performance Products<br />
and Solutions 1,001.4 1,086.8 (85.4) (7.9)%<br />
<strong>PolyOne</strong> Distribution 796.7 744.3 52.4 7.0%<br />
Corporate and<br />
eliminations (127.7) (133.3) 5.6 4.2%<br />
$2,738.7 $2,642.7 $ 96.0 3.6%<br />
Operating income<br />
(loss):<br />
International Color and<br />
Engineered Materials $ 20.4 $ 25.1 $ (4.7) (18.7)%<br />
Specialty Engineered<br />
Materials 12.9 (2.2) 15.1 686.4%<br />
Specialty Color,<br />
Additives and Inks 13.5 7.0 6.5 92.9%<br />
Performance Products<br />
and Solutions 34.9 57.5 (22.6) (39.3)%<br />
<strong>PolyOne</strong> Distribution 28.1 22.1 6.0 27.1%<br />
Resin and<br />
Intermediates 28.6 34.8 (6.2) (17.8)%<br />
Corporate and<br />
eliminations (267.7) (110.4) (157.3) (142.5)%<br />
$ (129.3) $ 33.9 $(163.2) (481.4)%<br />
Operating income (loss)<br />
as a percentage of<br />
sales:<br />
International Color and<br />
Engineered Materials 3.5% 4.3% (0.8)% points<br />
Specialty Engineered<br />
Materials 5.1% (1.8)% 6.9% points<br />
Specialty Color,<br />
Additives and Inks 5.9% 3.0% 2.9% points<br />
Performance Products<br />
and Solutions 3.5% 5.3% (1.8)% points<br />
<strong>PolyOne</strong> Distribution 3.5% 3.0% 0.5% points<br />
Total (4.7)% 1.3% (6.0)% points<br />
International Color and Engineered Materials<br />
Sales declined $1.2 million, or 0.2%, in 2008 as weakening<br />
demand in the second half of 2008 in both Europe and Asia offset<br />
higher pricing and a $42.6 million favorable impact from foreign<br />
exchange. Volumes declined 11.1%.<br />
Operating income declined $4.7 million, or 18.7%, in 2008<br />
despite the favorable impact of foreign exchange of $2.2 million.<br />
Continued progress in improving the sales mix through the penetration<br />
of specialty applications in the packaging, electrical and<br />
electronics, specialty wire and cable and transportation end markets<br />
did not offset the adverse impact of the substantial weakening<br />
of demand in the fourth quarter of 2008.<br />
Specialty Engineered Materials<br />
Sales increased $128.0 million, or 103.0%, in 2008 compared to<br />
2007 primarily due to the acquisition of GLS. GLS continued to<br />
demonstrate its ability to grow its specialty mix of applications in the<br />
healthcare, consumer products and medical end markets. Partially<br />
offsetting the favorable benefit to sales from the acquisition of GLS<br />
was lower demand for wire and cable and general purpose products<br />
that go into the North American building and construction and<br />
transportation end markets.<br />
Operating income increased $15.1 million in 2008 driven primarily<br />
by the GLS acquisition and the elimination of unprofitable<br />
accounts.<br />
Specialty Color, Additives and Inks<br />
Sales declined $3.4 million, or 1.5%, in 2008 as volume declined<br />
10.7%. Partially mitigating the impact of lower volume was a higher<br />
value sales mix driven by a greater focus on capturing specialty type<br />
applications and higher pricing to offset increased raw material<br />
costs.<br />
Operating income improved $6.5 million in 2008 driven by the<br />
combined effect of a more profitable sales mix, cost reduction<br />
initiatives in operations, and a focused effort on culling unprofitable<br />
business.<br />
Performance Products and Solutions<br />
Sales declined $85.4 million, or 7.9%, in 2008 due primarily to<br />
significantly lower demand in the North American building and<br />
construction and transportation markets. Volume declined<br />
19.9%. Favorable items impacting sales were higher prices due<br />
to rising raw material costs and an improved sales mix.<br />
Operating income declined $22.6 million, or 39.3%, in 2008 as<br />
compared to 2007 due to lower demand and because selling price<br />
increases did not offset higher raw material costs. Falling raw<br />
material costs and reduced inventory resulted in a favorable LIFO<br />
reserve adjustment of $3.2 million for the year.<br />
<strong>PolyOne</strong> Distribution<br />
<strong>PolyOne</strong> Distribution sales increased $52.4 million, or 7.0%, in<br />
2008 despite lower volumes. The combined impact of price<br />
increases to offset increasing raw material costs, continued growth<br />
in higher value end markets, such as healthcare and consumer<br />
products, and the success of a national accounts program offset<br />
the impact of declining volume.<br />
POLYONE CORPORATION<br />
23
POLYONE CORPORATION<br />
Operating income increased $6.0 million, or 27.1%, in 2008<br />
driven by a more profitable sales mix, margin benefits realized as a<br />
result of increased market prices, cost containment programs to<br />
mitigate rising transportation and distribution costs, and the cumulative<br />
impact of various margin improvement programs.<br />
Resin and Intermediates<br />
Operating income declined $6.2 million, or 17.8%, in 2008 driven by<br />
a 20.8% volume decline driven partially by force majeure claims<br />
from SunBelt’s sole chlorine customer, OxyVinyls. In December,<br />
OxyVinyls declared force majeure due to a plant shutdown. In the<br />
third quarter of 2008, OxyVinyls declared force majeure due to the<br />
combined effect of Hurricanes Gustav and Ike.<br />
Corporate and Eliminations<br />
Operating loss from Corporate and eliminations was<br />
$157.3 million higher in 2008 due mainly to a $170 million impairment<br />
of goodwill, higher year-over-year restructuring charges offset<br />
partially by lower environmental remediation charges. In 2008, we<br />
recorded environmental remediation, restructuring and impairment<br />
charges of $229.0 million as compared to $69.9 million of similar<br />
charges recorded in 2007. The following table breaks down Corporate<br />
and eliminations into its various components:<br />
(In millions)<br />
Year Ended<br />
December 31,<br />
2008<br />
Year Ended<br />
December 31,<br />
2007<br />
Impairment of goodwill(a) $(170.0) $ —<br />
Environmental remediation costs(b) (15.6) (33.2)<br />
Employee separation and plant<br />
phaseout(c) (39.7) (2.2)<br />
Charges related to investment in equity<br />
affiliate(d) (4.7) (1.6)<br />
Share-based compensation (3.0) (4.3)<br />
Impairment of OxyVinyls equity<br />
investment(e) — (14.8)<br />
Settlement of environmental costs related<br />
to Calvert City(f) — (15.6)<br />
Impairment of intangibles and other<br />
investments(g) — (2.5)<br />
Cost related to sale of OxyVinyls equity<br />
investment — (0.4)<br />
Gain on sale of assets(h) — 2.5<br />
All other and eliminations(i) (34.7) (38.3)<br />
(a)<br />
(b)<br />
Total Corporate and eliminations $(267.7) $(110.4)<br />
In the fourth quarter of 2008, we recognized a non-cash goodwill<br />
impairment charge of $170.0 million related to our Geon Compounds<br />
and Specialty Coatings reporting units within the Performance<br />
Products and Solutions segment. See Note 2, Goodwill and<br />
Other Intangibles, to the accompanying consolidated financial<br />
statements for further information.<br />
In the third quarter of 2007, our accrual for costs related to future<br />
remediation at inactive or formerly owned sites was adjusted based<br />
on a U.S. District Court’s rulings on several motions in the case of<br />
Westlake Vinyls, Inc. v. Goodrich Corporation et al. and a settlement<br />
(c)<br />
(d)<br />
(e)<br />
(f)<br />
(g)<br />
(h)<br />
(i)<br />
agreement entered into in connection with the case, which requires<br />
us to pay remediation costs related to the Calvert City facility.<br />
During the third quarter of 2008 and subsequently in January <strong>2009</strong>,<br />
we announced the restructuring of certain manufacturing assets,<br />
primarily in North America. See Note 3, Employee Separation and<br />
Plant Phaseout, to the accompanying consolidated financial statements<br />
for further information.<br />
In the third quarter of 2008 and 2007, we recorded $2.6 million<br />
and $1.6 million, respectively, related to our proportionate share of<br />
the write-down of certain assets by GPA, our former equity affiliate<br />
in Columbia. Also, in the third quarter of 2008, we recorded a<br />
$2.1 million charge related to our proportionate share of an impairment<br />
of our investment in this former equity affiliate.<br />
Our 24% equity investment in OxyVinyls was adjusted at June 30,<br />
2007 as the carrying value was higher than the fair value and the<br />
decrease was determined to be an other than temporary decline in<br />
value.<br />
In the third quarter of 2007, we accrued $15.6 million to reimburse<br />
Goodrich Corporation for remediation costs paid on our behalf and<br />
certain legal costs related to the Calvert City facility.<br />
An impairment of the carrying value of certain patents and technology<br />
agreements and investments of $2.5 million was recorded<br />
during 2007.<br />
The gains on sale of assets in 2007 relates to the sale of previously<br />
closed facilities and other assets.<br />
All other and eliminations is comprised of intersegment eliminations<br />
and corporate general and administrative costs that are not<br />
allocated to segments.<br />
Liquidity and Capital Resources<br />
As of December 31,<br />
(In millions) <strong>2009</strong> 2008<br />
Cash and cash equivalents $222.7 $ 44.3<br />
Accounts receivable availability 112.8 121.4<br />
Liquidity $335.5 $165.7<br />
Liquidity is defined as an enterprise’s ability to generate adequate<br />
amounts of cash to meet both current and future needs. These<br />
needs include paying obligations as they mature, maintaining production<br />
capacity and providing for planned growth. Capital<br />
resources are sources of funds other than those generated by<br />
operations.<br />
Liquidity increased as of December 31, <strong>2009</strong> compared to<br />
December 31, 2008 primarily as a result of the increase in cash<br />
associated with improved earnings and the reduction in working<br />
capital investment since the beginning of <strong>2009</strong>. The reduction in<br />
working capital is reflective of our efforts to increase inventory<br />
efficiency, and improve the timing between customer receipt and<br />
vendor payments. Our cash balance was also favorably impacted by<br />
the $23.9 million reimbursement of previously incurred environmental<br />
costs and $13.5 million of proceeds associated with the<br />
sale of our interest in GPA. These items more than offset the impact<br />
of $17.2 million of pension contributions and $31.3 million of<br />
payments in <strong>2009</strong> for our previously announced restructuring activities,<br />
the payment of $11.5 million related to the acquisition of NEU,<br />
the repayment of $20.0 million aggregate principal amount of our<br />
6.91% medium-term notes and the reduction in short-term debt of<br />
24
$5.7 million. Additionally, liquidity was negatively impacted by the<br />
reduction in availability under our receivables sale facility due to the<br />
decrease in our U.S. and Canadian accounts receivable.<br />
Cash Flows<br />
The following discussion focuses on the material components of<br />
cash flows from operating, investing and financing activities.<br />
Operating Activities<br />
(In millions) <strong>2009</strong> 2008 2007<br />
Cash Flows from Operating Activities<br />
Net income (loss) $ 67.8 $(272.9) $ 11.4<br />
Depreciation and amortization 64.8 68.0 57.4<br />
Deferred income tax provision<br />
(benefit) 5.9 89.4 (57.1)<br />
Premium on early extinguishment of<br />
long-term debt — — 12.8<br />
Provision for doubtful accounts 3.3 6.0 1.9<br />
Stock compensation expense 2.6 3.0 4.3<br />
Impairment of goodwill 5.0 170.0 —<br />
Asset write-downs and impairment<br />
charges, net of (gain) on sale of<br />
closed facilities 3.7 3.6 3.3<br />
Companies carried at equity and<br />
minority interest:<br />
Income from equity affiliates and<br />
minority interest (35.2) (31.2) (27.7)<br />
Distributions and distributions<br />
received 36.5 32.9 37.6<br />
Change in assets and liabilities:<br />
Decrease (increase) in accounts<br />
receivable 1.3 60.8 (10.8)<br />
Decrease in inventories 39.1 33.6 26.7<br />
Increase (decrease) in accounts<br />
payable 76.3 (94.7) 17.8<br />
Increase (decrease) in sale of<br />
accounts receivable (14.2) 14.2 —<br />
(Decrease) increase in accrued<br />
expenses and other (27.2) (10.2) (10.4)<br />
Net cash provided by operating<br />
activities $229.7 $ 72.5 $ 67.2<br />
Cash provided by operating activities increased in <strong>2009</strong> as compared<br />
to 2008 due primarily to improved earnings and the previously<br />
described favorable impacts related to improved working capital<br />
performance.<br />
Cash provided by operating activities increased in 2008 as<br />
compared to 2007 due to higher earnings before giving effect to<br />
non-cash restructuring and tax valuation allowance charges, lower<br />
debt extinguishment premiums, lower cash payments for environmental<br />
remediation, and an increase in the sale of accounts receivable,<br />
all of which more than offset higher pension funding.<br />
Investing Activities<br />
(In millions) <strong>2009</strong> 2008 2007<br />
Cash Flows from Investing Activities<br />
Capital expenditures $(31.7) $ (42.5) $ (43.4)<br />
Investment in affiliated company — (1.1) —<br />
Business acquisitions, net of cash<br />
acquired (11.5) (150.2) (11.2)<br />
Proceeds from sale of investment<br />
in equity affiliate and other<br />
assets 17.0 0.3 269.9<br />
Net cash (used) provided by<br />
investing activities $(26.2) $(193.5) $215.3<br />
Net cash used by investing activities in <strong>2009</strong> reflects $13.5 million<br />
of cash proceeds from the sale of our interest in GPA and $3.5 million<br />
of proceeds from the sale of other assets. Capital expenditures<br />
primarily related to maintenance spending and implementing our<br />
restructuring initiatives. Business acquisitions, net of cash<br />
acquired in <strong>2009</strong> reflects cash paid for our acquisition of NEU.<br />
Net cash used by investing activities in 2008 relates primarily<br />
to the $150.2 million to fund the acquisition of GLS and $42.5 million<br />
of capital expenditures. Capital expenditures in 2008 reflect<br />
strategic investments to upgrade our Enterprise Resource Planning<br />
system, expand our global footprint in China and India through<br />
investment in manufacturing and customer specific projects, product<br />
line investments to support our specialization strategy, and the<br />
enablement of the manufacturing restructuring initiative we<br />
announced in July 2008. Spending on strategic projects constituted<br />
approximately 48% of total spending. The remainder of spending<br />
was related to productivity improvement, on-going maintenance of<br />
the asset base and critical environmental, health and safety (EH&S)<br />
projects.<br />
Net cash provided by investing activities in 2007 totaled<br />
$215.3 million, primarily from the proceeds of the sale of our<br />
24% interest in OxyVinyls. In a transaction related to the sale of<br />
our interest in OxyVinyls, we purchased the remaining 10% minority<br />
interest in Powder Blends, LP. Included in the $43.4 million of<br />
capital expenditures were strategic investments to expand our<br />
footprint in Eastern Europe through the building of our Poland<br />
facility, and increase our capabilities to compete in more specialized<br />
end-markets related to additives and liquid color applications.<br />
Spending on strategic projects constituted approximately 42% of<br />
total spending. The remainder of spending was related to productivity<br />
improvement, on-going maintenance of the asset base and<br />
critical EH&S projects.<br />
Capital expenditures are currently estimated to be approximately<br />
$40 million in 2010, primarily to maintain manufacturing<br />
operations, support an implementation of a Enterprise Resource<br />
Planning system in Asia and other strategic spending.<br />
POLYONE CORPORATION<br />
25
POLYONE CORPORATION<br />
Financing Activities<br />
(In millions) <strong>2009</strong> 2008 2007<br />
Cash Flows from Financing Activities<br />
Change in short-term debt $ (5.7) $ 43.3 $ (0.2)<br />
Issuance of long-term debt, net of debt<br />
issuance costs — 77.8 —<br />
Repayment of long-term debt (20.0) (25.3) (264.1)<br />
Purchase of common stock for treasury — (8.9) —<br />
Premium paid on early extinguishment of longterm<br />
debt — — (12.8)<br />
Proceeds from exercise of stock options — 1.1 1.2<br />
Net cash (used) provided by financing<br />
activities $(25.7) $ 88.0 $(275.9)<br />
Cash used by financing activities in <strong>2009</strong> reflects the repayment<br />
of short-term debt and our 6.91% medium-term notes.<br />
Cash provided by financing activities in 2008 was primarily<br />
used for the acquisition of GLS and the funding necessary to<br />
extinguish maturing debt. On January 9, 2008, we borrowed<br />
$40.0 million under the new credit facility. In April 2008, we sold<br />
an additional $80.0 million in aggregate principal amount of<br />
8.875% senior notes due 2012.<br />
Cash used by financing activities in 2007 was primarily for the<br />
extinguishment of debt.<br />
Balance Sheets<br />
The following discussion focuses on material changes in balance<br />
sheet line items from December 31, 2008 to December 31, <strong>2009</strong><br />
that are not discussed in the preceding “Cash Flows” section.<br />
Pension benefits — Our liability for pension benefits<br />
decreased $52.0 million during <strong>2009</strong>, due mainly to the January 15,<br />
<strong>2009</strong> amendments to certain of our pension plans and improved<br />
plan asset returns for the year. These amendments permanently<br />
froze future benefit accruals and reduced our total future pension<br />
fund contributions by approximately $19 million.<br />
Post-retirement benefits other than pension — Our liability for<br />
post-retirement benefits other than pensions decreased by<br />
$59.1 million due primarily to the September 1, <strong>2009</strong> amendments<br />
to certain of our other post-retirement benefit plans. These amendments<br />
resulted in the phase-out of benefits for certain eligible<br />
retirees through December 31, 2012 and reduced our total future<br />
contributions by approximately $58 million.<br />
Capital Resources<br />
As of December 31, <strong>2009</strong>, we had existing facilities to access<br />
capital resources (receivables sale facility, credit facility, medium<br />
term notes and senior unsecured notes and debentures) totaling<br />
$522.4 million. As of December 31, <strong>2009</strong>, we had used $409.6 million<br />
of these facilities, and $112.8 million was available to be<br />
drawn. As of December 31, <strong>2009</strong>, we also had a $222.7 million<br />
cash and cash equivalents balance adding to our available liquidity.<br />
The following table summarizes our available and outstanding<br />
facilities at December 31, <strong>2009</strong>:<br />
(In millions) Outstanding Available<br />
Long-term debt, including current maturities $409.1 $ —<br />
Receivables sale facility — 112.8<br />
Short-term debt 0.5 —<br />
Long-Term Debt<br />
$409.6 $112.8<br />
Our long-term debt matures over the period ranging from 2010 to<br />
2015. Current maturities of long-term debt at December 31, <strong>2009</strong><br />
were $19.9 million.<br />
Guarantee and Agreement<br />
We entered into a definitive Guarantee and Agreement with Citicorp<br />
USA, Inc., KeyBank National Association and National City Bank on<br />
June 6, 2006. Under this Guarantee and Agreement, we guarantee<br />
some treasury management and banking services provided to us<br />
and our subsidiaries, such as foreign currency forwards and bank<br />
overdrafts. This guarantee is secured by our inventories located in<br />
the United States.<br />
Credit Facility<br />
On January 3, 2008, we entered into a credit agreement with<br />
Citicorp USA, Inc., as administrative agent and as issuing bank,<br />
and The Bank of New York, as paying agent. The credit agreement<br />
provides for an unsecured revolving and letter of credit facility with<br />
total commitments of up to $40 million. The credit agreement<br />
expires on March 20, 2011.<br />
Borrowings under the credit facility are based on the applicable<br />
LIBOR rate plus a fixed facility fee of 4.77%. At December 31, <strong>2009</strong>,<br />
we had outstanding borrowings under the credit facility of $40.0 million<br />
that is included in Long-term debt on the accompanying consolidated<br />
balance sheets. The credit agreement contains covenants<br />
that, among other things, restrict our ability to incur liens, and<br />
various other customary provisions, including affirmative and negative<br />
covenants, and representations and warranties. As of<br />
December 31, <strong>2009</strong>, we were in compliance with the covenants<br />
in the credit agreement.<br />
Receivables Sale Facility<br />
The receivables sale facility was amended in June 2007 to extend<br />
the maturity to June 2012 and to, among other things, modify<br />
certain financial covenants and reduce the cost of utilizing the<br />
facility. In July 2007, the receivables sale facility was amended<br />
to include up to $25.0 million of Canadian receivables, which<br />
increased the facility size to $200.0 million. The maximum proceeds<br />
that we may receive are limited to the lesser of $200.0 million<br />
or 85% of the eligible domestic and Canadian accounts receivable<br />
sold. This facility also makes up to $40.0 million available for<br />
26
issuing standby letters of credit as a sub-limit within the $200.0 million<br />
facility, of which $12.8 million was used at December 31, <strong>2009</strong>.<br />
The facility requires us to maintain a minimum fixed charge<br />
coverage ratio (defined as Adjusted EBITDA less capital expenditures,<br />
divided by interest expense and scheduled debt repayments<br />
for the next four quarters) of at least 1 to 1 when average excess<br />
availability under the facility is $40.0 million or less. As of December<br />
31, <strong>2009</strong>, the average excess availability under the facility was<br />
greater than $40.0 million. Additionally, the fixed charge coverage<br />
ratio exceeded 1 to 1.<br />
Notes Receivable<br />
Included in Other current assets as of December 31, <strong>2009</strong> is<br />
$8.1 million outstanding on a seller note receivable due to us from<br />
O’Sullivan Films, which purchased our engineered films business in<br />
February 2006. This note accrues interest at 7% and is due in full<br />
with accrued interest at maturity in December 2010.<br />
Included in Other non-current assets as of December 31, <strong>2009</strong><br />
is $23.5 million outstanding on a seller note receivable due from<br />
Excel Polymers LLC, which purchased our elastomers and performance<br />
additives business in August 2004. During <strong>2009</strong>, we and<br />
Excel agreed to extend the maturity of the seller note to February 29,<br />
2012. As a result of this extension, we were given a secured<br />
position in the assets of the business. This note accrues interest<br />
at 10% per annum and is due in full with accrued interest at maturity.<br />
Concentrations of Credit Risk<br />
Financial instruments, including foreign exchange contracts and<br />
interest rate swap agreements, along with trade accounts receivable<br />
and notes receivable, subject us to potential credit risk. Concentration<br />
of credit risk for trade accounts receivable is limited due<br />
to the large number of customers constituting our customer base<br />
and their distribution among many industries and geographic locations.<br />
We are exposed to credit risk with respect to notes receivable<br />
but we believe collection of the outstanding amounts is probable.<br />
We are exposed to credit risk with respect to forward foreign<br />
exchange contracts and interest rate swap agreements in the event<br />
of non-performance by the counter-parties to these financial instruments.<br />
We believe that the risk of incurring material losses related<br />
to this credit risk is remote. We do not require collateral to support<br />
the financial position of our credit risks.<br />
Of the capital resource facilities available to us as of December<br />
31, <strong>2009</strong>, the portion of the receivables that was actually sold<br />
under the receivables sale facility provided security for the transfer<br />
of ownership of these receivables. Each indenture governing our<br />
senior unsecured notes and debentures and our guarantee of<br />
$48.8 million of SunBelt notes allows a specific level of secured<br />
debt, above which security must be provided on each indenture and<br />
our guarantee of the SunBelt notes. The receivables sale facility and<br />
our guarantee of SunBelt debt are not considered debt under the<br />
covenants associated with our senior unsecured notes and<br />
debentures.<br />
Off-Balance Sheet Arrangements<br />
Receivables sale facility<br />
We sell a portion of our domestic accounts receivable to <strong>PolyOne</strong><br />
Funding Corporation (PFC) and a portion of our Canadian accounts<br />
receivable to <strong>PolyOne</strong> Funding Canada Corporation (PFCC), both<br />
wholly-owned, bankruptcy-remote subsidiaries. At December 31,<br />
<strong>2009</strong>, accounts receivable totaling $151.1 million were sold to<br />
PFC and PFCC. When PFC and PFCC sell an undivided interest in<br />
these accounts receivable to certain third-party investors, such<br />
amounts are reflected as a reduction of accounts receivable in<br />
the accompanying consolidated balance sheets. The maximum<br />
proceeds that PFC and PFCC may receive under the facility is limited<br />
to the lesser of $200.0 million or 85% of the eligible domestic and<br />
Canadian accounts receivable sold. At December 31, <strong>2009</strong>, PFC<br />
and PFCC had not sold any of their undivided interests in accounts<br />
receivable. We believe that available funding under our receivables<br />
sale facility provides us increased flexibility to manage working<br />
capital requirements and is an important source of liquidity.<br />
Guarantee of indebtedness of others<br />
We guarantee $48.8 million of unconsolidated equity affiliate debt<br />
of SunBelt in connection with the construction of a chlor-alkali<br />
facility in McIntosh, Alabama. This debt guarantee matures in 2017.<br />
Letters of credit<br />
The receivables sale facility makes up to $40.0 million available for<br />
the issuance of standby letters of credit, $12.8 million of which was<br />
used at December 31, <strong>2009</strong>. These letters of credit are issued by<br />
the bank in favor of third parties and are mainly related to insurance<br />
claims and interest rate swap agreements.<br />
We have no other off-balance sheet arrangements as defined in<br />
Item 303(a)(4)(ii) of Regulation S-K.<br />
Contractual Obligations<br />
The following table summarizes our obligations under long-term<br />
debt, operating leases, standby letters of credit, interest obligations,<br />
pension and post-retirement obligations, guarantees and<br />
purchase obligations as of December 31, <strong>2009</strong>:<br />
(In millions)<br />
Total<br />
Payment Due by Period<br />
Less than<br />
More than<br />
1 Year 1-3 Years 4-5 Years 5 Years<br />
Contractual Obligations<br />
Long-term debt $409.1 $ 19.9 $339.2 $ — $ 50.0<br />
Operating leases 75.6 19.8 26.3 12.5 17.0<br />
Standby letters of credit 12.8 12.8 — — —<br />
Interest on long-term debt<br />
obligations (1) 88.8 32.2 45.5 7.5 3.6<br />
Pension and post-retirement<br />
obligations (2) 237.6 25.4 80.9 72.4 58.9<br />
Guarantees 48.8 6.1 12.2 12.2 18.3<br />
Purchase obligations 19.6 10.2 7.0 1.7 0.7<br />
Total $892.3 $126.4 $511.1 $106.3 $148.5<br />
POLYONE CORPORATION<br />
27
(1)<br />
Interest obligations are stated at the rate of interest that is defined<br />
by the debt instrument, assuming that the debt is paid at maturity.<br />
(2)<br />
Pension and post-retirement obligations relate to our U.S. and international<br />
pension and other post-retirement plans.<br />
We expect to maintain existing levels of available capital<br />
resources and meet our cash requirements in 2010. Expected<br />
sources of cash in 2010 include cash from operations, additional<br />
borrowings under existing loan agreements that are not fully drawn if<br />
needed, cash distributions from equity affiliates and proceeds from<br />
the sale of previously closed facilities and redundant assets.<br />
Expected uses of cash in 2010 include interest payments, cash<br />
taxes, contributions to our defined benefit pension plan, debt<br />
retirements, environmental remediation at inactive and formerly<br />
owned sites and capital expenditures. Capital expenditures are<br />
currently estimated to be approximately $40 million in 2010, primarily<br />
to maintain manufacturing operations, support an SAP implementation<br />
in Asia and other strategic spending.<br />
We may from time to time seek to retire or purchase our<br />
outstanding debt through cash purchases and/or exchanges for<br />
equity securities, in open market purchases, privately negotiated<br />
transactions or otherwise. Such repurchases or exchanges, if any,<br />
will depend on prevailing market conditions, our liquidity requirements,<br />
contractual restrictions and other factors. The amounts<br />
involved may be material.<br />
Based on current projections, we believe that we will be able to<br />
continue to manage and control working capital, discretionary<br />
spending and capital expenditures and that cash provided by operating<br />
activities, along with available borrowing capacity under our<br />
receivables sale facility, should allow us to maintain adequate<br />
levels of available capital resources to fund our operations and<br />
meet debt service and minimum pension funding requirements for<br />
both the short and long term.<br />
Critical Accounting Policies and Estimates<br />
Significant accounting policies are described more fully in Note 1,<br />
Summary of Significant Accounting Policies, to the accompanying<br />
consolidated financial statements. The preparation of financial<br />
statements in conformity with U.S. generally accepted accounting<br />
principles (U.S. GAAP) requires us to make estimates and assumptions<br />
about future events that affect the amounts reported in our<br />
financial statements and accompanying notes. We base our estimates<br />
on historical experience and assumptions that we believe are<br />
reasonable under the related facts and circumstances. The application<br />
of these critical accounting policies involves the exercise of<br />
judgment and use of assumptions for future uncertainties. Accordingly,<br />
actual results could differ significantly from these estimates.<br />
We believe that the following discussion addresses our most critical<br />
accounting policies, which are those that are the most important to<br />
the portrayal of our financial condition and results of operations and<br />
require our most difficult, subjective and complex judgments. We<br />
have reviewed these critical accounting policies and related disclosures<br />
with the Audit Committee of our Board of Directors.<br />
POLYONE CORPORATION<br />
28
Description<br />
Pension and Other Post-retirement Plans<br />
• We account for our defined benefit pension<br />
plans and other post-retirement plans in<br />
accordance with FASB ASC Topic 715,<br />
Compensation — Retirement Benefits.<br />
Judgments and Uncertainties<br />
Effect if Actual Results<br />
Differ from Assumptions<br />
Goodwill and Intangible Assets<br />
• Goodwill represents the excess of the<br />
purchase price over the fair value of the<br />
net assets of acquired companies. We<br />
follow the guidance in ASC 350,<br />
Intangibles — Goodwill and Other, and test<br />
goodwill for impairment at least annually,<br />
absent a triggering event that would<br />
warrant an impairment assessment. On an<br />
ongoing basis, absent any impairment<br />
indicators, we perform our goodwill<br />
impairment testing as of the first day of<br />
October of each year. The carrying value of<br />
goodwill at December 31, <strong>2009</strong> was<br />
$163.5 million.<br />
• At December 31, <strong>2009</strong>, our balance sheet<br />
reflected $33.2 million associated with the<br />
trade name acquired as part of the<br />
acquisition of GLS.<br />
• Included in our results of operations are<br />
significant amounts associated with our<br />
pension and post-retirement benefit plans<br />
that we measure using actuarial valuations.<br />
Inherent in these valuations are key<br />
assumptions, including assumptions about<br />
discount rates and expected returns on<br />
plan assets. These assumptions are<br />
updated at the beginning of each fiscal<br />
year. We consider current market<br />
conditions, including changes in interest<br />
rates, when making these assumptions.<br />
Changes in pension and post-retirement<br />
benefit costs may occur in the future due<br />
to changes in these assumptions.<br />
• Market conditions and interest rates<br />
significantly affect the value of future<br />
assets and liabilities of our pension and<br />
post-retirement plans. It is difficult to<br />
predict these factors due to the volatility of<br />
market conditions.<br />
• To develop our discount rate, we consider<br />
the yields of high-quality, fixed-income<br />
investments with maturities that correspond<br />
to the timing of our benefit obligations.<br />
• To develop our expected return on plan<br />
assets, we consider our historical longterm<br />
asset return experience, the expected<br />
investment portfolio mix of plan assets and<br />
an estimate of long-term investment<br />
returns. To develop our expected portfolio<br />
mix of plan assets, we consider the<br />
duration of the plan liabilities and give<br />
more weight to equity investments than to<br />
fixed-income securities.<br />
• We have identified our reporting units at<br />
the operating segment level or in some<br />
cases one level below the operating<br />
segment level. Goodwill is allocated to the<br />
reporting units based on the estimated fair<br />
value at the date of acquisition.<br />
• We determine the fair value of our<br />
reporting units using a combination of two<br />
valuation methods; the income approach<br />
and the market approach.<br />
• The income approach requires us to make<br />
assumptions and estimates regarding<br />
projected economic and market conditions,<br />
growth rates, operating margins and cash<br />
expenditures.<br />
• The market approach requires us to make<br />
assumptions and judgments to identify<br />
comparable publicly-traded companies,<br />
trailing twelve-month earnings before<br />
interest, taxes, depreciation and<br />
amortization (EBITDA) and projected EBITDA.<br />
• We have estimated the fair value of the<br />
GLS tradename using a “relief from royalty<br />
payments” approach. This approach<br />
involves two steps (1) estimating<br />
reasonable royalty rate for the tradename<br />
and (2) applying this royalty rate to a net<br />
sales stream and discounting the resulting<br />
cash flows to determine fair value. Fair<br />
value is then compared with the carrying<br />
value of the tradename.<br />
• The weighted average discount rates used<br />
to value our pension and other postretirement<br />
liabilities as of December 31,<br />
<strong>2009</strong> were 6.17% and 5.61%, respectively.<br />
As of December 31, <strong>2009</strong>, an increase/<br />
decrease in the discount rate of 50 basis<br />
points, holding all other assumptions<br />
constant, would have increased or<br />
decreased accumulated other<br />
comprehensive income and the related<br />
pension and post-retirement liability by<br />
approximately $24.4 million.<br />
• The weighted-average expected return on<br />
assets was 8.50% for <strong>2009</strong>, 2008 and<br />
2007. The expected return on assets is a<br />
long-term assumption whose accuracy can<br />
only be measured over a long period based<br />
on past experience. A variation in the<br />
expected return on assets by 50 basis<br />
points as of December 31, <strong>2009</strong> would<br />
result in a change of approximately $1.6<br />
million in net periodic benefit cost.<br />
• If actual results are not consistent with our<br />
assumptions and estimates, we may be<br />
exposed to additional goodwill impairment<br />
charges.<br />
• Based on our <strong>2009</strong> annual impairment<br />
test, the fair value of each of our reporting<br />
units exceeded the corresponding carrying<br />
value by 14% to 82%.<br />
• If actual results are not consistent with our<br />
assumptions and estimates, we may be<br />
exposed to impairment charges related to<br />
our indefinite lived tradenames.<br />
POLYONE CORPORATION<br />
29
Description<br />
Income Taxes<br />
• We account for income taxes using the<br />
asset and liability method. Under the asset<br />
and liability method, deferred tax assets<br />
and liabilities are recognized for the<br />
estimated future tax consequences<br />
attributable to differences between the<br />
financial statement carrying amounts of<br />
existing assets and liabilities and their<br />
respective tax bases. In addition, deferred<br />
tax assets are also recorded with respect<br />
to net operating losses and other tax<br />
attribute carryforwards. Deferred tax<br />
assets and liabilities are measured using<br />
enacted tax rates in effect for the year in<br />
which those temporary differences are<br />
expected to be recovered or settled.<br />
Valuation allowances are established when<br />
realization of the benefit of deferred tax<br />
assets is not deemed to be more likely<br />
than not. The effect on deferred tax assets<br />
and liabilities of a change in tax rates is<br />
recognized in income in the period that<br />
includes the enactment date.<br />
• We recognize net tax benefits under the<br />
recognition and measurement criteria of<br />
ASC Topic 740, Income Taxes, which<br />
prescribes requirements and other<br />
guidance for financial statement<br />
recognition and measurement of positions<br />
taken or expected to be taken on tax<br />
returns. We record interest and penalties<br />
related to uncertain tax positions as a<br />
component of income tax expense.<br />
Environmental Liabilities<br />
• Based upon estimates prepared by our<br />
environmental engineers and consultants,<br />
we have $81.7 million accrued at<br />
December 31, <strong>2009</strong> to cover probable<br />
future environmental remediation<br />
expenditures.<br />
Judgments and Uncertainties<br />
• The ultimate recovery of certain of our<br />
deferred tax assets is dependent on the<br />
amount and timing of taxable income that<br />
we will ultimately generate in the future<br />
and other factors such as the<br />
interpretation of tax laws. This means that<br />
significant estimates and judgments are<br />
required to determine the extent that<br />
valuation allowances should be provided<br />
against deferred tax assets. We have<br />
provided valuation allowances as of<br />
December 31, <strong>2009</strong> aggregating $132.9<br />
million against such assets based on our<br />
current assessment of future operating<br />
results and these other factors.<br />
• This accrual represents our best estimate<br />
of the remaining probable remediation<br />
costs based upon information and<br />
technology currently available and our view<br />
of the most likely remedy. Depending upon<br />
the results of future testing, the ultimate<br />
remediation alternatives undertaken,<br />
changes in regulations, new information,<br />
newly discovered conditions and other<br />
factors; it is reasonably possible that we<br />
could incur additional costs in excess of<br />
the amount accrued. However, such<br />
additional costs, if any, cannot currently be<br />
estimated. Our estimate of this liability<br />
may be revised as new regulations or<br />
technologies are developed or additional<br />
information is obtained. Changes during<br />
the past five years have primarily resulted<br />
from an increase in the estimate of future<br />
remediation costs at existing sites and<br />
payments made each year for remediation<br />
costs that were already accrued.<br />
Effect if Actual Results<br />
Differ from Assumptions<br />
• Although management believes that the<br />
estimates and judgments discussed herein<br />
are reasonable, actual results could differ,<br />
which could result in gains or losses that<br />
could be material.<br />
• If further developments or resolution of<br />
these matters are not consistent with our<br />
assumptions and judgments, we may need<br />
to recognize a significant charge in a future<br />
period.<br />
POLYONE CORPORATION<br />
30
Description<br />
Share-Based Compensation<br />
• We have share-based compensation plans<br />
that include non-qualified stock options,<br />
incentive stock options, restricted stock,<br />
restricted stock units, performance shares,<br />
performance units and stock appreciation<br />
rights (SARs). See Note 15, Share-Based<br />
Compensation, to the accompanying<br />
consolidated financial statements for a<br />
complete discussion of our stock-based<br />
compensation programs.<br />
• We determine the fair value of our SARs<br />
granted in <strong>2009</strong> and 2007 based on a<br />
Monte Carlo simulation method. For SARs<br />
granted during 2008, the option pricing<br />
model used was the Black-Scholes<br />
method.<br />
• We determine the fair value of our marketbased<br />
and performance-based nonvested<br />
share awards at the date of grant using<br />
generally accepted valuation techniques<br />
and the average of the high and low grant<br />
date market price of our stock.<br />
• Management reviews its assumptions and<br />
the valuations provided by independent<br />
third-party valuation advisors to determine<br />
the fair value of share-based compensation<br />
awards.<br />
Judgments and Uncertainties<br />
• Option-pricing models and generally<br />
accepted valuation techniques require<br />
management to make assumptions and to<br />
apply judgment to determine the fair value<br />
of our awards. These assumptions and<br />
judgments include estimating the future<br />
volatility of our stock price, future<br />
employee turnover rates and risk-free rate<br />
of return.<br />
Effect if Actual Results<br />
Differ from Assumptions<br />
• We do not believe there is a reasonable<br />
likelihood there will be a material change in<br />
the future estimates or assumptions we<br />
use to determine share-based<br />
compensation expense. However, if actual<br />
results are not consistent with our<br />
estimates or assumptions, we may be<br />
exposed to changes in share-based<br />
compensation expense that could be<br />
material.<br />
New Accounting Pronouncements —<br />
Consolidation — In June <strong>2009</strong>, the Financial Accounting Standards<br />
Board (FASB) issued new guidance that modifies how a company<br />
determines when an entity that is insufficiently capitalized or is not<br />
controlled through voting (or similar rights) should be consolidated.<br />
The new guidance clarifies that the determination of whether a<br />
company is required to consolidate an entity is based on, among<br />
other things, an entity’s purpose and design and a company’s ability<br />
to direct the activities of the entity that most significantly impact the<br />
entity’s economic performance. A requirement of the new guidance<br />
is an ongoing reassessment of whether a company is the primary<br />
beneficiary of a variable interest entity. Additional disclosures are<br />
also required about a company’s involvement in variable interest<br />
entities and any significant changes in risk exposure due to that<br />
involvement. The new requirements are effective for our fiscal year<br />
beginning January 1, 2010. The adoption of this guidance will not<br />
materially affect our financial statements.<br />
Subsequent Events — In May <strong>2009</strong>, the FASB issued new<br />
guidance to establish general standards of accounting for and<br />
disclosure of events that occur after the balance sheet date but<br />
before financial statements are issued or are available to be issued.<br />
The new guidance also requires entities to disclose the date through<br />
which subsequent events were evaluated as well as the rationale for<br />
the date that was selected and is effective for interim and annual<br />
periods ending after June 15, <strong>2009</strong>. Refer to Note 22, Subsequent<br />
Events.<br />
Fair Value Measurements and Disclosures — In September<br />
2006, the FASB issued new guidance regarding fair value measurements,<br />
which defines fair value, establishes the framework for<br />
measuring fair value under U.S. GAAP and expands disclosures<br />
about fair value measurements. In February 2008, the FASB issued<br />
further guidance that delayed the effective date of fair value measurements<br />
for all nonfinancial assets and nonfinancial liabilities,<br />
except those that are recognized or disclosed at fair value in the<br />
financial statements on a recurring basis, to fiscal years beginning<br />
after November 15, 2008. The adoption of this new guidance on<br />
January 1, <strong>2009</strong>, for all nonfinancial assets and nonfinancial liabilities,<br />
did not materially affect our financial statements. See<br />
Note 19, Fair Value, for information on our assets and liabilities<br />
measured at fair value.<br />
Business Combinations — In December 2007, the FASB<br />
issued new guidance that establishes principles over the method<br />
entities use to recognize and measure assets acquired and liabilities<br />
assumed in a business combination and enhances disclosures<br />
of business combinations. The new guidance is effective for business<br />
combinations completed on or after January 1, <strong>2009</strong>. The<br />
adoption of this new guidance did not materially impact our <strong>2009</strong><br />
financial statements. Refer to Note 20, Business Combinations.<br />
Derivatives and Hedging — In March 2008, the FASB issued<br />
new guidance that requires qualitative disclosures about objectives<br />
and strategies for using derivatives, quantitative disclosures about<br />
fair value amounts of and gains and losses on derivative instruments,<br />
and disclosures about credit-risk-related contingent features<br />
in derivative agreements. This new guidance is effective for<br />
fiscal years beginning after November 15, 2008. The adoption of<br />
this guidance on January 1, <strong>2009</strong> did not materially affect our<br />
financial statements. Refer to Note 18, Financial Instruments, for<br />
information on our derivatives and the required disclosures.<br />
POLYONE CORPORATION<br />
31
ITEM 7A.<br />
QUANTITATIVE AND QUALITATIVE DISCLOSURES<br />
ABOUT MARKET RISK<br />
We are exposed to certain market risks as part of our ongoing<br />
business operations, including risks from changes in interest rates<br />
on debt obligations and foreign currency exchange rates that could<br />
impact our financial condition, results of operations and cash flows.<br />
We manage our exposure to these and other market risks through<br />
regular operating and financing activities, including the use of<br />
derivative financial instruments. We intend to use these derivative<br />
financial instruments as risk management tools and not for speculative<br />
investment purposes.<br />
Interest rate exposure — We are subject to interest rate risk<br />
related to our floating rate debt. As of December 31, <strong>2009</strong>, approximately<br />
90% of the principal amount of our debt obligations were at<br />
fixed rates. Additionally, borrowings under the credit facility are<br />
based on the applicable LIBOR rate plus a fixed facility fee of 4.77%.<br />
There would be no significant impact on our interest expense or<br />
cash flows from either a 10% increase or decrease in market rates<br />
of interest on our outstanding variable rate debt as of December 31,<br />
<strong>2009</strong>.<br />
Foreign currency exposure — We enter into intercompany<br />
lending transactions that are denominated in various foreign currencies<br />
and are subject to financial exposure from foreign exchange<br />
rate movement from the date a loan is recorded to the date it is<br />
settled or revalued. To mitigate this risk, we enter into foreign<br />
exchange contracts. Gains and losses on these contracts generally<br />
offset gains and losses on the assets and liabilities being hedged.<br />
Effective April 1, <strong>2009</strong>, we changed the functional currency for<br />
our Canadian operations from the Canadian dollar to the U.S. dollar.<br />
Our sales in Canada are primarily denominated in U.S. dollars.<br />
Additionally, with the closure of our Niagara, Canada facility in the<br />
first quarter of <strong>2009</strong>, the majority of our inventory is sourced from<br />
our U.S. operations. The change in functional currency is applied on<br />
a prospective basis. The U.S dollar translated amounts of nonmonetary<br />
assets and liabilities at March 31, <strong>2009</strong> became the historical<br />
accounting basis for those assets and liabilities at April 1, <strong>2009</strong>.<br />
The change in functional currency in Canada did not have a material<br />
effect on our consolidated results of operations for <strong>2009</strong>.<br />
ITEM 8.<br />
FINANCIAL STATEMENTS AND SUPPLEMENTARY<br />
DATA<br />
Index to Financial Statements<br />
POLYONE CORPORATION<br />
Page<br />
Management’s <strong>Report</strong> 33<br />
<strong>Report</strong>s of Independent Registered Public Accounting Firm 34<br />
Consolidated Financial Statements:<br />
Consolidated Statements of Operations 35<br />
Consolidated Balance Sheets 36<br />
Consolidated Statements of Cash Flows 37<br />
Consolidated Statements of Shareholders’ Equity 38<br />
Notes to Consolidated Financial Statements 39-61<br />
32
MANAGEMENT’S REPORT<br />
The management of <strong>PolyOne</strong> Corporation is responsible for preparing<br />
the consolidated financial statements and disclosures included<br />
in this <strong>Annual</strong> <strong>Report</strong> on Form 10-K. The financial statements and<br />
disclosures included in this <strong>Annual</strong> <strong>Report</strong> fairly present in all<br />
material respects the financial position, results of operations,<br />
shareholders’ equity and cash flows of <strong>PolyOne</strong> Corporation as of<br />
and for the year ended December 31, <strong>2009</strong>.<br />
Management is responsible for establishing and maintaining<br />
disclosure controls and procedures designed to ensure that the<br />
information required to be disclosed by the company is captured<br />
and reported in a timely manner. Management has evaluated the<br />
design and operation of the company’s disclosure controls and<br />
procedures at December 31, <strong>2009</strong> and found them to be effective.<br />
Management is also responsible for establishing and maintaining<br />
a system of internal control over financial reporting that is<br />
designed to provide reasonable assurance regarding the reliability<br />
of financial reporting and the preparation of financial statements<br />
for external purposes in accordance with generally accepted<br />
accounting principles. Internal control over financial reporting<br />
includes policies and procedures that provide reasonable assurance<br />
that: <strong>PolyOne</strong> Corporation’s accounting records accurately and<br />
fairly reflect the transactions and dispositions of the assets of the<br />
company; unauthorized or improper acquisition, use or disposal of<br />
company assets will be prevented or timely detected; the company’s<br />
transactions are properly recorded and reported to permit the<br />
preparation of the company’s financial statements in conformity<br />
with generally accepted accounting principles; and the company’s<br />
receipts and expenditures are made only in accordance with authorizations<br />
of management and the board of directors of the company.<br />
Management has assessed the effectiveness of <strong>PolyOne</strong>’s<br />
internal control over financial reporting as of December 31,<br />
<strong>2009</strong> and has prepared Management’s <strong>Annual</strong> <strong>Report</strong> On Internal<br />
Control Over Financial <strong>Report</strong>ing contained on page 62 of this<br />
<strong>Annual</strong> <strong>Report</strong>. This report concludes that internal control over<br />
financial reporting is effective and that no material weaknesses<br />
were identified.<br />
/s/ STEPHEN D. NEWLIN /s/ ROBERT M. PATTERSON<br />
Stephen D. Newlin<br />
Chairman, President and<br />
Chief Executive Officer<br />
Robert M. Patterson<br />
Senior Vice President<br />
and Chief Financial Officer<br />
February 18, 2010<br />
POLYONE CORPORATION<br />
33
REPORT OF INDEPENDENT REGISTERED PUBLIC ACCOUNTING FIRM<br />
The Board of Directors and Shareholders<br />
<strong>PolyOne</strong> Corporation<br />
We have audited <strong>PolyOne</strong> Corporation’s internal control over financial<br />
reporting as of December 31, <strong>2009</strong>, based on criteria established in<br />
Internal Control — Integrated Framework issued by the Committee of<br />
Sponsoring Organizations of the Treadway Commission (the COSO criteria).<br />
<strong>PolyOne</strong> Corporation’s management is responsible for maintaining<br />
effective internal control over financial reporting, and for its assessment of<br />
the effectiveness of internal control over financial reporting included in the<br />
accompanying “Management’s <strong>Annual</strong> <strong>Report</strong> on Internal Control over<br />
Financial <strong>Report</strong>ing”. Our responsibility is to express an opinion on the<br />
company’s internal control over financial reporting based on our audit.<br />
We conducted our audit in accordance with the standards of the<br />
Public Company Accounting Oversight Board (United States). Those<br />
standards require that we plan and perform the audit to obtain reasonable<br />
assurance about whether effective internal control over financial<br />
reporting was maintained in all material respects. Our audit<br />
included obtaining an understanding of internal control over financial<br />
reporting, assessing the risk that a material weakness exists, testing<br />
and evaluating the design and operating effectiveness of internal<br />
control based on the assessed risk, and performing such other procedures<br />
as we considered necessary in the circumstances. We believe<br />
that our audit provides a reasonable basis for our opinion.<br />
A company’s internal control over financial reporting is a process<br />
designed to provide reasonable assurance regarding the reliability of<br />
financial reporting and the preparation of financial statements for<br />
external purposes in accordance with generally accepted accounting<br />
principles. A company’s internal control over financial reporting<br />
includes those policies and procedures that: (1) pertain to the maintenance<br />
of records that, in reasonable detail, accurately and fairly<br />
reflect the transactions and dispositions of the assets of the company;<br />
(2) provide reasonable assurance that transactions are recorded as<br />
necessary to permit preparation of financial statements in accordance<br />
with generally accepted accounting principles, and that receipts and<br />
expenditures of the company are being made only in accordance with<br />
authorizations of management and directors of the company; and<br />
(3) provide reasonable assurance regarding prevention or timely detection<br />
of unauthorized acquisition, use or disposition of the company’s<br />
assets that could have a material effect on the financial statements.<br />
Because of its inherent limitations, internal control over financial<br />
reporting may not prevent or detect misstatements. Also, projections<br />
of any evaluation of effectiveness to future periods are subject to the<br />
risk that controls may become inadequate because of changes in<br />
conditions, or that the degree of compliance with the policies or<br />
procedures may deteriorate.<br />
In our opinion, <strong>PolyOne</strong> Corporation maintained, in all material<br />
respects, effective internal control over financial reporting as of<br />
December 31, <strong>2009</strong>, based on the COSO criteria.<br />
We also have audited, in accordance with the standards of the<br />
Public Company Accounting Oversight Board (United States), the consolidated<br />
balance sheets of <strong>PolyOne</strong> Corporation and subsidiaries as of<br />
December 31, <strong>2009</strong>, and 2008, and the related consolidated statements<br />
of operations, shareholders’ equity and cash flows for each of<br />
the three years in the period ended December 31, <strong>2009</strong>, and our report<br />
dated February 18, 2010 expressed an unqualified opinion thereon.<br />
REPORT OF INDEPENDENT REGISTERED PUBLIC ACCOUNTING FIRM<br />
To the Board of Directors and Shareholders<br />
<strong>PolyOne</strong> Corporation<br />
We have audited the accompanying consolidated balance sheets of<br />
<strong>PolyOne</strong> Corporation as of December 31, <strong>2009</strong> and 2008, and the<br />
related consolidated statements of operations, shareholders’ equity<br />
and cash flows for each of the three years in the period ended December<br />
31, <strong>2009</strong>. These financial statements are the responsibility of the<br />
Company’s management. Our responsibility is to express an opinion on<br />
these financial statements based on our audits.<br />
We conducted our audits in accordance with the standards of the<br />
Public Company Accounting Oversight Board (United States). Those<br />
standards require that we plan and perform the audit to obtain reasonable<br />
assurance about whether the financial statements are free of<br />
material misstatement. An audit includes examining, on a test basis,<br />
evidence supporting the amounts and disclosures in the financial<br />
statements. An audit also includes assessing the accounting principles<br />
used and significant estimates made by management, as well as<br />
evaluating the overall financial statement presentation. We believe<br />
that our audits and the report of other auditors provide a reasonable<br />
basis for our opinion.<br />
In our opinion, the financial statements referred to above present<br />
fairly, in all material respects, the consolidated financial position of<br />
<strong>PolyOne</strong> Corporation at December 31, <strong>2009</strong> and 2008, and the consolidated<br />
results of their operations and their cash flows for each of the<br />
three years in the period ended December 31, <strong>2009</strong>, in conformity with<br />
U.S. generally accepted accounting principles.<br />
We also have audited, in accordance with the standards of the<br />
Public Company Accounting Oversight Board (United States), <strong>PolyOne</strong><br />
Corporation’s internal control over financial reporting as of December<br />
31, <strong>2009</strong>, based on criteria established in Internal Control —<br />
Integrated Framework issued by the Committee of Sponsoring Organizations<br />
of the Treadway Commission, and our report dated February 18,<br />
2010 expressed an unqualified opinion thereon.<br />
/s/<br />
ERNST & YOUNG LLP<br />
Cleveland, Ohio<br />
February 18, 2010<br />
/s/<br />
ERNST & YOUNG LLP<br />
Cleveland, Ohio<br />
February 18, 2010<br />
POLYONE CORPORATION<br />
34
Consolidated Statements of Operations<br />
Year Ended December 31,<br />
(In millions, except per share data) <strong>2009</strong> 2008 2007<br />
Sales $2,060.7 $2,738.7 $2,642.7<br />
Cost of sales 1,720.2 2,442.1 2,381.7<br />
Gross margin 340.5 296.6 261.0<br />
Selling and administrative 272.3 287.1 254.8<br />
Impairment of goodwill 5.0 170.0 —<br />
Income from equity affiliates 35.2 31.2 27.7<br />
Operating income (loss) 98.4 (129.3) 33.9<br />
Interest expense, net (34.3) (37.2) (46.9)<br />
Premium on early extinguishment of long-term debt — — (12.8)<br />
Other expense, net (9.6) (4.6) (6.6)<br />
Income (loss) before income taxes 54.5 (171.1) (32.4)<br />
Income tax benefit (expense) 13.3 (101.8) 43.8<br />
Net income (loss) $ 67.8 $ (272.9) $ 11.4<br />
Basic and diluted earnings (loss) per common share: $ 0.73 $ (2.94) $ 0.12<br />
Weighted-average shares used to compute earnings (loss) per common share:<br />
Basic 92.4 92.7 92.8<br />
Diluted 93.4 92.7 93.1<br />
The accompanying notes to consolidated financial statements are an integral part of these statements.<br />
POLYONE CORPORATION<br />
35
Consolidated Balance Sheets<br />
December 31,<br />
(In millions, except per share data) <strong>2009</strong> 2008<br />
ASSETS<br />
Current assets<br />
Cash and cash equivalents $ 222.7 $ 44.3<br />
Accounts receivable (less allowance of $5.9 in <strong>2009</strong> and $6.7 in 2008) 274.4 262.1<br />
Inventories 159.6 197.8<br />
Deferred income tax assets — 1.0<br />
Other current assets 38.0 19.9<br />
Total current assets 694.7 525.1<br />
Property, net 392.4 432.0<br />
Investment in equity affiliates and nonconsolidated subsidiary 5.8 20.5<br />
Goodwill 163.5 163.9<br />
Other intangible assets, net 71.7 69.1<br />
Deferred income tax assets 8.1 0.5<br />
Other non-current assets 55.7 66.6<br />
Total assets $1,391.9 $1,277.7<br />
LIABILITIES AND SHAREHOLDERS’ EQUITY<br />
Current liabilities<br />
Current portion of long-term debt $ 19.9 $ 19.8<br />
Short-term debt 0.5 6.2<br />
Accounts payable, including amounts payable to related party 238.3 160.0<br />
Accrued expenses and other liabilities 117.0 118.2<br />
Total current liabilities 375.7 304.2<br />
Long-term debt 389.2 408.3<br />
Post-retirement benefits other than pensions 21.8 80.9<br />
Pension benefits 173.0 225.0<br />
Other non-current liabilities 98.6 83.4<br />
Commitments and contingencies (See Note 12)<br />
Shareholders’ equity<br />
Preferred stock, 40.0 shares authorized, no shares issued — —<br />
Common stock, $0.01 par, 400.0 shares authorized, 122.2 shares issued in <strong>2009</strong> and 2008 1.2 1.2<br />
Additional paid-in capital 1,065.5 1,065.0<br />
Accumulated deficit (253.6) (321.4)<br />
Common stock held in treasury, at cost, 29.7 shares in <strong>2009</strong> and 29.9 shares in 2008 (321.0) (323.8)<br />
Accumulated other comprehensive loss (158.5) (245.1)<br />
Total shareholders’ equity 333.6 175.9<br />
Total liabilities and shareholders’ equity $1,391.9 $1,277.7<br />
The accompanying notes to consolidated financial statements are an integral part of these balance sheets.<br />
POLYONE CORPORATION<br />
36
Consolidated Statements of Cash Flows<br />
Year Ended December 31,<br />
(In millions) <strong>2009</strong> 2008 2007<br />
Operating activities<br />
Net income (loss) $ 67.8 $(272.9) $ 11.4<br />
Adjustments to reconcile net income (loss) to net cash provided by operating activities:<br />
Depreciation and amortization 64.8 68.0 57.4<br />
Deferred income tax provision (benefit) 5.9 89.4 (57.1)<br />
Premium on early extinguishment of long-term debt — — 12.8<br />
Provision for doubtful accounts 3.3 6.0 1.9<br />
Stock compensation expense 2.6 3.0 4.3<br />
Impairment of goodwill 5.0 170.0 —<br />
Asset write-downs and impairment charges, net of gain on sale of assets 3.7 3.6 3.3<br />
Companies carried at equity and minority interest:<br />
Income from equity affiliates and minority interest (35.2) (31.2) (27.7)<br />
Dividends and distributions received 36.5 32.9 37.6<br />
Changes in assets and liabilities, net of acquisition:<br />
Decrease (increase) in accounts receivable 1.3 60.8 (10.8)<br />
Decrease in inventories 39.1 33.6 26.7<br />
Increase (decrease) in accounts payable 76.3 (94.7) 17.8<br />
(Decrease) increase in sale of accounts receivable (14.2) 14.2 —<br />
Decrease in accrued expenses and other (27.2) (10.2) (10.4)<br />
Net cash provided by operating activities 229.7 72.5 67.2<br />
Investing activities<br />
Capital expenditures (31.7) (42.5) (43.4)<br />
Investment in affiliated company — (1.1) —<br />
Business acquisitions and related deposits, net of cash acquired (11.5) (150.2) (11.2)<br />
Proceeds from sale of investment in equity affiliates and other assets 17.0 0.3 269.9<br />
Net cash (used) provided by investing activities (26.2) (193.5) 215.3<br />
Financing activities<br />
Change in short-term debt (5.7) 43.3 (0.2)<br />
Issuance of long-term debt, net of debt issuance costs — 77.8 —<br />
Repayment of long-term debt (20.0) (25.3) (264.1)<br />
Purchase of common stock for treasury — (8.9) —<br />
Premium on early extinguishment of long-term debt — — (12.8)<br />
Proceeds from the exercise of stock options — 1.1 1.2<br />
Net cash (used) provided by financing activities (25.7) 88.0 (275.9)<br />
Effect of exchange rate changes on cash 0.6 (2.1) 6.6<br />
Increase (decrease) in cash and cash equivalents 178.4 (35.1) 13.2<br />
Cash and cash equivalents at beginning of year 44.3 79.4 66.2<br />
Cash and cash equivalents at end of year $222.7 $ 44.3 $ 79.4<br />
The accompanying notes to consolidated financial statements are an integral part of these statements.<br />
POLYONE CORPORATION<br />
37
Consolidated Statements of Shareholders’ Equity<br />
Shareholders’ Equity<br />
(Dollars in millions, except per share data;<br />
shares in thousands)<br />
Common Shares<br />
Common<br />
Common Shares Held<br />
Shares in Treasury<br />
Total<br />
Common<br />
Stock<br />
Additional<br />
Paid-in<br />
Capital<br />
Accumulated<br />
Deficit<br />
Common<br />
Stock Held<br />
in Treasury<br />
Accumulated<br />
Other<br />
Comprehensive<br />
Income (Loss)<br />
Balance January 1, 2007 122,192 (29,384) $ 581.7 $1.2 $1,065.7 $ (59.9) $(326.2) $ (99.1)<br />
Comprehensive income:<br />
Net income 11.4 11.4<br />
Translation adjustment 28.3 28.3<br />
Adjustments related to Pensions and Postemployment<br />
benefits:<br />
Prior service credit recognized during year, net of tax of<br />
$1.9 (4.0) (4.0)<br />
Net actuarial gain occurring during year, net of tax<br />
benefit of $12.2 26.2 26.2<br />
Total comprehensive income 61.9<br />
Stock-based compensation and benefits and exercise of<br />
options 325 5.8 (0.7) 6.5 —<br />
Balance December 31, 2007 122,192 (29,059) 649.4 1.2 1,065.0 (48.5) (319.7) (48.6)<br />
Comprehensive (loss):<br />
Net loss (272.9) (272.9)<br />
Translation adjustment (25.3) (25.3)<br />
Adjustments related to Pensions and Postemployment<br />
benefits:<br />
Prior service credit recognized during year, net of tax<br />
of $0.0 (5.4) (5.4)<br />
Net actuarial loss occurring during year, net of tax of<br />
$0.2 (157.8) (157.8)<br />
Adjustment for plan amendment, net of tax of $0.0 (6.1) (6.1)<br />
Adjustment for supplemental executive retirement<br />
plan, net of tax of $0.0 (1.9) (1.9)<br />
Total comprehensive loss (469.4)<br />
Repurchase of common stock (1,250) (8.9) (8.9)<br />
Stock-based compensation and benefits and exercise of<br />
options 391 4.8 4.8<br />
Balance December 31, 2008 122,192 (29,918) 175.9 1.2 1,065.0 (321.4) (323.8) (245.1)<br />
Comprehensive income:<br />
Net income 67.8 67.8<br />
Translation adjustment 0.7 0.7<br />
Adjustments related to Pensions and Postemployment<br />
benefits:<br />
Net actuarial gain occurring during year, net of tax of<br />
$0.6 30.2 30.2<br />
Net gain due to retiree plan amendments, net of tax<br />
of $0.0 18.5 18.5<br />
Net gain due to 37.0 37.0<br />
post-retirement healthcare plan amendments, net of<br />
tax of $0.0<br />
Unrealized gain on available-for-sale securities 0.2 0.2<br />
Total comprehensive income 154.4<br />
Stock-based compensation and benefits and exercise of<br />
options 212 3.3 0.5 2.8<br />
Balance December 31, <strong>2009</strong> 122,192 (29,706) $ 333.6 $1.2 $1,065.5 $(253.6) $(321.0) $(158.5)<br />
POLYONE CORPORATION<br />
The accompanying notes to financial statements are an integral part of these statements.<br />
38
Note 1 — DESCRIPTION OF BUSINESS AND SUMMARY OF SIGNIFICANT ACCOUNTING POLICIES<br />
Note 2 — GOODWILL AND INTANGIBLE ASSETS<br />
Note 3 — EMPLOYEE SEPARATION AND PLANT PHASEOUT<br />
Note 4 — FINANCIAL INFORMATION OF EQUITY AFFILIATES<br />
Note 5 — FINANCING ARRANGEMENTS<br />
Note 6 — LEASING ARRANGEMENTS<br />
Note 7 — ACCOUNTS RECEIVABLE<br />
Note 8 — INVENTORIES<br />
Note 9 — PROPERTY<br />
Note 10 — OTHER BALANCE SHEET LIABILITIES<br />
Note 11 — EMPLOYEE BENEFIT PLANS<br />
Note 12 — COMMITMENTS AND RELATED-PARTY INFORMATION<br />
Note 13 — OTHER EXPENSE, NET<br />
Note 14 — INCOME TAXES<br />
Note 15 — SHARE-BASED COMPENSATION<br />
Note 16 — SEGMENT INFORMATION<br />
Note 17 — WEIGHTED-AVERAGE SHARES USED IN COMPUTING EARNINGS PER SHARE<br />
Note 18 — FINANCIAL INSTRUMENTS<br />
Note 19 — FAIR VALUE<br />
Note 20 — BUSINESS COMBINATIONS<br />
Note 21 — SHAREHOLDERS’ EQUITY<br />
Note 22 — SUBSEQUENT EVENTS<br />
Note 23 — SELECTED QUARTERLY FINANCIAL DATA (UNAUDITED)<br />
Note 1 — DESCRIPTION OF BUSINESS AND SUMMARY OF<br />
SIGNIFICANT ACCOUNTING POLICIES<br />
Description of Business<br />
<strong>PolyOne</strong> Corporation (<strong>PolyOne</strong>, Company, we, us or our) is a premier<br />
provider of specialized polymer materials, services and solutions<br />
with operations in thermoplastic compounds, specialty polymer<br />
formulations, color and additive systems, thermoplastic resin distribution<br />
and specialty polyvinyl chloride (PVC) resins. We also have<br />
two equity investments: one in a manufacturer of caustic soda and<br />
chlorine and one in a formulator of polyurethane compounds.<br />
<strong>PolyOne</strong> was incorporated in the state of Ohio on August 31, 2000.<br />
Our operations are located primarily in the United States,<br />
Europe, Canada, Asia and Mexico. Our operations are reported in<br />
six reportable segments: International Color and Engineered Materials;<br />
Specialty Engineered Materials; Specialty Color, Additives and<br />
Inks; Performance Products and Solutions; <strong>PolyOne</strong> Distribution;<br />
and Resin and Intermediates. See Note 16, Segment Information,<br />
for more information.<br />
Consolidation and Basis of Presentation<br />
The consolidated financial statements include the accounts of<br />
<strong>PolyOne</strong> and its subsidiaries. All majority-owned affiliates over<br />
which we have control are consolidated. Investments in affiliates<br />
and joint ventures in which our ownership is 50% or less, or in which<br />
we do not have control but have the ability to exercise significant<br />
influence over operating and financial policies, are accounted for<br />
under the equity method. Intercompany transactions are eliminated.<br />
Transactions with related parties, including joint ventures,<br />
are in the ordinary course of business.<br />
Effective April 1, <strong>2009</strong>, we changed the functional currency for<br />
our Canadian operations from the Canadian dollar to the U.S. dollar.<br />
Our sales in Canada are primarily denominated in U.S. dollars.<br />
Additionally, with the closure of our Niagara, Canada facility in the<br />
first quarter of <strong>2009</strong>, the majority of our inventory is sourced from<br />
our U.S. operations. The change in functional currency is applied on<br />
a prospective basis. The U.S dollar translated amounts of nonmonetary<br />
assets and liabilities at March 31, <strong>2009</strong> became the historical<br />
accounting basis for those assets and liabilities at April 1, <strong>2009</strong>.<br />
POLYONE CORPORATION<br />
39
The change in functional currency in Canada did not have a material<br />
effect on our consolidated results of operations for <strong>2009</strong>.<br />
Reclassifications<br />
Certain reclassifications of the prior period amounts and presentation<br />
have been made to conform to the presentation for the<br />
current period.<br />
Use of Estimates<br />
Preparation of financial statements in conformity with accounting<br />
principles generally accepted in the United States requires management<br />
to make estimates and assumptions in certain circumstances<br />
that affect amounts reported in the accompanying<br />
consolidated financial statements and notes. Actual results could<br />
differ from these estimates.<br />
on accelerated methods for income tax purposes. We expense<br />
repair and maintenance costs as incurred. We capitalize replacements<br />
and betterments that increase the estimated useful life of an<br />
asset. We capitalize interest expense on major construction and<br />
development projects while in progress.<br />
We retain fully depreciated assets in property and accumulated<br />
depreciation accounts until we remove them from service. In the<br />
case of sale, retirement or disposal, the asset cost and related<br />
accumulated depreciation balance is removed from the respective<br />
account, and the resulting net amount, less any proceeds, is<br />
included as a component of income (loss) from continuing operations<br />
in the accompanying consolidated statements of operations.<br />
We account for operating leases under the provisions of Financial<br />
Accounting Standards Board (FASB) Accounting Standards Codification<br />
(ASC) Topic 840, Leases.<br />
POLYONE CORPORATION<br />
Cash and Cash Equivalents<br />
We consider all highly liquid investments purchased with a maturity<br />
of less than three months to be cash equivalents. Cash equivalents<br />
are stated at cost, which approximates fair value.<br />
Allowance for Doubtful Accounts<br />
We evaluate the collectability of trade receivables based on a<br />
combination of factors. We regularly analyze significant customer<br />
accounts and, when we become aware of a specific customer’s<br />
inability to meet its financial obligations to us, such as in the case of<br />
a bankruptcy filing or deterioration in the customer’s operating<br />
results or financial position, we record a specific allowance for<br />
bad debt to reduce the related receivable to the amount we reasonably<br />
believe is collectible. We also record bad debt allowances<br />
for all other customers based on a variety of factors including the<br />
length of time the receivables are past due, the financial health of<br />
the customer, economic conditions and historical experience. In<br />
estimating the allowances, we take into consideration the existence<br />
of credit insurance. If circumstances related to specific customers<br />
change, our estimates of the recoverability of receivables could be<br />
adjusted further.<br />
Inventories<br />
Inventories are stated at the lower of cost or market. Approximately<br />
76% and 66% of our inventories as of December 31, <strong>2009</strong> and<br />
2008, respectively, are valued using the first-in, first-out (FIFO) cost<br />
method. Inventories not valued by the FIFO method are valued using<br />
the last-in, first-out (LIFO) or average cost method.<br />
Property and Depreciation<br />
Property, plant and equipment is carried at cost, net of depreciation<br />
and amortization that is computed using the straight-line method<br />
over the estimated useful life of the assets, which ranges from 3 to<br />
15 years for machinery and equipment and up to 40 years for<br />
buildings. Computer software is amortized over periods not exceeding<br />
10 years. Property, plant and equipment is generally depreciated<br />
Impairment of Long-Lived Assets<br />
We assess the recoverability of long-lived assets whenever events<br />
or changes in circumstances indicate that we may not be able to<br />
recover the assets’ carrying amount. We measure the recoverability<br />
of assets to be held and used by a comparison of the carrying<br />
amount of the asset to the expected net future undiscounted cash<br />
flows associated with the asset. We measure the amount of impairment<br />
of long-lived assets as the amount by which the carrying value<br />
of the asset exceeds the fair value of the asset, which is generally<br />
determined based on projected discounted future cash flows or<br />
appraised values.<br />
Goodwill and Other Intangible Assets<br />
Goodwill is the excess of the purchase price paid over the fair value<br />
of the net assets of the acquired business. Goodwill and other<br />
indefinite-lived intangible assets are tested for impairment at the<br />
reporting unit level. Our reporting units have been identified at the<br />
operating segment level or in some cases one level below the<br />
operating segment level. Goodwill is allocated to the reporting units<br />
based on the estimated fair value at the date of acquisition.<br />
Our annual measurement date for testing impairment of goodwill<br />
and other indefinite-lived intangibles is October 1st. We completed<br />
our testing of impairment on October 1, <strong>2009</strong>, noting no<br />
impairment. The future occurrence of a potential indicator of impairment<br />
would require an interim assessment for some or all of the<br />
reporting units prior to the next required annual assessment on<br />
October 1, 2010. Refer to Note 19, Fair Value, for further discussion<br />
of our approach for assessing fair value of goodwill.<br />
Notes Receivable<br />
As of December 31, <strong>2009</strong>, included in Other current assets is<br />
$8.1 million outstanding on a seller note receivable from O’Sullivan<br />
Films, which purchased our engineered films business in February<br />
2006. This note accrues interest at 7% and is due in full with<br />
accrued interest at maturity in December 2010.<br />
40
As of December 31, <strong>2009</strong>, included in Other non-current<br />
assets is $23.5 million outstanding on a seller note receivable<br />
due from Excel Polymers LLC (Excel), which purchased our elastomers<br />
and performance additives business in August 2004. During<br />
<strong>2009</strong>, the Company and Excel agreed to extend the maturity of the<br />
seller note to February 29, 2012. As a result of this extension, we<br />
were given a secured position in the assets of the business. This<br />
note accrues interest at 10% per annum and is due in full with<br />
accrued interest at maturity.<br />
Litigation Reserves<br />
FASB ASC Topic 450, Contingencies, requires that we accrue for<br />
loss contingencies associated with outstanding litigation, claims<br />
and assessments for which management has determined it is<br />
probable that a loss contingency exists and the amount of loss<br />
can be reasonably estimated. We record expense associated with<br />
professional fees related to litigation claims and assessments as<br />
incurred.<br />
Derivative Financial Instruments<br />
FASB ASC Topic 815, Derivative and Hedging, requires that all<br />
derivative financial instruments, such as foreign exchange contracts<br />
and interest rate swap agreements, be recognized in the<br />
financial statements and measured at fair value, regardless of the<br />
purpose or intent in holding them.<br />
We are exposed to foreign currency changes and interest rate<br />
fluctuations in the normal course of business. We have established<br />
policies and procedures that manage these exposures through the<br />
use of financial instruments. By policy, we do not enter into these<br />
instruments for trading purposes or speculation.<br />
We enter into intercompany lending transactions denominated<br />
in various foreign currencies and are subject to financial exposure<br />
from foreign exchange rate movement over the term of the loans. To<br />
mitigate this risk, we enter into foreign exchange contracts with<br />
major financial institutions. These contracts are not treated as<br />
hedges and, as a result, are adjusted to fair value, with the resulting<br />
gains and losses recognized as other income or expense in the<br />
accompanying consolidated statements of operations. Realized<br />
and unrealized gains and losses on these contracts offset the<br />
foreign exchange gains and losses on the underlying transactions.<br />
Our forward contracts have original maturities of one year or less.<br />
See Note 18, Financial Instruments, for more information.<br />
During 2008 and 2007, we used interest rate swap agreements<br />
that modified the exposure to interest rate risk by converting<br />
fixed-rate debt to a floating rate. These interest rate swaps qualified<br />
as fair value hedges in accordance with FASB ASC Topic 815. The<br />
interest rate swap and instrument being hedged were adjusted to<br />
fair value in the balance sheet, with the corresponding change<br />
recognized in the statement of operations. As of and for the year<br />
ended December 31, <strong>2009</strong>, there were no open interest rate<br />
swaps. See Note 5, Financing Arrangements, for more information.<br />
Pension and Other Post-retirement Plans<br />
We account for our pensions and other post-retirement benefits in<br />
accordance with FASB ASC Topic 715, Compensation — Retirement<br />
Benefits. This standard requires us to (1) recognize the funded<br />
status of the benefit plans in our statement of financial position,<br />
(2) recognize as a component of other comprehensive income, net<br />
of tax, the gains or losses and prior service costs or credits that<br />
arise during the period but are not recognized as components of net<br />
periodic benefit cost, (3) measure defined benefit plan assets and<br />
obligations as of the date of the employer’s fiscal year end statement<br />
of financial position and (4) disclose additional information in<br />
the notes to financial statements about certain effects on net<br />
periodic benefit costs for the next fiscal year that arise from delayed<br />
recognition of gains or losses, prior service costs or credits, and<br />
transition assets or obligations.<br />
Accumulated Other Comprehensive Loss<br />
Accumulated other comprehensive loss at December 31, <strong>2009</strong> and<br />
2008 are as follows:<br />
(In millions) <strong>2009</strong> 2008<br />
Foreign currency translation adjustments $ (4.3) $ (5.0)<br />
Unrecognized losses, transition obligation and<br />
prior service costs (154.4) (240.1)<br />
Unrealized gain in available-for-sale securities 0.2 —<br />
$(158.5) $(245.1)<br />
Fair Value of Financial Instruments<br />
FASB ASC Topic 820, Fair Value Measurements and Disclosures,<br />
requires disclosures of the fair value of financial instruments. The<br />
estimated fair values of financial instruments were principally<br />
based on market prices where such prices were available and,<br />
where unavailable, fair values were estimated based on market<br />
prices of similar instruments. See Note 18, Financial Instruments,<br />
for further discussion.<br />
Foreign Currency Translation<br />
Revenues and expenses are translated at average currency<br />
exchange rates during the related period. Assets and liabilities of<br />
foreign subsidiaries and equity investees are translated using the<br />
exchange rate at the end of the period. The resulting translation<br />
adjustment is recorded as accumulated other comprehensive<br />
income or loss in shareholders’ equity. Gains and losses resulting<br />
from foreign currency transactions, including intercompany transactions<br />
that are not considered permanent investments, are<br />
included in other income, net in the accompanying consolidated<br />
statements of operations.<br />
Revenue Recognition<br />
We recognize revenue when the revenue is realized or realizable,<br />
and has been earned. We recognize revenue when a firm sales<br />
agreement is in place, shipment has occurred and collectability of<br />
the fixed or determinable sales price is reasonably assured.<br />
POLYONE CORPORATION<br />
41
POLYONE CORPORATION<br />
Shipping and Handling Costs<br />
Shipping and handling costs are included in cost of sales.<br />
Research and Development Expense<br />
Research and development costs, which were $22.9 million in<br />
<strong>2009</strong>, $26.5 million in 2008 and $21.6 million in 2007, are<br />
charged to expense as incurred.<br />
Environmental Costs<br />
We expense costs that are associated with managing hazardous<br />
substances and pollution in ongoing operations on a current basis.<br />
Costs associated with the remediation of environmental contamination<br />
are accrued when it becomes probable that a liability has<br />
been incurred and our proportionate share of the cost can be<br />
reasonably estimated.<br />
Equity Affiliates<br />
We account for our investments in equity affiliates under FASB ASC<br />
Topic 323, Investments — Equity Method and Joint Ventures. We<br />
recognize our proportionate share of the income of equity affiliates.<br />
Losses of equity affiliates are recognized to the extent of our<br />
investment, advances, financial guarantees and other commitments<br />
to provide financial support to the investee. Any losses in<br />
excess of this amount are deferred and reduce the amount of future<br />
earnings of the equity investee recognized by <strong>PolyOne</strong>. As of December<br />
31, <strong>2009</strong> and 2008, there were no deferred losses related to<br />
equity investees.<br />
We recognize impairment losses in the value of investments<br />
that we judge to be other than temporary. See Note 4, Financial<br />
Information of Equity Affiliates, for more information.<br />
Share-Based Compensation<br />
We account for share-based compensation under the provisions of<br />
FASB ASC Topic 718, Compensation — Stock Compensation, which<br />
requires us to estimate the fair value of share-based awards on the<br />
date of grant using an option-pricing model. The value of the portion<br />
of the award that is ultimately expected to vest is recognized as<br />
expense over the requisite service periods in the accompanying<br />
consolidated statements of operations. As of December 31, <strong>2009</strong>,<br />
we had one active share-based employee compensation plan, which<br />
is described more fully in Note 15, Share-Based Compensation.<br />
Income Taxes<br />
Deferred tax liabilities and assets are determined based upon the<br />
differences between the financial reporting and tax basis of assets<br />
and liabilities and are measured using the tax rate and laws currently<br />
in effect. In accordance with FASB ASC Topic 740, Income<br />
Taxes, we evaluate our deferred income taxes to determine whether<br />
a valuation allowance should be established against the deferred<br />
tax assets or whether the valuation allowance should be reduced<br />
based on consideration of all available evidence, both positive and<br />
negative, using a “more likely than not” standard.<br />
New Accounting Pronouncements<br />
Consolidation — In June <strong>2009</strong>, the FASB issued new guidance that<br />
modifies how a company determines when an entity that is insufficiently<br />
capitalized or is not controlled through voting (or similar<br />
rights) should be consolidated. The new guidance clarifies that the<br />
determination of whether a company is required to consolidate an<br />
entity is based on, among other things, an entity’s purpose and<br />
design and a company’s ability to direct the activities of the entity<br />
that most significantly impact the entity’s economic performance. A<br />
requirement of the new guidance is an ongoing reassessment of<br />
whether a company is the primary beneficiary of a variable interest<br />
entity. Additional disclosures are also required about a company’s<br />
involvement in variable interest entities and any significant changes<br />
in risk exposure due to that involvement. The new requirements are<br />
effective for fiscal years beginning after November 15, <strong>2009</strong> and<br />
are effective for us on January 1, 2010. The adoption of this<br />
guidance will not materially affect our financial statements.<br />
Subsequent Events — In May <strong>2009</strong>, the FASB issued new guidance<br />
to establish general standards of accounting for and disclosure of<br />
events that occur after the balance sheet date but before financial<br />
statements are issued or are available to be issued. The new<br />
guidance also requires entities to disclose the date through which<br />
subsequent events were evaluated as well as the rationale for the<br />
date that was selected and is effective for interim and annual<br />
periods ending after June 15, <strong>2009</strong>. Refer to Note 22, Subsequent<br />
Events.<br />
Fair Value Measurements and Disclosures — In September 2006,<br />
the FASB issued new guidance regarding fair value measurements,<br />
which defines fair value, establishes the framework for measuring<br />
fair value under U.S. generally accepted accounting principles and<br />
expands disclosures about fair value measurements. In February<br />
2008, the FASB issued further guidance that delayed the effective<br />
date of fair value measurements for all nonfinancial assets and<br />
nonfinancial liabilities, except those that are recognized or disclosed<br />
at fair value in the financial statements on a recurring basis,<br />
to fiscal years beginning after November 15, 2008. The adoption of<br />
this new guidance on January 1, <strong>2009</strong>, for all nonfinancial assets<br />
and nonfinancial liabilities, did not have a material impact on our<br />
financial statements. See Note 19, Fair Value, for information on our<br />
assets and liabilities measured at fair value.<br />
Business Combinations — In December 2007, the FASB issued<br />
new guidance that establishes principles over the method entities<br />
use to recognize and measure assets acquired and liabilities<br />
assumed in a business combination and enhances disclosures<br />
of business combinations. The new guidance is effective for business<br />
combinations completed on or after January 1, <strong>2009</strong>. The<br />
adoption of this new guidance did not materially impact our <strong>2009</strong><br />
financial statements. Refer to Note 20, Business Combinations.<br />
Derivatives and Hedging — In March 2008, the FASB issued new<br />
guidance that requires qualitative disclosures about objectives and<br />
strategies for using derivatives, quantitative disclosures about fair<br />
value amounts of and gains and losses on derivative instruments,<br />
and disclosures about credit-risk-related contingent features in<br />
42
derivative agreements. This new guidance is effective for fiscal<br />
years beginning after November 15, 2008. The adoption of this<br />
guidance on January 1, <strong>2009</strong> did not materially impact our financial<br />
statements. See Note 18, Financial Instruments, for information on<br />
our derivatives and the required disclosures.<br />
Note 2 — GOODWILL AND INTANGIBLE ASSETS<br />
The total purchase price associated with acquisitions is allocated to<br />
the fair value of assets acquired and liabilities assumed based on<br />
their fair values at the acquisition date, with excess amounts<br />
recorded as goodwill. Based on a preliminary purchase price allocation,<br />
the acquisition of New England Urethane, Inc (NEU) resulted<br />
in the addition of $4.5 million of goodwill and $5.9 million in<br />
identifiable intangibles during the year ended December 31,<br />
<strong>2009</strong>. Additionally, in 2008 the acquisition of GLS resulted in the<br />
addition of $44.1 million of goodwill and $65.7 million in identifiable<br />
intangibles. See Note 20, Business Combination, for more information<br />
on the NEU and GLS acquisitions. The following table details<br />
the changes in the carrying amount of goodwill:<br />
(In millions) <strong>2009</strong> 2008<br />
Balance at beginning of the year $163.9 $ 288.8<br />
Acquisition of businesses 4.5 45.2<br />
Impairment (5.0) (170.0)<br />
Translation and other adjustments 0.1 (0.1)<br />
Balance at end of year $163.5 $ 163.9<br />
Goodwill as of December 31, <strong>2009</strong> and 2008, by operating<br />
segment, was as follows:<br />
(In millions)<br />
December 31,<br />
<strong>2009</strong><br />
December 31,<br />
2008<br />
International Color and Engineered<br />
Materials $ 72.1 $ 72.0<br />
Specialty Engineered Materials 48.6 44.1<br />
Specialty Color, Additives and Inks 33.8 33.8<br />
Performance Products and Solutions 7.4 12.4<br />
<strong>PolyOne</strong> Distribution 1.6 1.6<br />
Total $163.5 $163.9<br />
FASB ASC Topic 350 requires that our annual, and any interim,<br />
impairment assessment be performed at the reporting unit level. At<br />
October 1, <strong>2009</strong>, five of our reporting units had goodwill: Geon<br />
Compounds; International Color and Engineered Materials; GLS;<br />
Specialty Inks and Polymer Systems; and <strong>PolyOne</strong> Distribution.<br />
These five reporting units were tested for impairment as of October<br />
1, <strong>2009</strong>, and no indicators of potential impairment were noted.<br />
During the fourth quarter of 2008, indicators of potential<br />
impairment caused us to conduct an interim impairment test. Those<br />
indicators included the following: a significant decrease in market<br />
capitalization; a decline in recent operating results and a decline in<br />
our business outlook primarily due to the macroeconomic environment.<br />
We completed step one of the impairment analysis and<br />
concluded that, as of December 31, 2008, the fair value of two<br />
of our reporting units was below their respective carrying values,<br />
including goodwill. The two reporting units that showed potential<br />
impairment were Geon Compounds and Specialty Coatings (reporting<br />
units within Performance Products and Solutions). As such, step<br />
two of the impairment test was initiated; however, due to its time<br />
consuming nature, the step-two analysis had not been completed<br />
as of the filing date of our 2008 annual report on Form 10-K for the<br />
year ended December 31, 2008. We recorded an estimated noncash<br />
goodwill impairment charge of $170.0 million as of December<br />
31, 2008. Upon completion of the analysis in the first quarter of<br />
<strong>2009</strong>, we revised our estimate of goodwill impairment as of December<br />
31, 2008 to $175.0 million, of which $147.8 million and<br />
$27.2 million relates to the Geon Compounds and Specialty Coatings<br />
reporting units, respectively. Adjustments of $12.4 million and<br />
($7.4) million related to the goodwill impairment charge for Specialty<br />
Coatings and Geon Compounds, respectively, were recorded<br />
in the first quarter of <strong>2009</strong> on the line Impairment of goodwill in the<br />
accompanying Consolidated Statements of Operations and is<br />
reflected on the line Corporate and eliminations in Note 16, Segment<br />
Information.<br />
At December 31, <strong>2009</strong>, <strong>PolyOne</strong> had $33.2 million of indefinite-lived<br />
other intangible assets that are not subject to amortization,<br />
consisting of a trade name acquired as part of the GLS<br />
acquisition. This indefinite-lived intangible asset was tested for<br />
impairment as of October 1, <strong>2009</strong>, and no impairment adjustments<br />
were determined to be required.<br />
Information regarding <strong>PolyOne</strong>’s finite-lived other intangible<br />
assets follows:<br />
(In millions)<br />
Acquisition<br />
Cost<br />
As of December 31, <strong>2009</strong><br />
Accumulated<br />
Amortization<br />
Currency<br />
Translation<br />
Non-contractual customer<br />
relationships $42.2 $(11.7) $ — $30.5<br />
Sales contract 11.4 (10.4) — 1.0<br />
Patents, technology and<br />
other 9.5 (3.7) 1.2 7.0<br />
Total $63.1 $(25.8) $1.2 $38.5<br />
(In millions)<br />
Acquisition<br />
Cost<br />
As of December 31, 2008<br />
Accumulated<br />
Amortization<br />
Currency<br />
Translation<br />
Non-contractual customer<br />
relationships $37.0 $ (9.2) $ — $27.8<br />
Sales contract 11.4 (10.2) — 1.2<br />
Patents, technology and<br />
other 8.8 (3.2) 1.3 6.9<br />
Total $57.2 $(22.6) $1.3 $35.9<br />
Amortization of other finite-lived intangible assets for the years<br />
ended December 31, <strong>2009</strong>, 2008 and 2007 was $3.3 million,<br />
$3.3 million and $2.1 million, respectively. As of December 31,<br />
<strong>2009</strong>, we expect amortization expense on other finite-lived intangibles<br />
for the next five years as follows: 2010 — $3.7 million;<br />
2011 — $3.5 million; 2012 — $3.1 million; 2013 — $3.1 million;<br />
and 2014 — $3.0 million.<br />
Net<br />
Net<br />
POLYONE CORPORATION<br />
43
POLYONE CORPORATION<br />
Note 3 — EMPLOYEE SEPARATION AND PLANT PHASEOUT<br />
Management has undertaken certain restructuring initiatives to<br />
reduce costs and, as a result, we have incurred employee separation<br />
and plant phaseout costs.<br />
Employee separation costs include one-time termination benefits<br />
including salary continuation benefits, medical coverage and<br />
outplacement assistance and are based on a formula that takes<br />
into account each individual employee’s base compensation and<br />
length of service. Employee separation costs also include on-going<br />
postemployment benefits accounted for under FASB ASC Topic 712,<br />
Compensation — Nonretirement Postemployment Benefits, which<br />
are accrued when it is probable that a liability has been incurred and<br />
the amount can be reasonably estimated.<br />
Plant phaseout costs include the impairment of property, plant<br />
and equipment at manufacturing facilities and the resulting writedown<br />
of the carrying value of these assets to fair value, which<br />
represents management’s best estimate of the net proceeds to be<br />
received for the assets to be sold or scrapped, less any costs to<br />
sell. Plant phaseout costs also include cash facility closing costs<br />
and lease termination costs. Assets transferred to our other facilities<br />
are transferred at net book value.<br />
Employee separation and plant phaseout costs associated<br />
with continuing operations are reflected on the line Corporate<br />
and eliminations in Note 16, Segment Information. A summary of<br />
total employee separation and plant phaseout costs, including<br />
where the charges are recorded in the accompanying consolidated<br />
statements of operations, follows:<br />
(In millions) <strong>2009</strong> 2008 2007<br />
Cost of sales $24.4 $29.3 $1.4<br />
Selling and administrative 2.8 10.4 0.8<br />
Total employee separation and plant<br />
phaseout $27.2 $39.7 $2.2<br />
Included in employee separation and plant phaseout costs<br />
shown in the preceding table were charges of $7.4 million, included<br />
in Cost of sales, and $1.2 million, included in Selling and administrative,<br />
for accelerated depreciation on assets related to the <strong>2009</strong><br />
restructuring initiatives discussed below. Cash payments for<br />
employee separation and plant phaseout costs during <strong>2009</strong>,<br />
2008 and 2007 were $32.1 million, $5.5 million and $1.5 million,<br />
respectively.<br />
In July 2008, we announced the restructuring of certain manufacturing<br />
assets, including the closure of seven production facilities<br />
in North America and one in the United Kingdom. In January<br />
<strong>2009</strong>, we announced further cost saving measures that included<br />
eliminating approximately 370 positions worldwide, implementing<br />
reduced work schedules for another 100 to 300 employees, closing<br />
our Niagara, Ontario facility and idling certain other capacity. We<br />
recognized charges of $26.9 million and $38.3 million in <strong>2009</strong> and<br />
2008, respectively, related to these actions. We do not expect to<br />
incur significant additional expenses associated with these<br />
activities.<br />
The following table details the charges and changes to the<br />
reserves associated with these initiatives for the year ended<br />
December 31, <strong>2009</strong>:<br />
(Dollars in millions, except employee<br />
numbers)<br />
Employee<br />
Separation<br />
Costs<br />
Plant Phaseout Costs<br />
Cash<br />
Closure<br />
Asset<br />
Write-downs<br />
Total<br />
Balance at January 1, 2008 $ — $ — $ — $ —<br />
Charge 26.1 2.2 10.0 38.3<br />
Utilized (2.4) (1.5) (10.0) (13.9)<br />
Balance at December 31,<br />
2008 $ 23.7 $ 0.7 $ — $ 24.4<br />
Charge 3.0 8.4 15.5 26.9<br />
Utilized (23.8) (7.5) (15.5) (46.8)<br />
Impact of foreign currency<br />
translation 0.1 0.1 — 0.2<br />
Balance at December 31,<br />
<strong>2009</strong> $ 3.0 $ 1.7 $ — $ 4.7<br />
In addition to the above, during <strong>2009</strong> and 2008, we incurred<br />
$0.3 million and $1.1 million, respectively, of expense related to<br />
executive severance agreements, which was included in Selling and<br />
administrative in the accompanying consolidated statements of<br />
operations. In <strong>2009</strong> and 2008, we paid $0.8 million and $1.0 million,<br />
respectively, related to executive severance agreements. Our<br />
liability for unpaid executive severance costs was $0.6 million at<br />
December 31, <strong>2009</strong> and will be paid over the next 12 months.<br />
Note 4 — FINANCIAL INFORMATION OF EQUITY AFFILIATES<br />
SunBelt Chlor-Alkali Partnership (SunBelt) is the most significant of<br />
our equity investments and is reported in the Resin and Intermediates<br />
segment. <strong>PolyOne</strong> owns 50% of SunBelt. The remaining 50%<br />
of SunBelt is owned by Olin SunBelt Inc., a wholly owned subsidiary<br />
of the Olin Corporation.<br />
Summarized financial information for SunBelt follows:<br />
(In millions) <strong>2009</strong> 2008 2007<br />
SunBelt:<br />
Net sales $167.4 $173.0 $180.6<br />
Operating income $ 67.6 $ 73.6 $ 91.3<br />
Partnership income as reported by<br />
SunBelt $ 59.4 $ 65.1 $ 82.0<br />
<strong>PolyOne</strong>’s ownership of SunBelt 50% 50% 50%<br />
Earnings of equity affiliate recorded<br />
by <strong>PolyOne</strong> $ 29.7 $ 32.5 $ 41.0<br />
Summarized balance sheet as of December 31: <strong>2009</strong> 2008<br />
Current assets $ 16.1 $ 22.4<br />
Non-current assets 94.1 107.7<br />
Total assets 110.2 130.1<br />
Current liabilities 21.4 19.7<br />
Non-current liabilities 85.3 97.5<br />
Total liabilities 106.7 117.2<br />
Partnership interest $ 3.5 $ 12.9<br />
44
OxyVinyls, a former 24% owned affiliate, purchases chlorine<br />
from SunBelt under an agreement that expires in 2094. The agreement<br />
requires OxyVinyls to purchase all of the chlorine that is<br />
produced by SunBelt up to a maximum of 250,000 tons per year<br />
at market price, less a discount. OxyVinyls’ chlorine purchases from<br />
SunBelt were $33.9 million in 2007 through its disposition date of<br />
July 6, 2007.<br />
On July 6, 2007, we sold our 24% interest in OxyVinyls, a<br />
manufacturer and marketer of PVC resins, for cash proceeds of<br />
$261 million.<br />
The following table presents OxyVinyls’ summarized financial<br />
results for the periods indicated:<br />
(In millions)<br />
Six Months Ended<br />
June 30, 2007<br />
OxyVinyls:<br />
Net sales $1,107.4<br />
Operating income $ 11.6<br />
Partnership (loss) as reported by OxyVinyls $ (2.0)<br />
<strong>PolyOne</strong>’s ownership of OxyVinyls 24%<br />
<strong>PolyOne</strong>’s proportionate share of OxyVinyls’ (loss) (0.5)<br />
Amortization of the difference between <strong>PolyOne</strong>’s<br />
investment and its underlying share of OxyVinyls’<br />
equity 0.3<br />
(Loss) of equity affiliate recorded by <strong>PolyOne</strong> $ (0.2)<br />
We recorded an impairment of $14.8 million on our OxyVinyls<br />
investment during 2007 due to an other than temporary decline in<br />
value. It is included in Income from equity affiliates in the accompanying<br />
consolidated statements of operations. The impairment is<br />
not reflected in the equity affiliate earnings above because it is<br />
excluded as a measure of segment operating income or loss that is<br />
reported to and reviewed by the chief operating decision maker (See<br />
Note 16, Segment Information).<br />
Our other investments in equity affiliates include the BayOne<br />
Urethane Systems, L.L.C (BayOne) equity affiliate (owned 50%),<br />
which is included in the Specialty Color, Additives and Inks operating<br />
segment, and the Altona Properties equity affiliate (owned 37.4%),<br />
which is included in the Resin and Intermediates operating<br />
segment.<br />
Combined summarized financial information for these equity<br />
affiliates follows:<br />
(In millions) <strong>2009</strong> 2008<br />
Net sales $77.9 $112.2<br />
Operating income 6.2 7.7<br />
Partnership income as reported by other equity<br />
affiliates 5.4 6.6<br />
Equity affiliate earnings recorded by <strong>PolyOne</strong> 2.7 3.3<br />
Summarized balance sheet as of December 31: <strong>2009</strong> 2008<br />
Current assets $ 7.1 $31.4<br />
Non-current assets 4.2 12.3<br />
Total assets $11.3 $43.7<br />
Current liabilities $ 8.8 $24.6<br />
Non-current liabilities — 1.6<br />
Total liabilities $ 8.8 $26.2<br />
On October 13, <strong>2009</strong>, we sold our interest in Geon Polimeros<br />
Andinos (GPA), previously a 50% owned equity affiliate and part of<br />
the Performance Products and Solutions operating segment. We<br />
received cash proceeds of $13.5 million and recorded a pre-tax gain<br />
of $2.8 million in the fourth quarter <strong>2009</strong> results of operations.<br />
Note 5 — FINANCING ARRANGEMENTS<br />
Short-term debt — At December 31, <strong>2009</strong> and 2008, $0.5 million<br />
and $6.2 million, respectively, of short-term notes issued by certain<br />
of our European subsidiaries were outstanding. This short-term<br />
debt has maturities of less than one year, is renewable with the<br />
consent of both parties, and is prepayable.<br />
The weighted-average interest rate on total short-term borrowings<br />
was 3.1% at December 31, <strong>2009</strong> and 4.4% at December 31,<br />
2008.<br />
Long-term debt — Long-term debt as of December 31 consisted<br />
of the following:<br />
(Dollars in millions)<br />
December 31,<br />
<strong>2009</strong> (1) December 31,<br />
2008 (1)<br />
8.875% senior notes due 2012 $279.5 $279.2<br />
7.500% debentures due 2015 50.0 50.0<br />
Medium-term notes:<br />
6.91% medium-term notes due <strong>2009</strong> — 19.8<br />
6.52% medium-term notes due 2010 19.9 19.6<br />
6.58% medium-term notes due 2011 19.7 19.5<br />
Credit facility borrowings, facility expires<br />
2011 40.0 40.0<br />
Total long-term debt $409.1 $428.1<br />
Less current portion 19.9 19.8<br />
Total long-term debt, net of current<br />
portion $389.2 $408.3<br />
(1)<br />
Book values include unamortized discounts and adjustments<br />
related to hedging instruments, as applicable.<br />
Aggregate maturities of long-term debt for the next five years<br />
are: 2010 — $19.9 million; 2011 — $59.7 million; 2012 —<br />
$279.5 million; 2013 — $0.0 million; 2014 — $0.0 million; and<br />
thereafter — $50.0 million.<br />
During April 2008, we sold an additional $80.0 million aggregate<br />
principal amount of 8.875% senior notes due 2012. Net<br />
proceeds from the offering were used to reduce the amount of<br />
receivables previously sold under the receivables sale facility.<br />
On January 3, 2008, we entered into a credit facility with<br />
Citicorp USA, Inc., as administrative agent and as issuing bank,<br />
POLYONE CORPORATION<br />
45
POLYONE CORPORATION<br />
and The Bank of New York, as paying agent. The credit agreement<br />
provides for an unsecured revolving and letter of credit facility with<br />
total commitments of up to $40.0 million. The credit agreement<br />
expires on March 20, 2011. Borrowings under the credit facility are<br />
based on the applicable LIBOR rate plus a fixed facility fee of 4.77%.<br />
During 2007, we repurchased $241.4 million aggregate principal<br />
amounts of our 10.625% senior notes at a premium of<br />
$12.8 million. The premium is shown as a separate line item in<br />
the accompanying consolidated statements of operations. Unamortized<br />
deferred note issuance costs of $2.8 million were charged<br />
to expense due to this repurchase and are included in Interest<br />
expense, net in the accompanying consolidated statements of<br />
operations in 2007. Also, during each of the years ended December<br />
31, <strong>2009</strong>, 2008 and 2007, $20.0 million of aggregate principal<br />
amount of our medium-term notes became due and were paid.<br />
Included in Interest expense, net for the years ended<br />
December 31, <strong>2009</strong>, 2008 and 2007 was interest income of<br />
$3.2 million, $3.4 million, and $4.5 million. Total interest paid<br />
on long-term and short-term borrowings was $35.1 million in <strong>2009</strong>,<br />
$37.1 million in 2008 and $45.7 million in 2007.<br />
As of December 31, <strong>2009</strong>, our secured borrowings were not at<br />
levels that would trigger the security provisions of the indentures<br />
governing our senior notes and debentures and our guarantee of the<br />
SunBelt notes. See Note 12, Commitments and Related-Party<br />
Information.<br />
We entered into a definitive Guarantee and Agreement with<br />
Citicorp USA, Inc., KeyBank National Association and National City<br />
Bank on June 6, 2006. Under this Guarantee and Agreement, we<br />
guarantee some treasury management and banking services provided<br />
to us and our subsidiaries, such as foreign currency forwards<br />
and bank overdrafts. This guarantee is secured by our inventories<br />
located in the United States.<br />
We are exposed to market risk from changes in interest rates<br />
on our debt obligations. In prior years we entered into interest rate<br />
swap agreements that modified our exposure to interest rate risk by<br />
converting fixed-rate obligations to floating rates or floating rate<br />
obligations to fixed rates. As of December 31, <strong>2009</strong>, there were no<br />
open interest rate swap agreements. The following table shows the<br />
interest rate impact of the swap agreements during 2008 and<br />
2007:<br />
Effective<br />
Interest Rate<br />
during 2008<br />
Effective<br />
Interest Rate<br />
during 2007<br />
$40.0 million of borrowings under credit<br />
facility with an interest rate of 6.65% 8.4% —<br />
$60.0 million of medium-term notes with a<br />
weighted-average interest rate of 6.67% 7.1% —<br />
$80.0 million of medium-term notes with a<br />
weighted-average interest rate of 6.76% — 9.5%<br />
Note 6 — LEASING ARRANGEMENTS<br />
We lease certain manufacturing facilities, warehouse space,<br />
machinery and equipment, automobiles and railcars under operating<br />
leases. Rent expense was $20.6 million in <strong>2009</strong>, $24.0 million<br />
in 2008 and $22.4 million in 2007.<br />
Future minimum lease payments under non-cancelable operating<br />
leases with initial lease terms longer than one year as of<br />
December 31, <strong>2009</strong> were as follows: 2010 — $19.8 million;<br />
2011 — $15.2 million; 2012 — $11.1 million; 2013 — $6.9 million;<br />
2014 — $5.6 million; and thereafter — $17.0 million.<br />
Note 7 — ACCOUNTS RECEIVABLE<br />
Accounts receivable as of December 31 consist of the following:<br />
(In millions) <strong>2009</strong> 2008<br />
Trade accounts receivable $129.2 $141.6<br />
Retained interest in securitized accounts<br />
receivable 151.1 127.2<br />
Allowance for doubtful accounts (5.9) (6.7)<br />
$274.4 $262.1<br />
The following table details the changes in allowance for doubtful<br />
accounts:<br />
(In millions) <strong>2009</strong> 2008 2007<br />
Balance at beginning of the year $(6.7) $(4.8) $(5.9)<br />
Provision for doubtful accounts (3.3) (6.0) (1.9)<br />
Accounts written off 4.0 4.2 3.3<br />
Translation and other adjustments 0.1 (0.1) (0.3)<br />
Balance at end of year $(5.9) $(6.7) $(4.8)<br />
Sale of Accounts Receivable — Under the terms of our receivables<br />
sale facility, we sell accounts receivable to <strong>PolyOne</strong> Funding<br />
Corporation (PFC) and <strong>PolyOne</strong> Funding Canada Corporation (PFCC),<br />
both wholly-owned, bankruptcy-remote subsidiaries. PFC and PFCC,<br />
in turn, may sell an undivided interest in up to $175.0 million and<br />
$25.0 million of these accounts receivable, respectively, to certain<br />
investors. The receivables sale facility was amended in June 2007<br />
to extend the maturity of the facility to June 2012 and to, among<br />
other things, modify certain financial covenants and reduce the cost<br />
of utilizing the facility.<br />
As of December 31, <strong>2009</strong> and 2008, accounts receivable<br />
totaling $151.1 million and $141.4 million, respectively, were sold<br />
by us to PFC and PFCC. The maximum proceeds that PFC and PFCC<br />
may receive under the facility is limited to the lesser of $200.0 million<br />
or 85% of the eligible domestic and Canadian accounts receivable<br />
sold. As of December 31, <strong>2009</strong>, neither PFC nor PFCC had sold<br />
any of their undivided interests in accounts receivable. As of December<br />
31, 2008, PFC and PFCC had sold $14.2 million of their undivided<br />
interests in accounts receivable.<br />
We retain an interest in the difference between the amount of<br />
trade receivables sold by us to PFC and PFCC and the undivided<br />
interest sold by PFC and PFCC as of December 31, <strong>2009</strong> and 2008.<br />
As a result, the interest retained by us is $151.1 million and<br />
46
$127.2 million and is included in accounts receivable on the<br />
accompanying consolidated balance sheets as of December 31,<br />
<strong>2009</strong> and 2008, respectively.<br />
The receivables sale facility also makes up to $40.0 million<br />
available for the issuance of standby letters of credit as a sub-limit<br />
within the $200.0 million limit under the facility, of which $12.8 million<br />
was used at December 31, <strong>2009</strong>. The level of availability under<br />
the receivables sale facility is based on the prior month’s total<br />
accounts receivable sold to PFC and PFCC, as reduced by outstanding<br />
letters of credit. Additionally, availability is dependent upon<br />
compliance with a fixed charge coverage ratio covenant related<br />
primarily to operating performance that is set forth in the related<br />
agreements. As of December 31, <strong>2009</strong>, we were in compliance with<br />
these covenants. As of December 31, <strong>2009</strong>, $112.8 million was<br />
available for sale.<br />
We also service the underlying accounts receivable and receive<br />
a service fee of 1% per annum on the average daily amount of the<br />
outstanding interests in our receivables. The net discount and other<br />
costs of the receivables sale facility are included in Other expense,<br />
net in the accompanying consolidated statements of operations.<br />
Note 8 — INVENTORIES<br />
Components of Inventories are as follows:<br />
(In millions)<br />
December 31,<br />
<strong>2009</strong><br />
December 31,<br />
2008<br />
At FIFO or average cost, which<br />
approximates current cost:<br />
Finished products $107.6 $127.4<br />
Work in process 2.4 2.1<br />
Raw materials and supplies 72.9 109.9<br />
182.9 239.4<br />
Reserve to reduce certain inventories<br />
to LIFO cost basis (23.3) (41.6)<br />
$159.6 $197.8<br />
During <strong>2009</strong> and 2008, reductions in LIFO inventory layers<br />
resulted in liquidations of LIFO inventory layers carried at lower<br />
costs prevailing in prior years as compared with the cost of currentyear<br />
purchases. The effect of LIFO liquidations on Cost of sales in<br />
<strong>2009</strong> and 2008 was a decrease of $15.8 million and $7.5 million,<br />
respectively.<br />
Note 9 — PROPERTY<br />
Components of Property, net are as follows:<br />
(In millions)<br />
December 31,<br />
<strong>2009</strong><br />
December 31,<br />
2008<br />
Land and land improvements $ 40.7 $ 40.7<br />
Buildings 277.0 278.6<br />
Machinery and equipment 916.5 912.0<br />
1,234.2 1,231.3<br />
Less accumulated depreciation and<br />
amortization (841.8) (799.3)<br />
$ 392.4 $ 432.0<br />
Depreciation expense was $61.5 million in <strong>2009</strong>, $64.7 million<br />
in 2008 and $55.3 million in 2007. During <strong>2009</strong> and 2008, we<br />
recorded $8.6 million and $6.9 million, respectively, of accelerated<br />
depreciation related to the restructuring of certain manufacturing<br />
assets, respectively.<br />
Note 10 — OTHER LIABILITIES<br />
Other liabilities at December 31, <strong>2009</strong> and 2008 consist of the<br />
following:<br />
Accrued Expenses<br />
Non-current<br />
Liabilities<br />
December 31, December 31,<br />
(In millions) <strong>2009</strong> 2008 <strong>2009</strong> 2008<br />
Employment costs $ 68.8 $ 48.1 $22.0 $10.2<br />
Environmental 10.2 14.1 71.5 71.5<br />
Taxes 7.8 5.0 — —<br />
Post-retirement benefits 4.6 10.1 — —<br />
Interest 5.2 4.8 — —<br />
Pension 4.6 4.6 — —<br />
Employee separation and plant<br />
phaseout 5.3 25.5 — —<br />
Insurance accruals 0.4 0.3 0.8 0.2<br />
Deferred tax liabilities 0.5 — 3.8 —<br />
Other 9.6 5.7 0.5 1.5<br />
$117.0 $118.2 $98.6 $83.4<br />
Note 11 — EMPLOYEE BENEFIT PLANS<br />
We have several pension plans; however, as of December 31, <strong>2009</strong>,<br />
only certain foreign plans accrue benefits. The plans generally<br />
provide benefit payments using a formula that is based upon<br />
employee compensation and length of service. All U.S. defined<br />
benefit pension plans are frozen from accruing benefits and are<br />
closed to new participants.<br />
On January 15, <strong>2009</strong>, we adopted amendments to the Geon Pension<br />
Plan (Geon Plan), the Benefit Restoration Plan (BRP), the<br />
voluntary retirement savings plan (RSP) and the Supplemental<br />
Retirement Benefit Plan (SRP). Effective March 20, <strong>2009</strong>, the<br />
amendments to the Geon Plan and the BRP permanently froze<br />
future benefit accruals and provide that participants will not receive<br />
credit under the Geon Plan or the BRP for any eligible earnings paid<br />
on or after that date. Additionally, certain benefits provided under<br />
the RSP and SRP were eliminated after March 20, <strong>2009</strong>. These<br />
actions resulted in a reduction of our <strong>2009</strong> annual benefit expense<br />
of $3.7 million and are expected to reduce our future pension fund<br />
contribution requirements by approximately $20 million.<br />
We also sponsor several unfunded defined benefit post-retirement<br />
plans that provide subsidized health care and life insurance<br />
benefits to certain retirees and a closed group of eligible employees.<br />
On September 1, <strong>2009</strong>, we adopted changes to our U.S. postretirement<br />
healthcare plan whereby, effective January 1, 2010, the<br />
plan, for certain eligible retirees, will be discontinued, and benefits<br />
will be phased out through December 31, 2012. Only certain<br />
POLYONE CORPORATION<br />
47
employees hired prior to December 31, 1999 are eligible to participate<br />
in our subsidized post-retirement health care and life insurance<br />
plans. These amendments resulted in a curtailment gain of<br />
$21.1 million in our <strong>2009</strong> results and decreased the accumulated<br />
pension benefit obligation by $58.1 million.<br />
The following tables present the change in benefit obligation, change in plan assets and components of funded status for defined benefit<br />
pension and post-retirement health care benefit plans. Actuarial assumptions that were used are also included.<br />
Pension Benefits<br />
Health Care Benefits<br />
(In millions) <strong>2009</strong> 2008 <strong>2009</strong> 2008<br />
Change in benefit obligation:<br />
Projected benefit obligation — beginning of year $ 501.2 $ 487.1 $ 91.0 $ 91.5<br />
Service cost 1.4 1.3 0.1 0.3<br />
Interest cost 30.7 32.4 4.1 5.5<br />
Participant contributions 0.1 — 5.9 6.0<br />
Benefits paid (38.9) (37.0) (10.9) (12.1)<br />
Plan amendments/settlements (18.0) 2.2 (58.1) 6.1<br />
Change in discount rate and other 22.2 15.2 (5.5) (6.3)<br />
Projected benefit obligation — end of year $ 498.7 $ 501.2 $ 26.6 $ 91.0<br />
Projected salary increases 2.1 19.9 — —<br />
Accumulated benefit obligation $ 496.6 $ 481.3 $ 26.6 $ 91.0<br />
Change in plan assets:<br />
Plan assets — beginning of year $ 271.9 $ 401.3 $ — $ —<br />
Actual return on plan assets 63.7 (120.8) — —<br />
Company contributions 23.5 29.8 5.0 6.1<br />
Plan participants’ contributions 0.1 — 5.9 6.0<br />
Benefits paid (38.9) (37.0) (10.9) (12.1)<br />
Other 0.3 (1.4) — —<br />
Plan assets — end of year $ 320.6 $ 271.9 $ — $ —<br />
Under-funded status at end of year $(178.1) $(229.3) $(26.6) $(91.0)<br />
Plan assets of $320.6 million and $271.9 million as of December 31, <strong>2009</strong> and 2008, respectively, relate to our funded pension plans<br />
that have a projected benefit obligation of $455.4 million and $458.1 million as of December 31, <strong>2009</strong> and 2008, respectively. As of<br />
December 31, <strong>2009</strong> and 2008, we are 70% and 59% funded, respectively, in regards to these plans and their respective projected benefit<br />
obligation.<br />
Amounts included in the accompanying consolidated balance sheets are as follows:<br />
Pension Benefits<br />
Health Care Benefits<br />
(In millions) <strong>2009</strong> 2008 <strong>2009</strong> 2008<br />
Other non-current assets $ 0.3 $ 0.3 $ — $ —<br />
Current liabilities 5.0 4.6 4.6 10.1<br />
Long-term liabilities 173.4 225.0 22.0 80.9<br />
Amounts recognized in AOCI:<br />
Pension Benefits<br />
Health Care Benefits<br />
(In millions) <strong>2009</strong> 2008 <strong>2009</strong> 2008<br />
Net loss $229.0 $279.4 $ 8.9 $ 15.7<br />
Prior service loss (credit) 1.2 1.2 (52.3) (24.4)<br />
$230.2 $280.6 $(43.4) $ (8.7)<br />
POLYONE CORPORATION<br />
48
Change in AOCI:<br />
Pension Benefits<br />
Health Care Benefits<br />
(In millions) <strong>2009</strong> 2008 <strong>2009</strong> 2008<br />
AOCI in prior year $280.6 $114.8 $ (8.7) $(13.8)<br />
Prior service (cost) credit recognized during year (0.5) (0.2) 30.3 5.5<br />
Prior service (cost) credit occurring in the year 0.5 1.9 (58.1) 6.1<br />
Net loss (gain) recognized during the year (12.0) (7.7) (0.6) (1.1)<br />
Net (gain) loss occurring in the year (38.5) 172.1 (6.4) (4.8)<br />
Other adjustments 0.1 (0.3) 0.1 (0.6)<br />
AOCI in current year $230.2 $280.6 $(43.4) $ (8.7)<br />
As of December 31, <strong>2009</strong> and 2008, we had plans with total projected and accumulated benefit obligations in excess of the related plan<br />
assets as follows:<br />
Pension Benefits<br />
Health Care Benefits<br />
(In millions) <strong>2009</strong> 2008 <strong>2009</strong> 2008<br />
Projected benefit obligation $497.9 $499.6 $26.6 $91.0<br />
Accumulated benefit obligation 495.9 480.2 26.6 91.0<br />
Fair value of plan assets 319.6 270.4 — —<br />
Pension Benefits<br />
Health Care<br />
Benefits<br />
<strong>2009</strong> 2008 <strong>2009</strong> 2008<br />
Weighted-average assumptions used to determine benefit obligation at December 31:<br />
Discount rate 6.17% 6.62% 5.61% 6.65%<br />
Rate of compensation increase 3.5% 3.5% — —<br />
Assumed health care cost trend rates at December 31:<br />
Health care cost trend rate assumed for next year — — 9.25% 9.25%<br />
Rate to which the cost trend rate is assumed to decline (the ultimate trend rate) — — 5.00% 5.00%<br />
Year that the rate reaches the ultimate trend rate — — 2016 2015<br />
Assumed health care cost trend rates have an effect on the amounts reported for the health care plans. A one percentage point change<br />
in assumed health care cost trend rates would have the following impact:<br />
(In millions)<br />
One Percentage<br />
Point Increase<br />
One Percentage<br />
Point Decrease<br />
Effect on total of service and interest cost $0.2 $(0.2)<br />
Effect on post-retirement benefit obligation 1.2 (1.1)<br />
An expected return on plan assets of 8.5% will be used to determine the 2010 pension expense. The expected long-term rate of return on<br />
pension assets was determined after considering the historical experience of long-term asset returns by asset category, the expected<br />
investment portfolio mix by category of asset and estimated future long-term investment returns.<br />
The following table summarizes the components of net period benefit cost that was recognized during each of the years in the three-year<br />
period ended December 31, <strong>2009</strong>. Actuarial assumptions that were used are also included.<br />
Pension Benefits<br />
Health Care Benefits<br />
(In millions) <strong>2009</strong> 2008 2007 <strong>2009</strong> 2008 2007<br />
Components of net periodic benefit costs:<br />
Service cost $ 1.4 $ 1.3 $ 1.1 $ 0.1 $ 0.3 $ 0.4<br />
Interest cost 30.7 32.4 30.1 4.1 5.5 5.2<br />
Expected return on plan assets (21.8) (33.4) (31.8) — — —<br />
Amortization of net loss 12.1 7.5 9.6 0.6 1.2 1.7<br />
Curtailment (gain) loss and settlement charges (0.8) 0.5 0.3 (21.1) — —<br />
Amortization of prior service credit (cost) 0.8 0.2 (0.1) (9.1) (5.6) (5.8)<br />
$ 22.4 $ 8.5 $ 9.2 $(25.4) $ 1.4 $ 1.5<br />
POLYONE CORPORATION<br />
49
Pension Benefits<br />
Health Care Benefits<br />
<strong>2009</strong> 2008 2007 <strong>2009</strong> 2008 2007<br />
Weighted-average assumptions used to determine net periodic benefit cost for the years<br />
ended December 31:<br />
Discount rate 6.61% 6.78% 6.07% 6.50% 6.61% 6.02%<br />
Expected long-term return on plan assets 8.50% 8.50% 8.50% — — —<br />
Rate of compensation increase 3.5% 3.5% 3.5% — — —<br />
Assumed health care cost trend rates at December 31:<br />
Health care cost trend rate assumed for next year — — — 9.25% 9.25% 10.0%<br />
Rate to which the cost trend rate is assumed to decline (the ultimate trend rate) — — — 5.00% 5.00% 5.25%<br />
Year that the rate reaches the ultimate trend rate — — — 2015 2015 2013<br />
POLYONE CORPORATION<br />
The amounts in accumulated other comprehensive income that<br />
are expected to be amortized as net expense (income) during fiscal<br />
year 2010 are as follows:<br />
(In millions) Pension Benefits Health Care Benefits<br />
Amount of net prior service credit $0.8 $(17.4)<br />
Amount of net loss 9.3 0.7<br />
Our pension asset investment strategy is to diversify the asset<br />
portfolio among and within asset categories to enhance the portfolio’s<br />
risk-adjusted return. Our portfolio asset mix also considers the<br />
duration of plan liabilities, historical and expected returns of the<br />
asset investments, and the funded status of the plan. The pension<br />
asset allocation is reviewed and actively managed based on the<br />
funded status of the plan. As the funded status of the plan<br />
increases, the asset allocation is adjusted to decrease the level<br />
of risk. Based on the current funded status of the plan, our pension<br />
asset investment allocation guidelines are to invest 40% to 75% in<br />
equity securities, 15% to 45% in fixed income securities and 10% to<br />
30% in alternative investments. These alternative investments may<br />
include funds of multiple asset investment strategies and funds of<br />
hedge funds.<br />
Details of the pension plan assets as of December 31, <strong>2009</strong><br />
and 2008 are listed below. The fair value of the plan assets are<br />
presented using a three-tier hierarchy. The hierarchy indicates the<br />
extent to which inputs used in measuring fair value are observable<br />
in the market and are based on the following:<br />
Level 1 — quoted prices in active markets for identical instruments<br />
and are the most observable<br />
Level 2 — other significant observable inputs including quoted<br />
prices for similar assets and observable inputs such as interest<br />
rates, foreign currency exchange rates, commodity rates and yield<br />
curves<br />
Level 3 — significant unobservable inputs (including the fund’s<br />
own judgments about the assumptions market participants would<br />
use in pricing the investment)<br />
Fair Value of Plan Assets at December 31, <strong>2009</strong><br />
(In millions) Level 1 Level 2 Level 3 Total<br />
Asset category<br />
Cash $ 14.4 $— $ — $ 14.4<br />
Large cap equity funds 38.9 — — 38.9<br />
Mid cap equity funds 32.4 — — 32.4<br />
Small cap equity funds 28.4 — — 28.4<br />
Global equity funds 109.8 — — 109.8<br />
Fixed income funds 48.3 — — 48.3<br />
Multi-asset mutual fund 22.2 — — 22.2<br />
Floating rate income fund 11.0 — — 11.0<br />
Fund of hedge funds — — 15.2 15.2<br />
Total plan assets $305.4 $— $15.2 $320.6<br />
Large cap equity funds invest in publicly-traded equity securities<br />
of companies with a market capitalization typically in excess of<br />
$10 billion with a focus on growth or value. Mid cap equity funds<br />
invest in publicly-traded equity securities of companies with a market<br />
capitalization typically greater than $2 billion but less than $10 billion<br />
with a focus on growth or value. Small cap equity funds invest in<br />
publicly-traded equity securities of companies with a market capitalization<br />
typically less than $2 billion with a focus on growth or value.<br />
Global equity funds invest in publicly-traded equity securities of<br />
companies domiciled in the U.S., developed international countries,<br />
and emerging markets typically with a market capitalization greater<br />
than $2 billion with a focus on growth or value. Fixed income funds<br />
invest primarily in investment grade fixed income securities. The<br />
multi-asset mutual fund strategy is based on a diverse range of<br />
investments including, but not limited to, investment grade and high<br />
yield bonds, international and emerging market bonds, inflationindexed<br />
bonds, equities and commodities. The floating rate income<br />
fund strategy is to invest primarily in a diversified portfolio of first and<br />
second lien high-yield senior floating rate loans and other floating rate<br />
debt securities.<br />
Included in our Level 3 assets are investments in funds of<br />
hedge funds. The strategy of these investments is to achieve a<br />
return in excess of LIBOR by a margin of five hundred basis points<br />
annualized over a full market cycle by investing in 25 or more<br />
sub-hedge funds with a wide variety of different investment strategies.<br />
These investment funds use unobservable inputs that reflect<br />
assumptions market participants would be expected to use in<br />
50
pricing the asset. Unobservable inputs are used to measure fair<br />
value to the extent that observable inputs are not available and are<br />
developed based on the best information available under the circumstances.<br />
In developing unobservable inputs, market participant<br />
assumptions are used if they are reasonably available without<br />
undue cost and effort. Due to liquidity restrictions related to these<br />
investments, the plan redeemed one of the fund of hedge funds<br />
investments in <strong>2009</strong>, and the remaining fund of hedge funds<br />
investment has been scheduled to be redeemed in 2010.<br />
The following table is a reconciliation of our beginning and<br />
ending balances of our Level 3 assets for <strong>2009</strong>:<br />
(In millions)<br />
Level 3 plan assets — beginning of year $ 37.0<br />
Return on plan assets still held at year end 3.1<br />
Return on plan assets sold during the year (0.3)<br />
Purchases, sales and settlements, net (24.6)<br />
Level 3 plan assets — end of year 15.2<br />
The estimated future benefit payments for our pension and<br />
health care plans are as follows:<br />
(In millions)<br />
Pension<br />
Benefits<br />
Health Care<br />
Benefits<br />
Medicare<br />
Part D<br />
Subsidy<br />
2010 $ 37.6 $4.6 $0.2<br />
2011 38.1 3.6 0.2<br />
2012 37.8 2.9 0.1<br />
2013 38.0 2.2 0.1<br />
2014 38.2 2.1 0.1<br />
2015 through 2019 195.1 9.1 0.6<br />
We currently estimate that 2010 employer contributions will be<br />
$20.8 million to all qualified and nonqualified pension plans and<br />
$4.6 million to all health care benefit plans.<br />
We sponsor a voluntary retirement savings plan (RSP). Under<br />
the provisions of this plan, eligible employees receive defined<br />
Company contributions of 2% of their eligible earnings plus they<br />
are eligible for Company matching contributions based on the first<br />
6% of their eligible earnings contributed to the plan. In addition, we<br />
may make discretionary contributions to this plan for eligible<br />
employees based on a specific percentage of each employee’s<br />
compensation.<br />
Following are our contributions to the RSP:<br />
(In millions) <strong>2009</strong> 2008 2007<br />
Retirement savings match $5.8 $ 6.0 $ 5.7<br />
Retirement benefit contribution 3.7 4.8 4.9<br />
$9.5 $10.8 $10.6<br />
Note 12 — COMMITMENTS AND RELATED-PARTY INFORMATION<br />
Environmental — We have been notified by U.S. federal and state<br />
environmental agencies and by private parties that we may be a<br />
potentially responsible party (PRP) in connection with the investigation<br />
and remediation of a number of environmental waste<br />
disposal sites. While government agencies frequently assert that<br />
PRPs are jointly and severally liable at these sites, in our experience,<br />
interim and final allocations of liability costs are generally<br />
made based on the relative contribution of waste. We believe that<br />
our potential continuing liability with respect to these sites will not<br />
have a material adverse effect on our consolidated financial position,<br />
results of operations or cash flows. In addition, we initiate<br />
corrective and preventive environmental projects of our own to<br />
ensure safe and lawful activities at our operations. We believe that<br />
compliance with current governmental regulations at all levels will<br />
not have a material adverse effect on our financial condition.<br />
In September 2007, we were informed of rulings by the United<br />
States District Court for the Western District of Kentucky on several<br />
pending motions in the case of Westlake Vinyls, Inc. v. Goodrich<br />
Corporation, et al., which has been pending since 2003. The Court<br />
held that <strong>PolyOne</strong> must pay the remediation costs at the former<br />
Goodrich Corporation (now Westlake Vinyls, Inc.) Calvert City facility,<br />
together with certain defense costs of Goodrich Corporation. The<br />
rulings also provided that <strong>PolyOne</strong> can seek indemnification for<br />
contamination attributable to Westlake Vinyls.<br />
The environmental obligation at the site arose as a result of an<br />
agreement by our predecessor, The Geon Company, at the time of<br />
its spin-off from Goodrich Corporation in 1993, to indemnify Goodrich<br />
Corporation for environmental costs at the site. Neither Poly-<br />
One nor The Geon Company ever owned or operated the facility.<br />
Following the Court rulings, the parties to the litigation entered into<br />
settlement negotiations and agreed to settle all claims regarding<br />
past environmental costs incurred at the site. Subject to applicable<br />
insurance recoveries, we recorded a charge of $15.6 million and<br />
made payments, net of related receipts of $18.8 million, in 2007 for<br />
past remediation activities related to these Court rulings.<br />
Based on these same Court rulings and the settlement agreement,<br />
we adjusted our environmental reserve for future remediation<br />
costs, a portion of which already related to the Calvert City site,<br />
resulting in a charge of $28.8 million in 2007. The settlement<br />
agreement provides a mechanism to allocate future remediation<br />
costs at the Calvert City facility to Westlake Vinyls, Inc. We will<br />
adjust our environmental reserve in the future, consistent with any<br />
such future allocation of costs.<br />
Based on estimates prepared by our environmental engineers<br />
and consultants, we had accruals, totaling $81.7 million as of<br />
December 31, <strong>2009</strong> and $85.6 million as of December 31,<br />
2008 for probable future environmental expenditures relating to<br />
previously contaminated sites. These accruals are included in<br />
Accrued expenses and Other non-current liabilities on the accompanying<br />
consolidated balance sheets. The accruals represent our<br />
best estimate of the remaining probable remediation costs, based<br />
upon information and technology that is currently available and our<br />
view of the most likely remedy. Depending upon the results of future<br />
testing, the ultimate remediation alternatives undertaken, changes<br />
in regulations, new information, newly discovered conditions and<br />
other factors, it is reasonably possible that we could incur additional<br />
costs in excess of the accrued amount at December 31,<br />
POLYONE CORPORATION<br />
51
POLYONE CORPORATION<br />
<strong>2009</strong>. However, such additional costs, if any, cannot be currently<br />
estimated. Our estimate of this liability may be revised as new<br />
regulations or technologies are developed or additional information<br />
is obtained. These remediation costs are expected to be paid over<br />
the next 30 years.<br />
The following table details the changes in the environmental<br />
accrued liabilities:<br />
(In millions) <strong>2009</strong> 2008 2007<br />
Balance at beginning of the year $ 85.6 $ 83.8 $ 59.5<br />
Environmental remediation (benefit)<br />
expenses, net of recoveries (12.2) 15.6 48.8<br />
Cash receipts (payments), net of<br />
insurance recoveries 7.6 (12.6) (25.5)<br />
Translation and other adjustments 0.7 (1.2) 1.0<br />
Balance at end of year $ 81.7 $ 85.6 $ 83.8<br />
Our environmental expense is presented net of insurance and<br />
other recoveries of $23.9 million in <strong>2009</strong> and $1.5 million in 2008<br />
and is included in Cost of sales in the accompanying consolidated<br />
statements of operations. There were no insurance recoveries<br />
during 2007. In <strong>2009</strong>, we received $23.9 million from our former<br />
parent company as partial reimbursement of certain previously<br />
incurred environmental remediation costs. In 2007, environmental<br />
expense included the $15.6 million charge related to the settlement<br />
agreement and the $28.8 million reserve adjustment discussed<br />
above.<br />
Guarantees — We guarantee $48.8 million of SunBelt’s outstanding<br />
senior secured notes in connection with the construction<br />
of a chlor-alkali facility in McIntosh, Alabama. This debt matures in<br />
equal installments annually until 2017.<br />
Related-Party Transactions — We purchase a substantial portion<br />
of our PVC resin and all of our vinyl chloride monomer (VCM) raw<br />
materials under supply agreements with OxyVinyls. We have also<br />
entered into various service agreements with OxyVinyls. We sold our<br />
24% equity interest in OxyVinyls on July 6, 2007. Purchases of raw<br />
materials from OxyVinyls were $152 million for the six months<br />
ended June 30, 2007.<br />
Note 13 — OTHER EXPENSE, NET<br />
Other expense, net for the years ended December 31, <strong>2009</strong>, 2008<br />
and 2007 consist of the following:<br />
(In millions) <strong>2009</strong> 2008 2007<br />
Currency exchange gain (loss) $(0.1) $ 1.2 $(5.0)<br />
Foreign exchange contracts (loss) gain (7.9) (1.3) 0.7<br />
Discount on sale of trade receivables (1.3) (3.6) (2.0)<br />
Impairment of available for sale security — (0.6) —<br />
Other expense, net (0.3) (0.3) (0.3)<br />
$(9.6) $(4.6) $(6.6)<br />
Note 14 — INCOME TAXES<br />
For financial statement reporting purposes, income before income<br />
taxes is summarized below based on the geographic location of the<br />
operation to which such earnings are attributable. Certain foreign<br />
operations are branches of <strong>PolyOne</strong> and are, therefore, subject to<br />
United States (U.S.) as well as foreign income tax regulations. As a<br />
result, pre-tax income by location and the components of income tax<br />
expense by taxing jurisdiction are not directly related.<br />
Income (loss) before income taxes and discontinued operations<br />
for the periods ended December 31, <strong>2009</strong>, 2008 and 2007<br />
consists of the following:<br />
(In millions) <strong>2009</strong> 2008 2007<br />
Domestic $51.6 $(138.8) $(57.7)<br />
Foreign 2.9 (32.3) 25.3<br />
$54.5 $(171.1) $(32.4)<br />
A summary of income tax (expense) benefit for the periods<br />
ended December 31, <strong>2009</strong>, 2008 and 2007 is as follows:<br />
(In millions) <strong>2009</strong> 2008 2007<br />
Current:<br />
Federal $ 4.0 $ — $ (3.3)<br />
State 4.3 (3.9) (3.2)<br />
Foreign 10.9 (8.5) (6.8)<br />
Total current $19.2 $ (12.4) $(13.3)<br />
Deferred:<br />
Federal $ (1.7) $ (88.6) $ 55.3<br />
State — (3.3) 2.6<br />
Foreign (4.2) 2.5 (0.8)<br />
Total deferred $ (5.9) $ (89.4) $ 57.1<br />
Total tax benefit (expense) $13.3 $(101.8) $ 43.8<br />
The principal items accounting for the difference in income<br />
taxes computed at the U.S. statutory rate for the periods ended<br />
December 31, <strong>2009</strong>, 2008 and 2007 are as follows:<br />
(In millions) <strong>2009</strong> 2008 2007<br />
Computed tax (expense) benefit at<br />
35% of income (loss) from<br />
continuing operations before taxes $(19.1) $ 59.9 $11.3<br />
State tax, net of federal benefit 2.8 (2.5) (0.4)<br />
Differences in rates of foreign<br />
operations 4.5 1.2 2.6<br />
Changes in valuation allowances 23.3 (105.9) (1.0)<br />
Impact from sale of interest in<br />
OxyVinyls — — 31.5<br />
Impact of goodwill impairment charge 0.6 (54.2) —<br />
Recognition of uncertain tax positions 1.2 (0.3) —<br />
Other, net — — (0.2)<br />
Income tax benefit (expense) $ 13.3 $(101.8) $43.8<br />
We have U.S. federal net operating loss carryforwards of<br />
$66.0 million, which expire at various dates from 2024 through<br />
2028 and combined state net operating loss carryforwards of<br />
$314.6 million, which expire at various dates from 2010 through<br />
52
2029. Various foreign subsidiaries have net operating loss carryforwards<br />
totaling $34.5 million, which expire at various dates from<br />
2010 through 2019. We have provided valuation allowances of<br />
$42.9 million against many loss carryforwards.<br />
Components of our deferred tax liabilities and assets as of<br />
December 31, <strong>2009</strong> and 2008 were as follows:<br />
(In millions) <strong>2009</strong> 2008<br />
Deferred tax liabilities:<br />
Tax over book depreciation $ 26.2 $ 36.6<br />
Intangibles 2.8 2.9<br />
Equity investments — 1.7<br />
Other, net 10.8 7.5<br />
Total deferred tax liabilities $ 39.8 $ 48.7<br />
Deferred tax assets:<br />
Equity investments $ 1.6 $ —<br />
Post-retirement benefits other than pensions 9.7 36.1<br />
Employment cost and pension 61.0 77.7<br />
Environmental 28.1 29.4<br />
Net operating loss carryforward 32.7 41.9<br />
State taxes 21.2 23.6<br />
Alternative minimum tax credit carryforward 8.3 12.5<br />
Other, net 13.9 16.5<br />
Total deferred tax assets $ 176.5 $ 237.7<br />
Tax valuation allowance (132.9) (187.5)<br />
Net deferred tax assets $ 3.8 $ 1.5<br />
The deferred asset related to state taxes and the related<br />
valuation allowance were each increased from amounts previously<br />
reported by $18.4 million associated with state net operating<br />
losses in states in which realization of the related tax benefits<br />
do not meet the more likely than not threshold.<br />
No provision has been made for income taxes on undistributed<br />
earnings of consolidated non-United States subsidiaries of<br />
$151 million at December 31, <strong>2009</strong> since it is our intention to<br />
indefinitely reinvest undistributed earnings of our foreign subsidiaries.<br />
It is not practicable to estimate the additional income taxes<br />
and applicable foreign withholding taxes that would be payable on<br />
the remittance of such undistributed earnings.<br />
We received worldwide income tax refunds of $0.2 million in<br />
<strong>2009</strong>, net of payments of $15.3 million. Worldwide income tax<br />
payments in 2008 and 2007 were $9.6 million and $18.3 million,<br />
respectively.<br />
As of December 31, <strong>2009</strong>, we have an $8.0 million liability for<br />
uncertain tax positions all of which, if recognized, would impact the<br />
effective tax rate. We expect that the amount of uncertain tax<br />
positions will change in the next twelve months due to the resolution<br />
of an income tax audit in a foreign jurisdiction.<br />
We recognize interest and penalties related to uncertain tax<br />
positions in the provision for income taxes. As of December 31,<br />
<strong>2009</strong> and December 31, 2008, we have accrued $0.6 million and<br />
$2.5 million of interest and penalties, respectively.<br />
A reconciliation of the beginning and ending amount of unrecognized<br />
tax benefits is as follows:<br />
Unrecognized Tax<br />
Benefits<br />
(In millions) <strong>2009</strong> 2008<br />
Balance as of January 1 $ 6.3 $6.0<br />
Additions based on tax positions related to the<br />
current year 0.9 —<br />
Additions for tax positions of prior years 7.1 0.3<br />
Reductions for tax positions of prior years (6.0) —<br />
Settlements (0.3) —<br />
Balance as of December 31 $ 8.0 $6.3<br />
We are no longer subject to U.S. income tax examinations for<br />
periods preceding 2005, and with limited exceptions, for periods<br />
preceding 2002 for both foreign and state and local tax<br />
examinations.<br />
Note 15 — SHARE-BASED COMPENSATION<br />
Share-based compensation cost is based on the value of the portion<br />
of share-based payment awards that are ultimately expected to<br />
vest during the period. Share-based compensation cost recognized<br />
in the accompanying consolidated statements of operations for the<br />
years ended December 31, <strong>2009</strong>, 2008 and 2007 includes compensation<br />
cost for share-based payment awards based on the grant<br />
date fair value estimated in accordance with the provision of FASB<br />
ASC Topic 718, Compensation — Stock Compensation. Because<br />
share-based compensation expense recognized in the accompanying<br />
consolidated statements of operations for the years ended<br />
December 31, <strong>2009</strong>, 2008 and 2007 is based on awards ultimately<br />
expected to vest, it has been reduced for estimated forfeitures. We<br />
estimate forfeitures at the time of grant and revise that estimate, if<br />
necessary, in subsequent periods if actual forfeitures differ from<br />
those estimates.<br />
We have one active share-based compensation plan, which is<br />
described below. Share-based compensation is included in Selling<br />
and administrative in the accompanying consolidated statements of<br />
operations. A summary of compensation expense by type of award<br />
follows:<br />
(In millions) <strong>2009</strong> 2008 2007<br />
Stock appreciation rights $1.2 $1.5 $ 4.1<br />
Restricted stock units 1.3 0.8 —<br />
Restricted stock awards 0.1 0.7 0.7<br />
Performance shares — — (0.5)<br />
Total share-based compensation $2.6 $3.0 $ 4.3<br />
2008 Equity and Performance Incentive Plan<br />
In May 2008, our shareholders approved the <strong>PolyOne</strong> Corporation<br />
2008 Equity and Performance Incentive Plan (2008 EPIP). This plan<br />
replaced the 2005 Equity and Performance Incentive Plan (2005<br />
EPIP). The 2005 EPIP was frozen upon the approval of the 2008<br />
EPIP in May 2008. The 2008 EPIP provides for the award of a variety<br />
POLYONE CORPORATION<br />
53
of share-based compensation alternatives, including non-qualified<br />
stock options, incentive stock options, restricted stock, restricted<br />
stock units (RSUs), performance shares, performance units and<br />
stock appreciation rights (SARs). A total of five million shares of<br />
common stock have been reserved for grants and awards under the<br />
2008 EPIP. It is anticipated that all share-based grants and awards<br />
that are earned and exercised will be issued from shares of <strong>PolyOne</strong><br />
common stock that are held in treasury.<br />
Stock Appreciation Rights<br />
During the years ended December 31, <strong>2009</strong>, 2008 and 2007, the<br />
total number of SARs granted were 1,411,000, 1,094,400 and<br />
1,626,900, respectively. The <strong>2009</strong> awards vest in one-third increments<br />
annually over a three-year service period and the achievement<br />
of certain stock price targets. The 2008 awards vest in onethird<br />
increments annually over a three-year service period. The<br />
2007 awards vest based on a service period of one year and the<br />
achievement of certain stock price targets. All SARs expire seven<br />
years after the date of grant.<br />
The SARs granted during <strong>2009</strong> and 2007 were valued using a<br />
Monte Carlo simulation method as the vesting is dependent on the<br />
achievement of certain stock price targets. The expected term of<br />
options granted was set equal to the midpoint between the vesting<br />
and expiration dates for each grant. The expected volatility was<br />
determined based on the average weekly volatility for our common<br />
stock for the contractual life of the awards. Dividends were not<br />
included in this calculation because we do not currently pay dividends.<br />
The risk-free rate of return was based on available yields on<br />
U.S. Treasury bills of the same duration as the contractual life of the<br />
awards. Forfeitures were estimated at 3% per year based on our<br />
historical experience.<br />
The SARs granted during 2008 were valued using the Black-<br />
Scholes method as the awards only have time-based vesting<br />
requirements. The expected term of SARs granted was determined<br />
based on the “simplified method” described in Staff Accounting<br />
Bulletin (SAB) Topic 14.D.2, which is permitted if historical exercise<br />
experience is not sufficient. The expected volatility was determined<br />
based on the average weekly volatility for our common stock for the<br />
expected term of the awards. Dividends were not included in this<br />
calculation because we do not currently pay dividends. The risk-free<br />
rate of return was based on available yields on U.S. Treasury bills of<br />
the same duration as the expected option term. Forfeitures were<br />
estimated at 3% per year based on our historical experience.<br />
The following is a summary of the assumptions related to the grants issued during <strong>2009</strong>, 2008 and 2007:<br />
<strong>2009</strong> 2008 2007<br />
Expected volatility (weighted-average) 49.7% 36.9% 44.1%<br />
Expected dividends — — —<br />
Expected term (in years) 4.5 — 5.6 4.5 4.0 — 4.4<br />
Risk-free rate 3.25% 2.48% — 3.08% 3.88% — 4.30%<br />
Value of SARs granted $0.61 — $0.68 $2.26 — $2.68 $2.68 — $3.05<br />
A summary of SAR activity under the 2008 EPIP as of December 31, <strong>2009</strong> and during <strong>2009</strong> is presented below:<br />
Weighted-Average Weighted-Average Aggregate<br />
(Shares in thousands, dollars in millions, except per share data)<br />
Exercise Price Remaining Intrinsic<br />
Stock Appreciation Rights<br />
Shares Per Share Contractual Term Value<br />
Outstanding as of January 1, <strong>2009</strong> 4,015 $7.18<br />
Granted 1,411 1.43<br />
Exercised (1) 6.77<br />
Forfeited or expired (215) 6.36<br />
Outstanding as of December 31, <strong>2009</strong> 5,210 5.66 4.33 years $10.8<br />
Vested and exercisable as of December 31, <strong>2009</strong> 2,762 7.14 3.47 years $ 1.9<br />
POLYONE CORPORATION<br />
The weighted-average grant date fair value of SARs granted<br />
during <strong>2009</strong>, 2008 and 2007 was $0.65, $2.28, and $2.74,<br />
respectively. The total intrinsic value of SARs that were exercised<br />
during <strong>2009</strong>, 2008 and 2007 was less than $0.1 million for each<br />
year. As of December 31, <strong>2009</strong>, there was $1.4 million of total<br />
unrecognized compensation cost related to SARs, which is<br />
expected to be recognized over the next 28 months.<br />
Restricted Stock Units<br />
During <strong>2009</strong>, 810,100 RSU’s were granted to key employees. A<br />
RSU represents a contingent right to receive one share of our<br />
common stock at a future date provided there is a continuous<br />
three-year service period and the achievement of certain stock<br />
price targets. The RSUs were valued using a Monte Carlo simulation<br />
method as the award is dependent on the achievement of certain<br />
stock price targets. The expected term of the awards granted was<br />
set at three years, consistent with the performance period of the<br />
awards. The expected volatility was determined to be 53.3% based<br />
on the three-year historical average weekly volatility for our common<br />
stock. Dividends were not included in this calculation because we<br />
do not currently pay dividends. The risk-free rate of return was<br />
estimated as 1.5% based on available yields on U.S. Treasury bills<br />
for three-years as of the grant date of the awards. Forfeitures were<br />
estimated at 3% per year based on our historical experience.<br />
54
During 2008, RSUs were granted to executives and other key<br />
employees. The only attainment requirement for the 2008 awards<br />
is a continuous three-year service period. Compensation expense is<br />
measured on the grant date using the quoted market price of our<br />
common stock and is recognized on a straight-line basis over the<br />
requisite service period.<br />
As of December 31, <strong>2009</strong>, 1,258,392 RSUs remain unvested<br />
with a weighted-average grant date fair value of $3.30 and a<br />
weighted-average remaining contractual term of 22 months. Unrecognized<br />
compensation cost for RSUs at December 31, <strong>2009</strong> was<br />
$1.9 million.<br />
Restricted Stock Awards<br />
In 2007, we issued restricted stock as part of the compensation<br />
package for executives and other key employees. The value of the<br />
restricted stock was established using the market price of our<br />
common stock on the date of grant. Compensation expense is<br />
being recorded on a straight-line basis over the three-year cliff<br />
vesting period of the restricted stock. As of December 31, <strong>2009</strong>,<br />
12,100 shares of restricted stock remain unvested with a weightedaverage<br />
grant date fair value of $7.28 and a weighted-average<br />
remaining contractual term of ten months. Unrecognized compensation<br />
cost for restricted stock awards as of December 31, <strong>2009</strong><br />
was less than $0.1 million.<br />
Stock Options<br />
Our incentive stock plans previously provided for the award or grant<br />
of options to purchase our common stock. Options were granted in<br />
2004 and prior years. Options granted generally became exercisable<br />
at the rate of 35% after one year, 70% after two years and 100%<br />
after three years. The term of each option does not extend beyond<br />
10 years from the date of grant. All options were granted at 100% or<br />
greater of market value (as defined) on the date of the grant.<br />
A summary of option activity as of December 31, <strong>2009</strong> and changes during <strong>2009</strong> follows:<br />
Weighted-Average Weighted-Average Aggregate<br />
(Shares in thousands, dollars in millions, except per share data)<br />
Exercise Price Per Remaining Intrinsic<br />
Options<br />
Shares<br />
Share<br />
Contractual Term Value<br />
Outstanding as of January 1, <strong>2009</strong> 3,377 $11.43<br />
Exercised — —<br />
Forfeited or expired (1,550) 13.57<br />
Outstanding, vested and exercisable as of December 31, <strong>2009</strong> 1,827 10.10 1.36 years $0.4<br />
No stock options were exercised during <strong>2009</strong>. The total intrinsic value of stock options that were exercised during 2008 and 2007 was<br />
$0.4 million and $0.2 million, respectively. Cash received during 2008 and 2007 from the exercise of stock options was $1.1 million and<br />
$1.2 million, respectively.<br />
Note 16 — SEGMENT INFORMATION<br />
A segment is a component of an enterprise whose operating results<br />
are regularly reviewed by the enterprise’s chief operating decision<br />
maker to make decisions about resources to be allocated to the<br />
segment and assess its performance, and for which discrete financial<br />
information is available. We have six reportable segments:<br />
International Color and Engineered Materials; Specialty Engineered<br />
Materials; Specialty Color, Additives and Inks; Performance Products<br />
and Solutions; <strong>PolyOne</strong> Distribution; and Resin and<br />
Intermediates.<br />
Operating income is the primary measure that is reported to<br />
the chief operating decision maker for purposes of making decisions<br />
about allocating resources to the segment and assessing its<br />
performance. Operating income at the segment level does not<br />
include: corporate general and administrative costs that are not<br />
allocated to segments; intersegment sales and profit eliminations;<br />
charges related to specific strategic initiatives such as the consolidation<br />
of operations; restructuring activities, including employee<br />
separation costs resulting from personnel reduction programs,<br />
plant closure and phaseout costs; executive separation agreements;<br />
share-based compensation costs; asset impairments; environmental<br />
remediation costs for facilities no longer owned or closed<br />
in prior years; gains and losses on the divestiture of joint ventures<br />
and equity investments; and certain other items that are not<br />
included in the measure of segment profit or loss that is reported<br />
to and reviewed by the chief operating decision maker. These costs<br />
are included in Corporate and eliminations.<br />
Segment assets are primarily customer receivables, inventories,<br />
net property, plant and equipment, and goodwill. Intersegment<br />
sales are generally accounted for at prices that approximate those<br />
for similar transactions with unaffiliated customers. Corporate and<br />
eliminations includes cash, sales of accounts receivable, retained<br />
assets and liabilities of discontinued operations, and other unallocated<br />
corporate assets and liabilities. The accounting policies of<br />
each segment are consistent with those described in Note 1, Summary<br />
of Significant Accounting Policies. Following is a description of<br />
each of our six reportable segments.<br />
International Color and Engineered Materials<br />
The International Color and Engineered Materials operating segment<br />
combines the strong regional heritage of our color and additive<br />
masterbatches and engineered materials operations to create<br />
POLYONE CORPORATION<br />
55
POLYONE CORPORATION<br />
global capabilities with plants, sales and service facilities located<br />
throughout Europe and Asia.<br />
Working in conjunction with our Specialty Color, Additives and<br />
Inks and North American Engineered Materials operating segments,<br />
we provide solutions that meet our international customers’<br />
demands for both global and local manufacturing, service and<br />
technical support.<br />
Specialty Engineered Materials<br />
The Specialty Engineered Materials operating segment is a leading<br />
provider of custom plastic compounding services and solutions for<br />
processors of thermoplastic materials across a wide variety of<br />
markets and end-use applications including those that currently<br />
employ traditional materials such as metal. Specialty Engineered<br />
Materials’ product portfolio, one of the broadest in our industry,<br />
includes standard and custom formulated high-performance polymer<br />
compounds that are manufactured using a full range of thermoplastic<br />
compounds and elastomers, which are then combined<br />
with advanced polymer additive, reinforcement, filler, colorant<br />
and/or biomaterial technologies.<br />
With a depth of compounding expertise, we are able to expand<br />
the performance range and structural properties of traditional<br />
engineering-grade thermoplastic resins that meet our customers’<br />
unique performance requirements. Our product development and<br />
application reach is further enhanced by the capabilities of our<br />
North American Engineered Materials Solutions Center, which produces<br />
and evaluates prototype and sample parts to help assess<br />
end-use performance and guide product development. Our manufacturing<br />
capabilities are targeted at meeting our customers’<br />
demand for speed, flexibility and critical quality.<br />
This segment also includes GLS, which we acquired in January<br />
2008. GLS is a global developer of innovative TPE and offers the<br />
broadest range of soft-touch TPE materials in the industry.<br />
Specialty Color, Additives and Inks<br />
The Specialty Color, Additives and Inks operating segment is a<br />
leading provider of specialized color and additive concentrates as<br />
well as inks and latexes.<br />
Color and additive products include an innovative array of<br />
colors, special effects and performance-enhancing and eco-friendly<br />
solutions. Our color masterbatches contain a high concentration of<br />
color pigments and/or additives that are dispersed in a polymer<br />
carrier medium and are sold in pellet, liquid, flake or powder form.<br />
When combined with non pre-colored base resins, our colorants<br />
help our customers achieve a wide array of specialized colors and<br />
effects that are targeted at the demands of today’s highly designoriented<br />
consumer and industrial end markets. Our additive masterbatches<br />
encompass a wide variety of performance enhancing characteristics<br />
and are commonly categorized by the function that they<br />
perform, such as UV stabilization, anti-static, chemical blowing,<br />
antioxidant and lubricant, and processing enhancement.<br />
Our colorant and additives masterbatches are used in most<br />
plastics manufacturing processes, including injection molding,<br />
extrusion, sheet, film, rotational molding and blow molding throughout<br />
the plastics industry, particularly in the packaging, transportation,<br />
consumer, outdoor decking, pipe and wire and cable markets.<br />
They are also incorporated into such end-use products as stadium<br />
seating, toys, housewares, vinyl siding, pipe, food packaging and<br />
medical packaging.<br />
This segment also provides custom-formulated liquid systems<br />
that meet a variety of customer needs and chemistries, including<br />
vinyl, natural rubber and latex, polyurethane and silicone. Products<br />
include proprietary fabric screen-printing inks and latexes for diversified<br />
markets that range from recreational and athletic apparel,<br />
construction and filtration to outdoor furniture and healthcare. In<br />
addition, we have a 50% interest in BayOne, a joint venture between<br />
<strong>PolyOne</strong> and Bayer Corporation, which sells liquid polyurethane<br />
systems into many of the same markets.<br />
Performance Products and Solutions<br />
The Performance Products and Solutions operating segment is a<br />
global leader offering an array of products and services for vinyl<br />
coating, molding and extrusion processors. Our product offerings<br />
include: rigid, flexible and dry blend vinyl compounds; industryleading<br />
dispersion, blending and specialty suspension grade vinyl<br />
resins; and specialty coating materials based largely on vinyl. These<br />
products are sold to a wide variety of manufacturers of plastic parts<br />
and consumer-oriented products. We also offer a wide range of<br />
services to the customer base utilizing these products to meet the<br />
ever changing needs of our multi-market customer base. These<br />
services include materials testing and component analysis, custom<br />
compound development, colorant and additive services, design<br />
assistance, structural analyses, process simulations and extruder<br />
screw design.<br />
Much of the revenue and income for Performance Products and<br />
Solutions is generated in North America. However, sales in Asia and<br />
Europe constitute a minor but growing portion of this segment. In<br />
addition, we owned 50% of a joint venture producing and marketing<br />
vinyl compounds in Latin America through the disposition date of<br />
October 13, <strong>2009</strong>.<br />
Vinyl is one of the most widely used plastics, utilized in a wide<br />
range of applications in building and construction, wire and cable,<br />
consumer and recreation markets, transportation, packaging and<br />
healthcare. Vinyl resin can be combined with a broad range of<br />
additives, resulting in performance versatility, particularly when fire<br />
resistance, chemical resistance or weatherability is required. We<br />
believe we are well-positioned to meet the stringent quality, service<br />
and innovation requirements of this diverse and highly competitive<br />
marketplace.<br />
This operating segment also includes Producer Services, which<br />
offers custom compounding services to resin producers and processors<br />
that design and develop their own compound and masterbatch<br />
recipes. Customers often require high quality, cost effective<br />
and confidential services. As a strategic and integrated supply chain<br />
56
partner, Producer Services offers resin producers a way to develop<br />
custom products for niche markets by using our compounding<br />
expertise and multiple manufacturing platforms.<br />
<strong>PolyOne</strong> Distribution<br />
The <strong>PolyOne</strong> Distribution operating segment distributes more than<br />
3,500 grades of engineering and commodity grade resins, including<br />
<strong>PolyOne</strong>-produced compounds, to the North American market.<br />
These products are sold to over 5,000 custom injection molders<br />
and extruders who, in turn, convert them into plastic parts that are<br />
sold to end-users in a wide range of industries. Representing over<br />
20 major suppliers, we offer our customers a broad product portfolio,<br />
just-in-time delivery from multiple stocking locations and local<br />
technical support.<br />
Resin and Intermediates<br />
We report the results of our Resin and Intermediates operating<br />
segment on the equity method. This segment consists almost<br />
entirely of our 50% equity interest in SunBelt and our former<br />
24% equity interest in OxyVinyls, through its disposition date of<br />
July 6, 2007. SunBelt, a producer of chlorine and caustic soda, is a<br />
partnership with Olin Corporation. OxyVinyls, a producer of PVC<br />
resins, VCM and chlorine and caustic soda, was a partnership with<br />
Occidental Chemical Corporation. In <strong>2009</strong>, SunBelt had production<br />
capacity of approximately 320 thousand tons of chlorine and 358<br />
thousand tons of caustic soda. Most of the chlorine manufactured<br />
by SunBelt is consumed by OxyVinyls to produce PVC resin. Caustic<br />
soda is sold on the merchant market to customers in the pulp and<br />
paper, chemical, building and construction and consumer products<br />
industries.<br />
Financial information by reportable segment is as follows:<br />
Year Ended December 31, <strong>2009</strong><br />
(In millions)<br />
Sales to External<br />
Customers Intersegment Sales Total Sales<br />
Operating<br />
Income (Loss)<br />
Depreciation and<br />
Amortization<br />
Capital<br />
Expenditures<br />
International Color and Engineered<br />
Materials $ 459.4 $ — $ 459.4 $ 22.6 $14.7 $11.7 $ 294.4<br />
Specialty Engineered Materials 184.8 23.8 208.6 16.2 7.0 2.3 180.9<br />
Specialty Color, Additives and Inks 192.9 1.8 194.7 14.2 7.3 3.2 107.3<br />
Performance Products and Solutions 600.5 67.2 667.7 43.5 22.3 11.5 346.1<br />
<strong>PolyOne</strong> Distribution 623.1 2.0 625.1 24.8 1.3 0.3 152.3<br />
Resin and Intermediates — — — 25.5 0.3 — 2.0<br />
Corporate and eliminations — (94.8) (94.8) (48.4) 11.9 2.7 308.9<br />
Total $2,060.7 $ — $2,060.7 $ 98.4 $64.8 $31.7 $1,391.9<br />
Total<br />
Assets<br />
Year Ended December 31, 2008<br />
(In millions)<br />
Sales to External<br />
Customers Intersegment Sales Total Sales<br />
Operating<br />
Income (Loss)<br />
Depreciation and<br />
Amortization<br />
Capital<br />
Expenditures<br />
International Color and Engineered<br />
Materials $ 587.4 $ — $ 587.4 $ 20.4 $16.1 $11.7 $ 341.2<br />
Specialty Engineered Materials 223.0 29.3 252.3 12.9 6.3 4.4 215.8<br />
Specialty Color, Additives and Inks 225.8 2.8 228.6 13.5 8.0 3.3 139.7<br />
Performance Products and Solutions 910.9 90.5 1,001.4 34.9 24.9 14.7 321.8<br />
<strong>PolyOne</strong> Distribution 791.6 5.1 796.7 28.1 1.7 0.1 149.8<br />
Resin and Intermediates — — — 28.6 0.2 — 7.3<br />
Corporate and eliminations — (127.7) (127.7) (267.7) 10.8 8.3 102.1<br />
Total $2,738.7 $ — $2,738.7 $(129.3) $68.0 $42.5 $1,277.7<br />
Total<br />
Assets<br />
Year Ended December 31, 2007<br />
(In millions)<br />
Sales to External<br />
Customers Intersegment Sales Total Sales<br />
Operating<br />
Income (Loss)<br />
Depreciation and<br />
Amortization<br />
Capital<br />
Expenditures<br />
International Color and Engineered<br />
Materials $ 588.6 $ — $ 588.6 $ 25.1 $14.4 $20.3 $ 412.5<br />
Specialty Engineered Materials 98.1 26.2 124.3 (2.2) 3.9 1.1 56.6<br />
Specialty Color, Additives and Inks 230.8 1.2 232.0 7.0 8.8 2.6 159.5<br />
Performance Products and Solutions 985.6 101.2 1,086.8 57.5 23.7 14.4 559.6<br />
<strong>PolyOne</strong> Distribution 739.6 4.7 744.3 22.1 1.7 0.1 175.2<br />
Resin and Intermediates — — — 34.8 0.2 — 4.5<br />
Corporate and eliminations — (133.3) (133.3) (110.4) 4.7 4.9 215.1<br />
Total $2,642.7 $ — $2,642.7 $ 33.9 $57.4 $43.4 $1,583.0<br />
Performance Products and Solutions also includes our former<br />
equity investment in GPA (owned 50%) through its disposition date<br />
of October 13, <strong>2009</strong>. For <strong>2009</strong>, 2008 and 2007, Specialty Color,<br />
Total<br />
Assets<br />
Additives and Inks includes earnings of BayOne equity affiliate<br />
(owned 50% by Specialty Inks and Polymer Systems).<br />
Earnings of equity affiliates are included in the related segment’s<br />
operating income and the investment in equity affiliates is<br />
POLYONE CORPORATION<br />
57
included in the related segment’s assets. Amounts related to equity<br />
affiliates included in the segment information, excluding amounts<br />
related to losses on divestitures of equity investments, are as<br />
follows:<br />
(In millions) <strong>2009</strong> 2008 2007<br />
Earnings of equity affiliates:<br />
Specialty Color, Additives and Inks $ 2.2 $ 3.5 $ 3.3<br />
Performance Products and Solutions 0.5 (0.1) 0.6<br />
Resin and Intermediates 29.7 32.4 40.8<br />
Subtotal 32.4 35.8 44.7<br />
Minority interest — 0.1 (0.2)<br />
Corporate and eliminations 2.8 (4.7) (16.8)<br />
Total $35.2 $31.2 $ 27.7<br />
Investment in equity affiliates:<br />
Specialty Color, Additives and Inks $ 2.3 $ 2.4<br />
Performance Products and Solutions — 9.8<br />
Resin and Intermediates 2.5 7.2<br />
Corporate and eliminations 1.0 1.1<br />
Total $ 5.8 $20.5<br />
Our sales are primarily to customers in the United States, Europe, Canada and Asia, and the majority of our assets are located in these<br />
same geographic areas. Following is a summary of sales and long-lived assets based on the geographic areas where the sales originated and<br />
where the assets are located:<br />
(In millions) <strong>2009</strong> 2008 2007<br />
Net sales:<br />
United States $1,308.3 $1,718.4 $1,670.9<br />
Europe 393.7 528.8 513.7<br />
Canada 192.1 295.8 291.7<br />
Asia 160.7 182.4 152.5<br />
Other 5.9 13.3 13.9<br />
Long-lived assets:<br />
United States $ 252.8 $ 280.7 $ 289.8<br />
Europe 97.4 101.1 113.8<br />
Canada 5.0 12.9 17.3<br />
Asia 34.8 35.2 25.8<br />
Other 2.4 2.1 3.0<br />
Note 17 — WEIGHTED-AVERAGE SHARES USED IN COMPUTING EARNINGS PER SHARE<br />
(In millions) <strong>2009</strong> 2008 2007<br />
Weighted-average shares — basic:<br />
Weighted-average shares outstanding 92.4 92.9 93.0<br />
Less unearned portion of restricted stock awards included in outstanding shares — 0.2 0.2<br />
92.4 92.7 92.8<br />
Weighted-average shares — diluted:<br />
Weighted-average shares outstanding — basic 92.4 92.7 92.8<br />
Plus dilutive impact of stock options and stock awards 1.0 — 0.3<br />
93.4 92.7 93.1<br />
POLYONE CORPORATION<br />
Basic earnings per common share is computed as net income<br />
available to common shareholders divided by the weighted average<br />
basic shares outstanding. Diluted earnings per common share is<br />
computed as net income available to common shareholders divided<br />
by the weighted average diluted shares outstanding. Pursuant to<br />
FASB ASC Topic 260, Earnings Per Share, when a loss is reported<br />
the denominator of diluted earnings per share cannot be adjusted<br />
for the dilutive impact of stock options and awards because doing<br />
so will result in anti-dilution. Therefore, for the year ended December<br />
31, 2008, basic weighted-average shares outstanding are used<br />
in calculating diluted earnings per share.<br />
58
Outstanding stock options with exercise prices greater than the<br />
average price of the common shares are anti-dilutive and are not<br />
included in the computation of diluted earnings per share. The<br />
number of anti-dilutive options and awards was 5.3 million, 4.1 million<br />
and 6.4 million at December 31, <strong>2009</strong>, 2008 and 2007,<br />
respectively.<br />
Note 18 — FINANCIAL INSTRUMENTS<br />
The estimated fair values of financial instruments were principally<br />
based on market prices where such prices were available and,<br />
where unavailable, fair values were estimated based on market<br />
prices of similar instruments. The fair value of short-term foreign<br />
exchange contracts is based on exchange rates at December 31,<br />
<strong>2009</strong>.<br />
The following table summarizes the contractual amounts of our<br />
foreign exchange contracts as of December 31, <strong>2009</strong> and 2008.<br />
Foreign currency amounts are translated at exchange rates as of<br />
December 31, <strong>2009</strong> and 2008, respectively. The “Buy” amounts<br />
represent the U.S. dollar equivalent of commitments to purchase<br />
currencies, and the “Sell” amounts represent the U.S. dollar equivalent<br />
of commitments to sell currencies.<br />
December 31, <strong>2009</strong> December 31, 2008<br />
Currency (In millions) Buy Sell Buy Sell<br />
U.S. dollar $59.9 $ — $ 4.6 $29.7<br />
Euro — 55.5 8.9 4.5<br />
British pound — 4.4 — —<br />
Canadian dollar — — 20.4 —<br />
The carrying amounts and fair values of our financial instruments as of December 31, <strong>2009</strong> and 2008 are as follows:<br />
<strong>2009</strong> 2008<br />
(In millions)<br />
Carrying<br />
Amount<br />
Fair<br />
Value<br />
Carrying<br />
Amount<br />
Cash and cash equivalents $222.7 $222.7 $ 44.3 $ 44.3<br />
Long-term debt<br />
Credit facility borrowings 40.0 40.0 40.0 40.0<br />
7.500% debentures 50.0 45.8 50.0 30.0<br />
8.875% senior notes 279.5 285.1 279.2 139.6<br />
Medium-term notes 39.6 38.4 58.9 35.4<br />
Foreign exchange contracts 0.5 0.5 (0.3) (0.3)<br />
Fair<br />
Value<br />
Note 19 — FAIR VALUE<br />
The fair values of financial assets and liabilities are measured on a<br />
recurring or non-recurring basis. Financial assets and liabilities<br />
measured on a recurring basis are those that are adjusted to fair<br />
value each time a financial statement is prepared. Financial assets<br />
and liabilities measured on a non-recurring basis are those that are<br />
adjusted to fair value when a significant event occurs. In determining<br />
fair value of financial assets and liabilities, we use various<br />
valuation techniques. The availability of inputs observable in the<br />
market varies from instrument to instrument and depends on a<br />
variety of factors including the type of instrument, whether the<br />
instrument is actively traded, and other characteristics particular<br />
to the transaction. For many financial instruments, pricing inputs<br />
are readily observable in the market, the valuation methodology<br />
used is widely accepted by market participants, and the valuation<br />
does not require significant management discretion. For other<br />
financial instruments, pricing inputs are less observable in the<br />
market and may require management judgment.<br />
We assess the inputs used to measure fair value using a threetier<br />
hierarchy. The hierarchy indicates the extent to which inputs<br />
used in measuring fair value are observable in the market. Level 1<br />
inputs include quoted prices for identical instruments and are the<br />
most observable. Level 2 inputs include quoted prices for similar<br />
assets and observable inputs such as interest rates, foreign currency<br />
exchange rates, commodity rates and yield curves. Level 3<br />
inputs are not observable in the market and include management’s<br />
own judgments about the assumptions market participants would<br />
use in pricing the asset or liability. The use of observable and<br />
unobservable inputs is reflected in the discussion below.<br />
In accordance with the provisions of FASB ASC Topic 350,<br />
Intangibles — Goodwill and Other, we assess the fair value of<br />
goodwill on a non-recurring basis. Accordingly, goodwill with a preliminary<br />
carrying amount of $334.0 million as of December 31,<br />
2008 was adjusted to its implied fair value of $159.0 million,<br />
resulting in an impairment charge of $175.0 million, of which<br />
$170.0 million was included in earnings for the three-month period<br />
ended December 31, 2008 and $5.0 million was included in earnings<br />
for the three-month period ended March 31, <strong>2009</strong>. The implied<br />
fair value of goodwill is determined based on significant unobservable<br />
inputs as summarized below. Accordingly, these inputs fall<br />
within Level 3 of the fair value hierarchy.<br />
We use a combination of two valuation methods, a market<br />
approach and an income approach, to estimate the fair value of our<br />
reporting units. Absent an indication of fair value from a potential<br />
POLYONE CORPORATION<br />
59
POLYONE CORPORATION<br />
buyer or similar specific transactions, we believe that the use of<br />
these two methods provides reasonable estimates of the reporting<br />
units’ fair value and that these estimates are consistent with how<br />
we believe a market participant would view the fair value of each of<br />
the reporting units. Estimates of fair value using these methods<br />
reflects a number of factors, including projected future operating<br />
results and business plans, economic projections, anticipated<br />
future cash flows, comparable marketplace data within a consistent<br />
industry grouping and the cost of capital. There are inherent uncertainties,<br />
however, related to these factors and to management’s<br />
judgment in applying them to this analysis. Nonetheless, management<br />
believes that the combination of these two methods provides<br />
a reasonable approach to estimate the fair value of our reporting<br />
units.<br />
The market approach is used to estimate fair value by applying<br />
sales and earnings multiples (derived from comparable publiclytraded<br />
companies with similar investment characteristics of the<br />
reporting unit) to the reporting unit’s operating performance<br />
adjusted for non-recurring items. Management believes that this<br />
approach is appropriate as it provides an estimate of fair value<br />
reflecting multiples associated with entities with operations and<br />
economic characteristics comparable to our reporting units. The key<br />
estimates and assumptions that are used to determine fair value<br />
under this approach include trailing twelve-month earnings before<br />
interest, taxes, depreciation and amortization (EBITDA) and projected<br />
EBITDA based on consensus estimates as reported by a<br />
third-party resource, which would approximate a market participant’s<br />
view, to determine the market multiples to calculate the<br />
enterprise value.<br />
The income approach is based on projected future debt-free<br />
cash flows discounted to present value using factors that consider<br />
the timing and risk of the future cash flows. Management believes<br />
that this approach is appropriate because it provides a fair value<br />
estimate based upon the reporting unit’s expected long-term operating<br />
and cash flow performance. This approach also mitigates the<br />
impact of cyclical downturns that occur in the reporting unit’s<br />
industry. The income approach is based on a reporting unit’s projection<br />
of operating results and cash flows discounted to present<br />
value using a weighted-average cost of capital. The projection is<br />
based upon management’s best estimates of projected economic<br />
and market conditions over the related period including growth<br />
rates, estimates of future expected changes in operating margins<br />
and cash expenditures. Other significant estimates and assumptions<br />
include terminal value growth rates, terminal value margin<br />
rates, future capital expenditures and changes in future working<br />
capital requirements based on management projections.<br />
Indefinite-lived intangible assets consist of a tradename,<br />
acquired as part of the January 2008 acquisition of GLS, which<br />
is tested annually for impairment. The fair value of the trade name is<br />
calculated using a “relief from royalty payments” methodology. This<br />
approach involves two steps (1) estimating reasonable royalty rates<br />
for the tradename and (2) applying this royalty rate to a net sales<br />
stream and discounting the resulting cash flows to determine fair<br />
value. This fair value is then compared with the carrying value of the<br />
tradename. Other finite-lived intangible assets, which consist primarily<br />
of non-contractual customer relationships, sales contracts,<br />
patents and technology, are amortized over their estimated useful<br />
lives. The remaining lives range up to 15 years.<br />
In accordance with the provisions of FASB ASC Topic 360,<br />
Property, Plant, and Equipment, we assess the fair value of our longlived<br />
assets on a non-recurring basis. In <strong>2009</strong>, we recorded impairment<br />
charges totaling approximately $8.6 million for certain of the<br />
facilities that were closed as a result of the previously mentioned<br />
plant phaseout activities. Our estimates of fair value are based<br />
primarily on estimates from broker opinions of value and appraisals<br />
of the assets. As these fair value measurements are based on<br />
significant unobservable inputs, such as recent sales of comparable<br />
properties, they are classified within Level 3 of the fair value<br />
hierarchy.<br />
Note 20 — BUSINESS COMBINATIONS<br />
Acquisition<br />
On December 23, <strong>2009</strong> we acquired substantially all of the<br />
assets of NEU, a specialty healthcare engineered materials provider,<br />
for a cash purchase price of $11.5 million paid at close and an<br />
earnout of up to $0.5 million payable in 2011, resulting in goodwill<br />
of $4.5 million and $5.9 million of identifiable intangible assets.<br />
NEU had sales of $7.7 million for the year ended December 31,<br />
2008. Our purchase price allocation is preliminary and may require<br />
subsequent adjustment.<br />
On January 2, 2008, we acquired 100% of the outstanding<br />
capital stock of GLS, a global provider of specialty TPE compounds<br />
for consumer, packaging and medical applications, for a cash purchase<br />
price of $148.9 million including acquisition costs, net of<br />
cash received. GLS, with sales of $128.8 million for the year ended<br />
December 31, 2007, has been fully integrated into the Specialty<br />
Engineered Materials segment. This acquisition complements our<br />
global engineered materials business portfolio and accelerates our<br />
shift to specialization. The combination of GLS’s specialized TPE<br />
offerings, compounding expertise and brand, along with our extensive<br />
global infrastructure and commercial presence offers customers:<br />
enhanced technologies; a broader range of products, services<br />
and solutions; and expanded access to specialized, high-growth<br />
markets around the globe. The combinations of these factors are<br />
the drivers behind the excess of the purchase price over the fair<br />
value of the tangible assets and liabilities acquired.<br />
Note 21 — SHAREHOLDERS’ EQUITY<br />
In August 2008, our Board of Directors approved a stock repurchase<br />
program authorizing us, depending upon market conditions<br />
and other factors, to repurchase up to 10.0 million shares of our<br />
common stock, in the open market or in privately negotiated<br />
transactions.<br />
During <strong>2009</strong>, no shares were repurchased under this program.<br />
During 2008, we repurchased 1.25 million shares of common stock<br />
under this program at an average price of $7.12 per common share<br />
60
for approximately $8.9 million. There are 8.75 million shares available<br />
for repurchase under the program at December 31, <strong>2009</strong>.<br />
Note 22 — SUBSEQUENT EVENTS<br />
financial statements. There were no subsequent events requiring<br />
recognition in these financial statements for the year ended December<br />
31, <strong>2009</strong>.<br />
Events subsequent to December 31, <strong>2009</strong> have been evaluated<br />
through February 18, 2010, or the date of issuance of these<br />
Note 23 — SELECTED QUARTERLY FINANCIAL DATA (UNAUDITED)<br />
<strong>2009</strong> Quarters 2008 Quarters<br />
(In millions, except per share data) Fourth Third Second First Fourth (2) Third Second First<br />
Sales $552.5 $548.3 $496.5 $463.4 $ 541.8 $735.1 $748.1 $713.7<br />
Gross Margin 87.7 107.3 86.3 59.2 58.0 65.2 88.5 84.9<br />
Operating costs and expenses, net 526.9 492.1 477.2 466.1 716.5 733.8 724.1 693.6<br />
Operating income (loss) 25.6 56.2 19.3 (2.7) (174.7) 1.3 24.0 20.1<br />
Net income (loss) 24.0 49.6 3.5 (9.3) (282.6) (5.6) 8.8 6.5<br />
Earnings (loss) per common share:<br />
Basic earnings (loss) (1) $ 0.26 $ 0.54 $ 0.04 $ (0.10) $ (3.07) $ (0.06) $ 0.09 $ 0.07<br />
Diluted earnings (loss) (1) $ 0.25 $ 0.53 $ 0.04 $ (0.10) $ (3.07) $ (0.06) $ 0.09 $ 0.07<br />
(1)<br />
(2)<br />
Per share amounts for the quarter and the full year have been computed separately. The sum of the quarterly amounts may not equal the annual<br />
amounts presented because of differences in the average shares outstanding during each period.<br />
Included in operating expense for the fourth quarter 2008 results are charges of $26.6 million related to employee separation and plant phaseout<br />
and $170.0 million related to goodwill impairment. Included in net loss for the fourth quarter are charges of $105.9 million to record deferred a<br />
deferred tax valuation allowance.<br />
POLYONE CORPORATION<br />
61
ITEM 9.<br />
None.<br />
ITEM 9A.<br />
CHANGES IN AND DISAGREEMENTS WITH ACCOUN-<br />
TANTS ON ACCOUNTING AND FINANCIAL<br />
DISCLOSURE<br />
CONTROLS AND PROCEDURES<br />
Changes in internal control over financial reporting<br />
There were no changes in the Company’s internal control over<br />
financial reporting that occurred during the quarter ended December<br />
31, <strong>2009</strong> that have materially affected, or are reasonably likely<br />
to materially affect, the Company’s internal control over financial<br />
reporting.<br />
Disclosure controls and procedures<br />
<strong>PolyOne</strong>’s management, with the participation of the Chief Executive<br />
Officer and the Chief Financial Officer, has evaluated the<br />
effectiveness of the design and operation of <strong>PolyOne</strong>’s disclosure<br />
controls and procedures (as defined in Rules 13a-15(e) and<br />
15d-15(e) under the Securities Exchange Act of 1934) as of<br />
December 31, <strong>2009</strong>. Based on this evaluation, the Chief Executive<br />
Officer and the Chief Financial Officer have concluded that such<br />
disclosure controls and procedures are effective as of December<br />
31, <strong>2009</strong>.<br />
ITEM 9B.<br />
None.<br />
PART III<br />
ITEM 10.<br />
OTHER INFORMATION<br />
DIRECTORS, EXECUTIVE OFFICERS AND CORPO-<br />
RATE GOVERNANCE<br />
POLYONE CORPORATION<br />
Management’s annual report on internal control over financial<br />
reporting<br />
The following report is provided by management in respect of<br />
<strong>PolyOne</strong>’s internal control over financial reporting (as defined in<br />
Rules 13a-15(f) and 15d-15(f) under the Securities Exchange Act of<br />
1934):<br />
1. <strong>PolyOne</strong>’s management is responsible for establishing and<br />
maintaining adequate internal control over financial reporting.<br />
2. <strong>PolyOne</strong>’s management has used the Committee of Sponsoring<br />
Organizations of the Treadway Commission (COSO) framework to<br />
evaluate the effectiveness of internal control over financial<br />
reporting. Management believes that the COSO framework is<br />
a suitable framework for its evaluation of financial reporting<br />
because it is free from bias, permits reasonably consistent<br />
qualitative and quantitative measurements of <strong>PolyOne</strong>’s internal<br />
control over financial reporting, is sufficiently complete so that<br />
those relevant factors that would alter a conclusion about the<br />
effectiveness of <strong>PolyOne</strong>’s internal control over financial reporting<br />
are not omitted and is relevant to an evaluation of internal<br />
control over financial reporting.<br />
3. Management has assessed the effectiveness of <strong>PolyOne</strong>’s<br />
internal control over financial reporting as of December 31,<br />
<strong>2009</strong> and has concluded that such internal control over financial<br />
reporting is effective. There were no material weaknesses in<br />
internal control over financial reporting identified by<br />
management.<br />
4. Ernst & Young LLP, who audited the consolidated financial statements<br />
of <strong>PolyOne</strong> for the year ended December 31, <strong>2009</strong>, also<br />
issued an attestation report on <strong>PolyOne</strong>’s internal control over<br />
financial reporting under Auditing Standard No. 5 of the Public<br />
Company Accounting Oversight Board. This attestation report is<br />
set forth on page 34 of this <strong>Annual</strong> <strong>Report</strong> on Form 10-K and is<br />
incorporated by reference into this Item 9A.<br />
The information regarding <strong>PolyOne</strong>’s directors, including the identification<br />
of the audit committee and the audit committee financial<br />
expert, is incorporated by reference to the information contained in<br />
<strong>PolyOne</strong>’s Proxy Statement with respect to the 2010 <strong>Annual</strong> Meeting<br />
of Shareholders (2010 Proxy Statement). Information concerning<br />
executive officers is contained in Part I of this <strong>Annual</strong> <strong>Report</strong> on<br />
Form 10-K under the heading “Executive Officers of the Registrant.”<br />
The information regarding Section 16(a) beneficial ownership<br />
reporting compliance is incorporated by reference to the material<br />
under the heading “Section 16(a) Beneficial Ownership <strong>Report</strong>ing<br />
Compliance” in the 2010 Proxy Statement.<br />
The information regarding any changes in procedures by which<br />
shareholders may recommend nominees to <strong>PolyOne</strong>’s Board of<br />
Directors is incorporated by reference to the information contained<br />
in the 2010 Proxy Statement.<br />
<strong>PolyOne</strong> has adopted a code of ethics that applies to its<br />
principal executive officer, principal financial officer and principal<br />
accounting officer. <strong>PolyOne</strong>’s code of ethics is posted under the<br />
Investor Relations tab of its website at www.polyone.com. <strong>PolyOne</strong><br />
will post any amendments to, or waivers of, its code of ethics that<br />
apply to its principal executive officer, principal financial officer and<br />
principal accounting officer on its website.<br />
ITEM 11.<br />
EXECUTIVE COMPENSATION<br />
The information regarding executive officer and director compensation<br />
is incorporated by reference to the information contained in<br />
the 2010 Proxy Statement.<br />
The information regarding compensation committee interlocks<br />
and insider participation and the compensation committee report is<br />
incorporated by reference to the information contained in the 2010<br />
Proxy Statement.<br />
62
ITEM 12.<br />
SECURITY OWNERSHIP OF CERTAIN BENEFICIAL<br />
OWNERS AND MANAGEMENT AND RELATED SHARE-<br />
HOLDER MATTERS<br />
The information about our equity compensation plans is incorporated<br />
by reference to the information contained in the 2010 Proxy<br />
Statement.<br />
The information regarding security ownership of certain beneficial<br />
owners and management is incorporated by reference to the<br />
information contained in the 2010 Proxy Statement.<br />
ITEM 13.<br />
CERTAIN RELATIONSHIPS AND RELATED TRANSAC-<br />
TIONS, AND DIRECTOR INDEPENDENCE<br />
The information regarding certain relationships and related transactions<br />
and director independence is incorporated by reference to<br />
the information contained in the 2010 Proxy Statement.<br />
(a)(2) Financial Statement Schedules:<br />
The following financial statements of subsidiaries not consolidated<br />
and 50% or less owned entities, as required by Item 15(c) are<br />
incorporated by reference to Exhibits 99.1 and 99.2 to this <strong>Annual</strong><br />
<strong>Report</strong> on Form 10-K:<br />
Consolidated financial statements of Oxy Vinyls, LP for the sixmonth<br />
period ended June 30, 2007.<br />
Consolidated financial statements of SunBelt Chlor-Alkali Partnership<br />
as of December 31, <strong>2009</strong> and for each of the years<br />
in the three year period then ended.<br />
All other schedules for which provision is made in the applicable<br />
accounting regulation of the SEC are not required under the<br />
related instructions or are inapplicable and, therefore, omitted.<br />
ITEM 14.<br />
PRINCIPAL ACCOUNTANT FEES AND SERVICES<br />
Information regarding fees paid to and services provided by Poly-<br />
One’s independent registered public accounting firm during the<br />
fiscal years ended December 31, <strong>2009</strong> and 2008 and the preapproval<br />
policies and procedures of the audit committee is incorporated<br />
by reference to the information contained in the 2010 Proxy<br />
Statement.<br />
PART IV<br />
ITEM 15. EXHIBITS AND FINANCIAL STATEMENT SCHEDULES<br />
(a)(1) Financial Statements:<br />
The following consolidated financial statements of <strong>PolyOne</strong><br />
Corporation are included in Item 8:<br />
Consolidated Statements of Operations for the years ended<br />
December 31, <strong>2009</strong>, 2008 and 2007<br />
Consolidated Balance Sheets at December 31, <strong>2009</strong> and<br />
2008<br />
Consolidated Statements of Cash Flows for the years ended<br />
December 31, <strong>2009</strong>, 2008 and 2007<br />
Consolidated Statements of Shareholders’ Equity for the years<br />
ended December 31, <strong>2009</strong>, 2008 and 2007<br />
Notes to Consolidated Financial Statements<br />
POLYONE CORPORATION<br />
63
(a)(3) Exhibits.<br />
POLYONE CORPORATION<br />
Exhibit No.<br />
Exhibit Description<br />
3.1 Articles of Incorporation (incorporated by reference to Exhibit 3.1 to the Company’s <strong>Annual</strong> <strong>Report</strong> on Form 10-K for the fiscal year ended<br />
December 31, 2000, SEC File No. 1-16091)<br />
3.2 Amendment to the Second Article of the Articles of Incorporation, as filed with the Ohio Secretary of State, November 25, 2003<br />
(incorporated by reference to Exhibit 3.1a to the Company’s <strong>Annual</strong> <strong>Report</strong> on Form 10-K for the fiscal year ended December 31, 2003,<br />
SEC File No. 1-16091)<br />
3.3 Regulations (incorporated by reference to Exhibit 3.1 to the Company’s Current <strong>Report</strong> on Form 8-K filed on July 17, <strong>2009</strong>, SEC File<br />
No. 1-16091)<br />
4.1 Indenture, dated as of December 1, 1995, between the Company and NBD Bank, as trustee (incorporated by reference to Exhibit 4.3 to The<br />
Geon Company’s <strong>Annual</strong> <strong>Report</strong> on Form 10-K for the fiscal year ended December 31, 1996, SEC File No. 1-11804)<br />
4.2 Form of Indenture between the Company and NBD Bank, as trustee, governing the Company’s Medium Term Notes (incorporated by<br />
reference to Exhibit 4.1 to M.A. Hanna Company’s Registration Statement on Form S-3, Registration Statement No. 333-05763, filed on<br />
June 12, 1996)<br />
4.3 Indenture, dated as of April 23, 2002, between the Company and The Bank of New York, as trustee, governing the Company’s<br />
8.875% Senior Notes due May 15, 2012 (incorporated by reference to Exhibit 4.1 to the Company’s Registration Statement on<br />
Form S-4, Registration Statement No. 333-87472, filed on May 2, 2002)<br />
4.4 Supplemental Indenture, dated as of April 10, 2008, between <strong>PolyOne</strong> Corporation and The Bank of New York Trust Company, N.A., as<br />
successor trustee (incorporated by reference to Exhibit 4.2 to the Company’s Current <strong>Report</strong> on Form 8-K filed April 11, 2008, SEC File<br />
No. 1-16091)<br />
10.1+ Long-Term Incentive Plan, as amended and restated as of March 1, 2000 (incorporated by reference to Exhibit A to M.A. Hanna Company’s<br />
Definitive Proxy Statement filed on March 24, 2000, SEC File No. 1-05222)<br />
10.2+ Form of Award Agreement for Stock Appreciation Rights (incorporated by reference to Exhibit 10.2 to the Company’s Current <strong>Report</strong> on<br />
Form 8-K filed on January 11, 2005, SEC File No. 1-16091)<br />
10.3+ 1995 Incentive Stock Plan, as amended and restated through August 31, 2000 (incorporated by reference to Exhibit 10.3 to the<br />
Company’s <strong>Annual</strong> <strong>Report</strong> on Form 10-K for the fiscal year ended December 31, 2000, SEC File No. 1-16091)<br />
10.4+ 1999 Incentive Stock Plan, as amended and restated through August 31, 2000 (incorporated by reference to Exhibit 10.5 to the<br />
Company’s <strong>Annual</strong> <strong>Report</strong> on Form 10-K for the fiscal year ended December 31, 2000, SEC File No. 1-16091)<br />
10.5+ 2000 Stock Incentive Plan (incorporated by reference to Annex D to Amendment No. 3 to The Geon Company’s Registration Statement on<br />
Form S-4, Registration Statement No. 333-37344, filed on July 28, 2000)<br />
10.6+ Amended and Restated Benefit Restoration Plan (Section 401(a)(17)) (incorporated by reference to Exhibit 10.8 of the Company’s <strong>Annual</strong><br />
<strong>Report</strong> on Form 10-K for the fiscal year ended December 31, 2007, SEC File No. 1-16091)<br />
10.7+ Strategic Improvement Incentive Plan (incorporated by reference to Exhibit 10.9b to the Company’s <strong>Annual</strong> <strong>Report</strong> on Form 10-K for the<br />
fiscal year ended December 31, 2001, SEC File No. 1-16091)<br />
10.8+ Senior Executive <strong>Annual</strong> Incentive Plan, effective January 1, 2006 (incorporated by reference to Exhibit 10.1 to the Company’s Current<br />
<strong>Report</strong> on Form 8-K filed on May 24, 2005, SEC File No. 1-16091)<br />
10.9+ 2005 Equity and Performance Incentive Plan (amended and restated by the Board as of July 21, 2005) (incorporated by reference to<br />
Exhibit 10.4 to the Company’s Quarterly <strong>Report</strong> on Form 10-Q for the quarter ended June 30, 2005, SEC File No. 1-16091)<br />
10.10+ Amended and Restated Deferred Compensation Plan for Non-Employee Directors (incorporated by reference to Exhibit 10.4 to the<br />
Company’s Quarterly <strong>Report</strong> on Form 10-Q for the quarter ended March 31, 2008, SEC File No. 1-16091)<br />
10.11+ Form of Management Continuity Agreement (incorporated by reference to Exhibit 10.13 to the Company’s <strong>Annual</strong> <strong>Report</strong> on Form 10-K for<br />
the fiscal year ended December 31, 2007, SEC File No. 1-16091)<br />
10.12+ Schedule of Executives with Management Continuity Agreements<br />
10.13+ Amended and Restated <strong>PolyOne</strong> Supplemental Retirement Benefit Plan (incorporated by reference to Exhibit 10.15 to the Company’s<br />
<strong>Annual</strong> <strong>Report</strong> on Form 10-K for the fiscal year ended December 31, 2007, SEC File No. 1-16091)<br />
10.14+ Amended and Restated Letter Agreement, dated as of July 16, 2008, between the Company and Stephen D. Newlin, originally effective as<br />
of February 13, 2006 (incorporated by reference to Exhibit 10.1 to the Company’s Quarterly <strong>Report</strong> on Form 10-Q for the quarter ended<br />
September 30, 2008, SEC File No. 1-16091)<br />
10.15+ Form of Director and Officer Indemnification Agreement (incorporated by reference to Exhibit 10.1 to the Company’s Current <strong>Report</strong> on<br />
Form 8-K filed on July 5, 2006, SEC File No. 1-16091)<br />
10.16+ Amended and Restated <strong>PolyOne</strong> Corporation Executive Severance Plan (incorporated by reference to Exhibit 10.16 to the Company’s<br />
<strong>Annual</strong> <strong>Report</strong> on Form 10-K for the fiscal year ended December 31, 2008, SEC File No. 1-16091)<br />
10.17 Guarantee and Agreement, dated as of June 6, 2006, between the Company, as guarantor, and the beneficiary banks party thereto<br />
(incorporated by reference to Exhibit 10.1 to the Company’s Current <strong>Report</strong> on Form 8-K filed on June 8, 2006, SEC File No. 1-16091)<br />
64
Exhibit No.<br />
Exhibit Description<br />
10.18 Second Amended and Restated Security Agreement, dated as of June 6, 2006, between the Company, as grantor, and U.S. Bank<br />
Trust National Association, as collateral trustee (incorporated by reference to Exhibit 10.2 to the Company’s Current <strong>Report</strong> on Form 8-K<br />
filed on June 8, 2006, SEC File No. 1-16091)<br />
10.19 Amended and Restated Collateral Trust Agreement, dated as of June 6, 2006, between the Company, as grantor, and U.S. Bank<br />
Trust National Association, as collateral trustee (incorporated by reference to Exhibit 10.3 to the Company’s Current <strong>Report</strong> on Form 8-K<br />
filed on June 8, 2006, SEC File No. 1-16091)<br />
10.20 Amended and Restated Intercreditor Agreement, dated as of June 6, 2006, between the Company, as grantor; Citicorp USA, Inc., as<br />
receivables and bank agent; U.S. Bank Trust National Association, as collateral trustee; <strong>PolyOne</strong> Funding Corporation (incorporated by<br />
reference to Exhibit 10.4 to the Company’s Current <strong>Report</strong> on Form 8-K filed on June 8, 2006, SEC File No. 1-16091)<br />
10.21 Amended and Restated Instrument Guaranty, dated as of December 19, 1996 (incorporated by reference to Exhibit 10.12 to The Geon<br />
Company’s <strong>Annual</strong> <strong>Report</strong> on Form 10-K for the fiscal year ended December 31, 1996, SEC File No. 1-11804)<br />
10.22 Amended and Restated Plant Services Agreement, between the Company and the B.F. Goodrich Company (incorporated by reference to<br />
Exhibit 10.13 to The Geon Company’s <strong>Annual</strong> <strong>Report</strong> on Form 10-K for the fiscal year ended December 31, 1996, SEC File No. 1-11804)<br />
10.23 Assumption of Liabilities and Indemnification Agreement, dated March 1, 1993, amended and restated by Amended and Restated<br />
Assumption of Liabilities and Indemnification Agreement, dated April 27, 1993 (incorporated by reference to Exhibit 10.14 to The Geon<br />
Company’s <strong>Annual</strong> <strong>Report</strong> on Form 10-K for the fiscal year ended December 31, 1996, SEC File No. 1-11804)<br />
10.24 Partnership Agreement, by and between 1997 Chloralkali Venture, Inc. and Olin Sunbelt, Inc. (incorporated by reference to Exhibit 10(A) to<br />
The Geon Company’s Quarterly <strong>Report</strong> on Form 10-Q for the quarter ended September 30, 1996, SEC File No. 1-11804)<br />
10.25 Amendment to Partnership Agreement between Olin Sunbelt, Inc. and 1997 Chloralkali Venture, Inc., addition of §5.03 (incorporated by<br />
reference to Exhibit 10.16b to The Geon Company’s <strong>Annual</strong> <strong>Report</strong> on Form 10-K for the fiscal year ended December 31, 1997, SEC File<br />
No. 1-11804)<br />
10.26 Amendment to Partnership Agreement between Olin Sunbelt, Inc. and 1997 Chloralkali Venture, Inc., addition of §1.12 (incorporated by<br />
reference to Exhibit 10.16c to The Geon Company’s <strong>Annual</strong> <strong>Report</strong> on Form 10-K for the fiscal year ended December 31, 1997, SEC File<br />
No. 1-11804)<br />
10.27 Chlorine Sales Agreement, between Sunbelt Chlor Alkali Partnership and OxyVinyls, LP (incorporated by reference to Exhibit 10(B) to The<br />
Geon Company’s Quarterly <strong>Report</strong> on Form 10-Q for the quarter ended September 30, 1996, SEC File No. 1-11804)<br />
10.28 Unconditional and Continuing Guaranty, between the Company and Olin Corporation and Sunbelt Chlor Alkali Partnership (incorporated by<br />
reference to Exhibit 10(C) to The Geon Company’s Quarterly <strong>Report</strong> on Form 10-Q for the quarter ended September 30, 1996, SEC File<br />
No. 1-11804)<br />
10.29 Guarantee by the Company in Favor of Sunbelt Chlor Alkali Partnership of the Guaranteed Secure Senior Notes due 2017, dated<br />
December 22, 1997 (incorporated by reference to Exhibit 10.20 to The Geon Company’s <strong>Annual</strong> <strong>Report</strong> on Form 10-K for the fiscal year<br />
ended December 31, 1997, SEC File No. 1-11804)<br />
10.30 Asset Contribution Agreement — PVC Partnership (Geon) (incorporated by reference to Exhibit 10.3 to The Geon Company’s Current<br />
<strong>Report</strong> on Form 8-K filed on May 13, 1999, SEC File No. 1-11804)<br />
10.31 Stock Purchase Agreement among O’Sullivan Films Holding Corporation, O’Sullivan Management, LLC, and Matrix Films, LLC, dated as of<br />
February 15, 2006 (incorporated by reference to Exhibit 10.25 to the Company’s <strong>Annual</strong> <strong>Report</strong> on Form 10-K for the fiscal year ended<br />
December 31, 2005, SEC File No. 1-16091)<br />
10.32+ Form of Award Agreement for Stock-Settled Stock Appreciation Rights (incorporated by reference to Exhibit 10.1 to the Company’s<br />
Quarterly <strong>Report</strong> on Form 10-Q for the quarter ended March 31, 2007, SEC File No. 1-16091)<br />
10.33+ Form of Award Agreement for Performance Units (incorporated by reference to Exhibit 10.2 to the Company’s Quarterly <strong>Report</strong> on<br />
Form 10-Q for the quarter ended March 31, 2007, SEC File No. 1-16091)<br />
10.34 Sale and Agreement, by and among <strong>PolyOne</strong> Corporation, Occidental Chemical Corporation, and their representative affiliates party<br />
thereto, dated as of July 6, 2007 (incorporated by reference to Exhibit 10.1 to the Company’s Quarterly <strong>Report</strong> on Form 10-Q for the quarter<br />
ended June 30, 2007, SEC File No. 1-16091)<br />
10.35 Second Amended and Restated Receivables Purchase Agreement, dated as of June 26, 2007, among <strong>PolyOne</strong> Funding Corporation, as<br />
seller; the Company, as servicer; the banks and other financial institutions party thereto, as purchasers; Citicorp USA, Inc., as agent; and<br />
National City Business Credit, Inc., as syndication agent (incorporated by reference to Exhibit 10.2 to the Company’s Quarterly <strong>Report</strong> on<br />
Form 10-Q for the quarter ended June 30, 2007, SEC File No. 1-16091)<br />
10.36 Second Amended and Restated Receivables Sale Agreement, dated as of June 26, 2007, among the Company, as seller and as servicer,<br />
and <strong>PolyOne</strong> Funding Corporation, as buyer (incorporated by reference to Exhibit 10.3 to the Company’s Quarterly <strong>Report</strong> on Form 10-Q for<br />
the quarter ended June 30, 2007, SEC File No. 1-16091)<br />
10.37 Canadian Receivables Purchase Agreement, dated as of July 13, 2007, among <strong>PolyOne</strong> Funding Canada Corporation, as seller; the<br />
Company, as servicer; the banks and other financial institutions party thereto, as purchasers; Citicorp USA, Inc., as agent; and National<br />
City Business Credit, Inc., as syndication agent (incorporated by reference to Exhibit 10.4 to the Company’s Quarterly <strong>Report</strong> on Form 10-Q<br />
for the quarter ended June 30, 2007, SEC File No. 1-16091)<br />
10.38 Canadian Receivables Sale Agreement, dated as of July 13, 2007, among <strong>PolyOne</strong> Canada Inc., as seller; <strong>PolyOne</strong> Funding Canada<br />
Corporation, as buyer; and the Company, as servicer (incorporated by reference to Exhibit 10.5 to the Company’s Quarterly <strong>Report</strong> on<br />
Form 10-Q for the quarter ended June 30, 2007, SEC File No. 1-16091)<br />
POLYONE CORPORATION<br />
65
Exhibit No.<br />
Exhibit Description<br />
10.39 Credit Agreement, dated January 3, 2008, by and among <strong>PolyOne</strong> Corporation, the lenders party thereto, Citicorp USA, Inc., as<br />
administrative agent and as issuing bank, and The Bank of New York, as paying agent (incorporated by reference to Exhibit 10.1 to<br />
the Company’s Current <strong>Report</strong> on Form 8-K filed on January 3, 2008, SEC File No. 1-16091)<br />
10.40+ <strong>PolyOne</strong> Corporation 2008 Equity and Performance Incentive Plan (incorporated herein by reference to Appendix A to the Registrant’s proxy<br />
statement on Schedule 14A (SEC File No. 1-16091), filed on March 25, 2008).<br />
10.41+ Form of Award Agreement for Restricted Stock Units (incorporated by reference to Exhibit 10.1 to the Company’s Quarterly <strong>Report</strong> on<br />
Form 10-Q for the quarter ended March 31, 2008, SEC File No. 1-16091)<br />
10.42+ Form of Award Agreement for Stock-Settled Stock Appreciation Rights (incorporated by reference to Exhibit 10.2 to the Company’s<br />
Quarterly <strong>Report</strong> on Form 10-Q for the quarter ended March 31, 2008, SEC File No. 1-16091)<br />
10.43+ Form of Award Agreement for Performance Units (incorporated by reference to Exhibit 10.3 to the Company’s Quarterly <strong>Report</strong> on<br />
Form 10-Q for the quarter ended March 31, 2008, SEC File No. 1-16091)<br />
10.44+ First Amendment to The Geon Company Section 401(a)(17) Benefit Restoration Plan (December 31, 2007 Restatement) (incorporated by<br />
reference to Exhibit 10.1 to the Company’s Quarterly <strong>Report</strong> on Form 10-Q for the quarter ended March 31, <strong>2009</strong>, SEC File No. 1-16091)<br />
10.45+ Amendment No. 1 to the <strong>PolyOne</strong> Supplemental Retirement Benefit Plan (As Amended and Restated Effective December 31, 2007)<br />
(incorporated by reference to Exhibit 10.2 to the Company’s Quarterly <strong>Report</strong> on Form 10-Q for the quarter ended March 31, <strong>2009</strong>, SEC File<br />
No. 1-16091)<br />
10.46+ Form of Grant of Performance Shares under the <strong>2009</strong> Long-Term Incentive Plan (incorporated by reference to Exhibit 10.3 to the<br />
Company’s Quarterly <strong>Report</strong> on Form 10-Q for the quarter ended March 31, <strong>2009</strong>, SEC File No. 1-16091)<br />
10.47+ Form of Grant of Stock-Settled Stock Appreciation Rights under the <strong>2009</strong> Long-Term Incentive Plan (incorporated by reference to<br />
Exhibit 10.4 to the Company’s Quarterly <strong>Report</strong> on Form 10-Q for the quarter ended March 31, <strong>2009</strong>, SEC File No. 1-16091)<br />
10.48+ Form of Grant of Performance Units under the <strong>2009</strong> Long-Term Incentive Plan (incorporated by reference to Exhibit 10.5 to the Company’s<br />
Quarterly <strong>Report</strong> on Form 10-Q for the quarter ended March 31, <strong>2009</strong>, SEC File No. 1-16091)<br />
10.49+ Executive Severance Plan, as amended and restated effective February 17, <strong>2009</strong> (incorporated by reference to Exhibit 10.1 to the<br />
Company’s Quarterly <strong>Report</strong> on Form 10-Q for the quarter ended June 30, <strong>2009</strong>, SEC File No. 1-16091)<br />
10.50+ Undetermined Time Employment Contract between <strong>PolyOne</strong> Luxembourg s.a.r.l. and Bernard Baert (incorporated herein by reference to<br />
Exhibit 10.1 to the Company’s Form 8-K, filed with the Commission on September 2, <strong>2009</strong>, SEC File No. 1-106091)<br />
10.51+ Amendment No. 2 to the <strong>PolyOne</strong> Supplemental Retirement Benefit Plan (As Amended and Restated Effective December 31, 2007)<br />
18.1 Letter regarding Change in Accounting Principles (incorporated by reference to Exhibit No. 18.1 to the Company’s Quarterly <strong>Report</strong> on<br />
Form 10-Q for the quarter ended September 30, 2008, SEC File No. 1-16091)<br />
21.1 Subsidiaries of the Company<br />
23.1 Consent of Independent Registered Public Accounting Firm — Ernst & Young LLP<br />
23.2 Consent of Independent Registered Public Accounting Firm — KPMG LLP<br />
23.3 Consent of Independent Registered Public Accounting Firm — Ernst & Young LLP<br />
31.1 Certification of Stephen D. Newlin, Chairman, President and Chief Executive Officer, pursuant to SEC Rules 13a-14(a) and 15d-14(a),<br />
adopted pursuant to Section 302 of the Sarbanes-Oxley Act of 2002<br />
31.2 Certification of Robert M. Patterson, Senior Vice President and Chief Financial Officer, pursuant to SEC Rules 13a-14(a) and 15d-14(a),<br />
adopted pursuant to Section 302 of the Sarbanes-Oxley Act of 2002<br />
32.1 Certification pursuant to 18 U.S.C. § 1350, adopted pursuant to Section 906 of the Sarbanes-Oxley Act of 2002, as signed by Stephen D.<br />
Newlin, Chairman, President and Chief Executive Officer<br />
32.2 Certification pursuant to 18 U.S.C. § 1350, adopted pursuant to Section 906 of the Sarbanes-Oxley Act of 2002, as signed by Robert M.<br />
Patterson, Senior Vice President and Chief Financial Officer<br />
99.1 Audited Financial Statements of Oxy Vinyls, LP<br />
99.2 Audited Financial Statements of SunBelt Chlor Alkali Partnership<br />
+ Indicates management contract or compensatory plan, contract or arrangement in which one or more directors or executive officers of the<br />
Registrant may be participants<br />
POLYONE CORPORATION<br />
66
SIGNATURES<br />
Pursuant to the requirements of Section 13 or 15(d) of the Securities Exchange Act of 1934, the Registrant has duly caused this report to be<br />
signed on its behalf by the undersigned, thereunto duly authorized.<br />
POLYONE CORPORATION<br />
February 18, 2010<br />
By: /s/ ROBERT M. PATTERSON<br />
Robert M. Patterson<br />
Senior Vice President and Chief Financial Officer<br />
(Principal Financial and Accounting Officer)<br />
Pursuant to the requirements of the Securities Exchange Act of 1934, this report has been signed below by the following persons on<br />
behalf of the Registrant and in the capacities indicated and on the dates indicated.<br />
Signature and Title<br />
/s/<br />
STEPHEN D. NEWLIN<br />
Stephen D. Newlin<br />
/s/<br />
ROBERT M. PATTERSON<br />
Robert M. Patterson<br />
Chairman, President, Chief Executive Officer and Director<br />
(Principal Executive Officer)<br />
Senior Vice President and Chief Financial Officer<br />
(Principal Financial and Accounting Officer)<br />
Date February 18, 2010<br />
Date February 18, 2010<br />
/s/<br />
J. DOUGLAS CAMPBELL<br />
J. Douglas Campbell<br />
/s/<br />
CAROL A. CARTWRIGHT<br />
Carol A. Cartwright<br />
/s/<br />
GALE DUFF-BLOOM<br />
Gale Duff-Bloom<br />
/s/<br />
RICHARD H. FEARON<br />
Richard H. Fearon<br />
/s/<br />
GORDON D. HARNETT<br />
Gordon D. Harnett<br />
/s/<br />
RICHARD A. LORRAINE<br />
Richard A. Lorraine<br />
/s/<br />
EDWARD J. MOONEY<br />
Edward J. Mooney<br />
/s/<br />
WILLIAM H. POWELL<br />
William H. Powell<br />
/s/<br />
FARAH M. WALTERS<br />
Farah M. Walters<br />
Director Date February 17, 2010<br />
Director Date February 17, 2010<br />
Director Date February 17, 2010<br />
Director Date February 17, 2010<br />
Director Date February 17, 2010<br />
Director Date February 17, 2010<br />
Director Date February 17, 2010<br />
Director Date February 17, 2010<br />
Director Date February 17, 2010<br />
POLYONE CORPORATION<br />
67
EXHIBIT INDEX<br />
Exhibit No.<br />
Exhibit Description<br />
POLYONE CORPORATION<br />
3.1 Articles of Incorporation (incorporated by reference to Exhibit 3.I to the Company’s <strong>Annual</strong> <strong>Report</strong> on Form 10-K for the fiscal year ended<br />
December 31, 2000, SEC File No. 1-16091)<br />
3.2 Amendment to the Second Article of the Articles of Incorporation, as filed with the Ohio Secretary of State, November 25, 2003<br />
(incorporated by reference to Exhibit 3.1a to the Company’s <strong>Annual</strong> <strong>Report</strong> on Form 10-K for the fiscal year ended December 31, 2003,<br />
SEC File No. 1-16091)<br />
3.3 Regulations (incorporated by reference to Exhibit 3.1 to the Company’s Current <strong>Report</strong> on Form 8-K filed on July 17, <strong>2009</strong>, SEC File<br />
No. 1-16091)<br />
4.1 Indenture, dated as of December 1, 1995, between the Company and NBD Bank, as trustee (incorporated by reference to Exhibit 4.3 to<br />
The Geon Company’s <strong>Annual</strong> <strong>Report</strong> on Form 10-K for the fiscal year ended December 31, 1996, SEC File No. 1-11804)<br />
4.2 Form of Indenture between the Company and NBD Bank, as trustee, governing the Company’s Medium Term Notes (incorporated by<br />
reference to Exhibit 4.1 to M.A. Hanna Company’s Registration Statement on Form S-3, Registration Statement No. 333-05763, filed on<br />
June 12, 1996)<br />
4.3 Indenture, dated as of April 23, 2002, between the Company and The Bank of New York, as trustee, governing the Company’s<br />
8.875% Senior Notes due May 15, 2012 (incorporated by reference to Exhibit 4.1 to the Company’s Registration Statement on Form S-4,<br />
Registration Statement No. 333-87472, filed on May 2, 2002)<br />
4.4 Supplemental Indenture, dated as of April 10, 2008, between <strong>PolyOne</strong> Corporation and The Bank of New York Trust Company, N.A., as<br />
successor trustee (incorporated by reference to Exhibit 4.2 to the Company’s Current <strong>Report</strong> on Form 8-K filed April 11, 2008, SEC File<br />
No. 1-16091)<br />
10.1+ Long-Term Incentive Plan, as amended and restated as of March 1, 2000 (incorporated by reference to Exhibit A to M.A. Hanna<br />
Company’s Definitive Proxy Statement filed on March 24, 2000, SEC File No. 1-05222)<br />
10.2+ Form of Award Agreement for Stock Appreciation Rights (incorporated by reference to Exhibit 10.2 to the Company’s Current <strong>Report</strong> on<br />
Form 8-K filed on January 11, 2005, SEC File No. 1-16091)<br />
10.3+ 1995 Incentive Stock Plan, as amended and restated through August 31, 2000 (incorporated by reference to Exhibit 10.3 to the<br />
Company’s <strong>Annual</strong> <strong>Report</strong> on Form 10-K for the fiscal year ended December 31, 2000, SEC File No. 1-16091)<br />
10.4+ 1999 Incentive Stock Plan, as amended and restated through August 31, 2000 (incorporated by reference to Exhibit 10.5 to the<br />
Company’s <strong>Annual</strong> <strong>Report</strong> on Form 10-K for the fiscal year ended December 31, 2000, SEC File No. 1-16091)<br />
10.5+ 2000 Stock Incentive Plan (incorporated by reference to Annex D to Amendment No. 3 to The Geon Company’s Registration Statement on<br />
Form S-4, Registration Statement No. 333-37344, filed on July 28, 2000)<br />
10.6+ Amended and Restated Benefit Restoration Plan (Section 401(a)(17)) (incorporated by reference to Exhibit 10.8 of the Company’s <strong>Annual</strong><br />
<strong>Report</strong> on Form 10-K for the fiscal year ended December 31, 2007, SEC File No. 1-16091)<br />
10.7+ Strategic Improvement Incentive Plan (incorporated by reference to Exhibit 10.9b to the Company’s <strong>Annual</strong> <strong>Report</strong> on Form 10-K for the<br />
fiscal year ended December 31, 2001, SEC File No. 1-16091)<br />
10.8+ Senior Executive <strong>Annual</strong> Incentive Plan, effective January 1, 2006 (incorporated by reference to Exhibit 10.1 to the Company’s Current<br />
<strong>Report</strong> on Form 8-K filed on May 24, 2005, SEC File No. 1-16091)<br />
10.9+ 2005 Equity and Performance Incentive Plan (amended and restated by the Board as of July 21, 2005) (incorporated by reference to<br />
Exhibit 10.4 to the Company’s Quarterly <strong>Report</strong> on Form 10-Q for the quarter ended June 30, 2005, SEC File No. 1-16091)<br />
10.10+ Amended and Restated Deferred Compensation Plan for Non-Employee Directors (incorporated by reference to Exhibit 10.4 to the<br />
Company’s Quarterly <strong>Report</strong> on Form 10-Q for the quarter ended March 31, 2008, SEC File No. 1-16091)<br />
10.11+ Form of Management Continuity Agreement (incorporated by reference to Exhibit 10.13 to the Company’s <strong>Annual</strong> <strong>Report</strong> on Form 10-K for<br />
the fiscal year ended December 31, 2007, SEC File No. 1-16091)<br />
10.12+ Schedule of Executives with Management Continuity Agreements<br />
10.13+ Amended and Restated <strong>PolyOne</strong> Supplemental Retirement Benefit Plan (incorporated by reference to Exhibit 10.15 to the Company’s<br />
<strong>Annual</strong> <strong>Report</strong> on Form 10-K for the fiscal year ended December 31, 2007, SEC File No. 1-16091)<br />
10.14+ Amended and Restated Letter Agreement, dated as of July 16, 2008, between the Company and Stephen D. Newlin, originally effective as<br />
of February 13, 2006 (incorporated by reference to Exhibit 10.1 to the Company’s Quarterly <strong>Report</strong> on Form 10-Q for the quarter ended<br />
September 30, 2008, SEC File No. 1-16091)<br />
10.15+ Form of Director and Officer Indemnification Agreement (incorporated by reference to Exhibit 10.1 to the Company’s Current <strong>Report</strong> on<br />
Form 8-K filed on July 5, 2006, SEC File No. 1-16091)<br />
10.16+ Amended and Restated <strong>PolyOne</strong> Corporation Executive Severance Plan (incorporated by reference to Exhibit 10.16 to the Company’s<br />
<strong>Annual</strong> <strong>Report</strong> on Form 10-K for the fiscal year ended December 31, 2008, SEC File No. 1-16091)<br />
10.17 Guarantee and Agreement, dated as of June 6, 2006, between the Company, as guarantor, and the beneficiary banks party thereto<br />
(incorporated by reference to Exhibit 10.1 to the Company’s Current <strong>Report</strong> on Form 8-K filed on June 8, 2006, SEC File No. 1-16091)<br />
10.18 Second Amended and Restated Security Agreement, dated as of June 6, 2006, between the Company, as grantor, and U.S. Bank<br />
Trust National Association, as collateral trustee (incorporated by reference to Exhibit 10.2 to the Company’s Current <strong>Report</strong> on Form 8-K<br />
filed on June 8, 2006, SEC File No. 1-16091)<br />
10.19 Amended and Restated Collateral Trust Agreement, dated as of June 6, 2006, between the Company, as grantor, and U.S. Bank<br />
Trust National Association, as collateral trustee (incorporated by reference to Exhibit 10.3 to the Company’s Current <strong>Report</strong> on Form 8-K<br />
filed on June 8, 2006, SEC File No. 1-16091)<br />
10.20 Amended and Restated Intercreditor Agreement, dated as of June 6, 2006, between the Company, as grantor; Citicorp USA, Inc., as<br />
receivables and bank agent; U.S. Bank Trust National Association, as collateral trustee; <strong>PolyOne</strong> Funding Corporation (incorporated by<br />
reference to Exhibit 10.4 to the Company’s Current <strong>Report</strong> on Form 8-K filed on June 8, 2006, SEC File No. 1-16091)
Exhibit No.<br />
Exhibit Description<br />
10.21 Amended and Restated Instrument Guaranty, dated as of December 19, 1996 (incorporated by reference to Exhibit 10.12 to The Geon<br />
Company’s <strong>Annual</strong> <strong>Report</strong> on Form 10-K for the fiscal year ended December 31, 1996, SEC File No. 1-11804)<br />
10.22 Amended and Restated Plant Services Agreement, between the Company and the B.F. Goodrich Company (incorporated by reference to<br />
Exhibit 10.13 to The Geon Company’s <strong>Annual</strong> <strong>Report</strong> on Form 10-K for the fiscal year ended December 31, 1996, SEC File No. 1-11804)<br />
10.23 Assumption of Liabilities and Indemnification Agreement, dated March 1, 1993, amended and restated by Amended and Restated<br />
Assumption of Liabilities and Indemnification Agreement, dated April 27, 1993 (incorporated by reference to Exhibit 10.14 to The Geon<br />
Company’s <strong>Annual</strong> <strong>Report</strong> on Form 10-K for the fiscal year ended December 31, 1996, SEC File No. 1-11804)<br />
10.24 Partnership Agreement, by and between 1997 Chloralkali Venture, Inc. and Olin Sunbelt, Inc. (incorporated by reference to Exhibit 10(A)<br />
to The Geon Company’s Quarterly <strong>Report</strong> on Form 10-Q for the quarter ended September 30, 1996, SEC File No. 1-11804)<br />
10.25 Amendment to Partnership Agreement between Olin Sunbelt, Inc. and 1997 Chloralkali Venture, Inc., addition of §5.03 (incorporated by<br />
reference to Exhibit 10.16b to The Geon Company’s <strong>Annual</strong> <strong>Report</strong> on Form 10-K for the fiscal year ended December 31, 1997, SEC File<br />
No. 1-11804)<br />
10.26 Amendment to Partnership Agreement between Olin Sunbelt, Inc. and 1997 Chloralkali Venture, Inc., addition of §1.12 (incorporated by<br />
reference to Exhibit 10.16c to The Geon Company’s <strong>Annual</strong> <strong>Report</strong> on Form 10-K for the fiscal year ended December 31, 1997, SEC File<br />
No. 1-11804)<br />
10.27 Chlorine Sales Agreement, between Sunbelt Chlor Alkali Partnership and OxyVinyls, LP (incorporated by reference to Exhibit 10(B) to The<br />
Geon Company’s Quarterly <strong>Report</strong> on Form 10-Q for the quarter ended September 30, 1996, SEC File No. 1-11804)<br />
10.28 Unconditional and Continuing Guaranty, between the Company and Olin Corporation and Sunbelt Chlor Alkali Partnership (incorporated by<br />
reference to Exhibit 10(C) to The Geon Company’s Quarterly <strong>Report</strong> on Form 10-Q for the quarter ended September 30, 1996, SEC File<br />
No. 1-11804)<br />
10.29 Guarantee by the Company in Favor of Sunbelt Chlor Alkali Partnership of the Guaranteed Secure Senior Notes due 2017, dated<br />
December 22, 1997 (incorporated by reference to Exhibit 10.20 to The Geon Company’s <strong>Annual</strong> <strong>Report</strong> on Form 10-K for the fiscal year<br />
ended December 31, 1997, SEC File No. 1-11804)<br />
10.30 Asset Contribution Agreement — PVC Partnership (Geon) (incorporated by reference to Exhibit 10.3 to The Geon Company’s Current<br />
<strong>Report</strong> on Form 8-K filed on May 13, 1999, SEC File No. 1-11804)<br />
10.31 Stock Purchase Agreement among O’Sullivan Films Holding Corporation, O’Sullivan Management, LLC, and Matrix Films, LLC, dated as of<br />
February 15, 2006 (incorporated by reference to Exhibit 10.25 to the Company’s <strong>Annual</strong> <strong>Report</strong> on Form 10-K for the fiscal year ended<br />
December 31, 2005, SEC File No. 1-16091)<br />
10.32+ Form of Award Agreement for Stock-Settled Stock Appreciation Rights (incorporated by reference to Exhibit 10.1 to the Company’s<br />
Quarterly <strong>Report</strong> on Form 10-Q for the quarter ended March 31, 2007, SEC File No. 1-16091)<br />
10.33+ Form of Award Agreement for Performance Units (incorporated by reference to Exhibit 10.2 to the Company’s Quarterly <strong>Report</strong> on<br />
Form 10-Q for the quarter ended March 31, 2007, SEC File No. 1-16091)<br />
10.34 Sale and Agreement, by and among <strong>PolyOne</strong> Corporation, Occidental Chemical Corporation, and their representative affiliates party<br />
thereto, dated as of July 6, 2007 (incorporated by reference to Exhibit 10.1 to the Company’s Quarterly <strong>Report</strong> on Form 10-Q for the<br />
quarter ended June 30, 2007, SEC File No. 1-16091)<br />
10.35 Second Amended and Restated Receivables Purchase Agreement, dated as of June 26, 2007, among <strong>PolyOne</strong> Funding Corporation, as<br />
seller; the Company, as servicer; the banks and other financial institutions party thereto, as purchasers; Citicorp USA, Inc., as agent; and<br />
National City Business Credit, Inc., as syndication agent (incorporated by reference to Exhibit 10.2 to the Company’s Quarterly <strong>Report</strong> on<br />
Form 10-Q for the quarter ended June 30, 2007, SEC File No. 1-16091)<br />
10.36 Second Amended and Restated Receivables Sale Agreement, dated as of June 26, 2007, among the Company, as seller and as servicer,<br />
and <strong>PolyOne</strong> Funding Corporation, as buyer (incorporated by reference to Exhibit 10.3 to the Company’s Quarterly <strong>Report</strong> on Form 10-Q for<br />
the quarter ended June 30, 2007, SEC File No. 1-16091)<br />
10.37 Canadian Receivables Purchase Agreement, dated as of July 13, 2007, among <strong>PolyOne</strong> Funding Canada Corporation, as seller; the<br />
Company, as servicer; the banks and other financial institutions party thereto, as purchasers; Citicorp USA, Inc., as agent; and National<br />
City Business Credit, Inc., as syndication agent (incorporated by reference to Exhibit 10.4 to the Company’s Quarterly <strong>Report</strong> on<br />
Form 10-Q for the quarter ended June 30, 2007, SEC File No. 1-16091)<br />
10.38 Canadian Receivables Sale Agreement, dated as of July 13, 2007, among <strong>PolyOne</strong> Canada Inc., as seller; <strong>PolyOne</strong> Funding Canada<br />
Corporation, as buyer; and the Company, as servicer (incorporated by reference to Exhibit 10.5 to the Company’s Quarterly <strong>Report</strong> on<br />
Form 10-Q for the quarter ended June 30, 2007, SEC File No. 1-16091)<br />
10.39 Credit Agreement, dated January 3, 2008, by and among <strong>PolyOne</strong> Corporation, the lenders party thereto, Citicorp USA, Inc., as<br />
administrative agent and as issuing bank, and The Bank of New York, as paying agent (incorporated by reference to Exhibit 10.1 to the<br />
Company’s Current <strong>Report</strong> on Form 8-K filed on January 3, 2008, SEC File No. 1-16091)<br />
10.40+ <strong>PolyOne</strong> Corporation 2008 Equity and Performance Incentive Plan (incorporated herein by reference to Appendix A to the Registrant’s<br />
proxy statement on Schedule 14A (SEC File No. 1-16091), filed on March 25, 2008).<br />
10.41+ Form of Award Agreement for Restricted Stock Units (incorporated by reference to Exhibit 10.1 to the Company’s Quarterly <strong>Report</strong> on<br />
Form 10-Q for the quarter ended March 31, 2008, SEC File No. 1-16091)<br />
10.42+ Form of Award Agreement for Stock-Settled Stock Appreciation Rights (incorporated by reference to Exhibit 10.2 to the Company’s<br />
Quarterly <strong>Report</strong> on Form 10-Q for the quarter ended March 31, 2008, SEC File No. 1-16091)<br />
10.43+ Form of Award Agreement for Performance Units (incorporated by reference to Exhibit 10.3 to the Company’s Quarterly <strong>Report</strong> on<br />
Form 10-Q for the quarter ended March 31, 2008, SEC File No. 1-16091)<br />
10.44+ First Amendment to The Geon Company Section 401(a)(17) Benefit Restoration Plan (December 31, 2007 Restatement) (incorporated by<br />
reference to Exhibit 10.1 to the Company’s Quarterly <strong>Report</strong> on Form 10-Q for the quarter ended March 31, <strong>2009</strong>, SEC File No. 1-16091)<br />
POLYONE CORPORATION
Exhibit No.<br />
Exhibit Description<br />
10.45+ Amendment No. 1 to the <strong>PolyOne</strong> Supplemental Retirement Benefit Plan (As Amended and Restated Effective December 31, 2007)<br />
(incorporated by reference to Exhibit 10.2 to the Company’s Quarterly <strong>Report</strong> on Form 10-Q for the quarter ended March 31, <strong>2009</strong>, SEC<br />
File No. 1-16091)<br />
10.46+ Form of Grant of Performance Shares under the <strong>2009</strong> Long-Term Incentive Plan (incorporated by reference to Exhibit 10.3 to the<br />
Company’s Quarterly <strong>Report</strong> on Form 10-Q for the quarter ended March 31, <strong>2009</strong>, SEC File No. 1-16091)<br />
10.47+ Form of Grant of Stock-Settled Stock Appreciation Rights under the <strong>2009</strong> Long-Term Incentive Plan (incorporated by reference to<br />
Exhibit 10.4 to the Company’s Quarterly <strong>Report</strong> on Form 10-Q for the quarter ended March 31, <strong>2009</strong>, SEC File No. 1-16091)<br />
10.48+ Form of Grant of Performance Units under the <strong>2009</strong> Long-Term Incentive Plan (incorporated by reference to Exhibit 10.5 to the Company’s<br />
Quarterly <strong>Report</strong> on Form 10-Q for the quarter ended March 31, <strong>2009</strong>, SEC File No. 1-16091)<br />
10.49+ Executive Severance Plan, as amended and restated effective February 17, <strong>2009</strong> (incorporated by reference to Exhibit 10.1 to the<br />
Company’s Quarterly <strong>Report</strong> on Form 10-Q for the quarter ended June 30, <strong>2009</strong>, SEC File No. 1-16091)<br />
10.50+ Undetermined Time Employment Contract between <strong>PolyOne</strong> Luxembourg s.a.r.l. and Bernard Baert (incorporated herein by reference to<br />
Exhibit 10.1 to the Company’s Form 8-K, filed with the Commission on September 2, <strong>2009</strong>, SEC File No. 1-106091)<br />
10.51+ Amendment No. 2 to the <strong>PolyOne</strong> Supplemental Retirement Benefit Plan (As Amended and Restated Effective December 31, 2007)<br />
18.1 Letter regarding Change in Accounting Principles (incorporated by reference to Exhibit No. 18.1 to the Company’s Quarterly <strong>Report</strong> on<br />
Form 10-Q for the quarter ended September 30, 2008, SEC File No. 1-16091)<br />
21.1 Subsidiaries of the Company<br />
23.1 Consent of Independent Registered Public Accounting Firm — Ernst & Young LLP<br />
23.2 Consent of Independent Registered Public Accounting Firm — KPMG LLP<br />
23.3 Consent of Independent Registered Public Accounting Firm — Ernst & Young LLP<br />
31.1 Certification of Stephen D. Newlin, Chairman, President and Chief Executive Officer, pursuant to SEC Rules 13a-14(a) and 15d-14(a),<br />
adopted pursuant to Section 302 of the Sarbanes-Oxley Act of 2002<br />
31.2 Certification of Robert M. Patterson, Senior Vice President and Chief Financial Officer, pursuant to SEC Rules 13a-14(a) and 15d-14(a),<br />
adopted pursuant to Section 302 of the Sarbanes-Oxley Act of 2002<br />
32.1 Certification pursuant to 18 U.S.C. § 1350, adopted pursuant to Section 906 of the Sarbanes-Oxley Act of 2002, as signed by Stephen D.<br />
Newlin, Chairman, President and Chief Executive Officer<br />
32.2 Certification pursuant to 18 U.S.C. § 1350, adopted pursuant to Section 906 of the Sarbanes-Oxley Act of 2002, as signed by Robert M.<br />
Patterson, Senior Vice President and Chief Financial Officer<br />
99.1 Audited Financial Statements of Oxy Vinyls, LP<br />
99.2 Audited Financial Statements of SunBelt Chlor Alkali Partnership<br />
+ Indicates management contract or compensatory plan, contract or arrangement in which one or more directors or executive officers of the<br />
Registrant may be participants<br />
POLYONE CORPORATION
Exhibit 31.1<br />
CERTIFICATION<br />
I, Stephen D. Newlin, certify that:<br />
1. I have reviewed this <strong>Annual</strong> <strong>Report</strong> on Form 10-K of <strong>PolyOne</strong> Corporation;<br />
2. Based on my knowledge, this report does not contain any untrue statement of a material fact or omit to state a material fact<br />
necessary to make the statements made, in light of the circumstances under which such statements were made, not misleading with respect<br />
to the period covered by this report;<br />
3. Based on my knowledge, the financial statements, and other financial information included in this report, fairly present in all material<br />
respects the financial condition, results of operations and cash flows of the registrant as of, and for, the periods presented in this report;<br />
4. The registrant’s other certifying officer(s) and I are responsible for establishing and maintaining disclosure controls and procedures<br />
(as defined in Exchange Act Rules 13a-15(e) and 15d-15(e)) and internal control over financial reporting (as defined in Exchange Act<br />
Rules 13a-15(f) and 15d-15(f)) for the registrant and have:<br />
(a) Designed such disclosure controls and procedures, or caused such disclosure controls and procedures to be designed under<br />
our supervision, to ensure that material information relating to the registrant, including its consolidated subsidiaries, is made known to<br />
us by others within those entities, particularly during the period in which this report is being prepared;<br />
(b) Designed such internal control over financial reporting, or caused such internal control over financial reporting to be designed<br />
under our supervision, to provide reasonable assurance regarding the reliability of financial reporting and the preparation of financial<br />
statements for external purposes in accordance with generally accepted accounting principles;<br />
(c) Evaluated the effectiveness of the registrant’s disclosure controls and procedures and presented in this report our conclusions<br />
about the effectiveness of the disclosure controls and procedures, as of the end of the period covered by this report based on such<br />
evaluation; and<br />
(d) Disclosed in this report any change in the registrant’s internal control over financial reporting that occurred during the<br />
registrant’s most recent fiscal quarter (the registrant’s fourth fiscal quarter in the case of an annual report) that has materially affected,<br />
or is reasonably likely to materially affect, the registrant’s internal control over financial reporting; and<br />
5. The registrant’s other certifying officer(s) and I have disclosed, based on our most recent evaluation of internal control over financial<br />
reporting, to the registrant’s auditors and the audit committee of the registrant’s board of directors (or persons performing the equivalent<br />
functions):<br />
(a) All significant deficiencies and material weaknesses in the design or operation of internal control over financial reporting which<br />
are reasonably likely to adversely affect the registrant’s ability to record, process, summarize and report financial information; and<br />
(b) Any fraud, whether or not material, that involves management or other employees who have a significant role in the registrant’s<br />
internal control over financial reporting.<br />
February 18, 2010<br />
/s/<br />
Stephen D. Newlin<br />
Stephen D. Newlin<br />
Chairman, President and Chief Executive Officer<br />
POLYONE CORPORATION
Exhibit 31.2<br />
CERTIFICATION<br />
I, Robert M. Patterson, certify that:<br />
1. I have reviewed this <strong>Annual</strong> <strong>Report</strong> on Form 10-K of <strong>PolyOne</strong> Corporation;<br />
2. Based on my knowledge, this report does not contain any untrue statement of a material fact or omit to state a material fact<br />
necessary to make the statements made, in light of the circumstances under which such statements were made, not misleading with respect<br />
to the period covered by this report;<br />
3. Based on my knowledge, the financial statements, and other financial information included in this report, fairly present in all material<br />
respects the financial condition, results of operations and cash flows of the registrant as of, and for, the periods presented in this report;<br />
4. The registrant’s other certifying officer(s) and I are responsible for establishing and maintaining disclosure controls and procedures<br />
(as defined in Exchange Act Rules 13a-15(e) and 15d-15(e)) and internal control over financial reporting (as defined in Exchange Act<br />
Rules 13a-15(f) and 15d-15(f)) for the registrant and have:<br />
(a) Designed such disclosure controls and procedures, or caused such disclosure controls and procedures to be designed under<br />
our supervision, to ensure that material information relating to the registrant, including its consolidated subsidiaries, is made known to<br />
us by others within those entities, particularly during the period in which this report is being prepared;<br />
(b) Designed such internal control over financial reporting, or caused such internal control over financial reporting to be designed<br />
under our supervision, to provide reasonable assurance regarding the reliability of financial reporting and the preparation of financial<br />
statements for external purposes in accordance with generally accepted accounting principles;<br />
(c) Evaluated the effectiveness of the registrant’s disclosure controls and procedures and presented in this report our conclusions<br />
about the effectiveness of the disclosure controls and procedures, as of the end of the period covered by this report based on such<br />
evaluation; and<br />
(d) Disclosed in this report any change in the registrant’s internal control over financial reporting that occurred during the<br />
registrant’s most recent fiscal quarter (the registrant’s fourth fiscal quarter in the case of an annual report) that has materially affected,<br />
or is reasonably likely to materially affect, the registrant’s internal control over financial reporting; and<br />
5. The registrant’s other certifying officer(s) and I have disclosed, based on our most recent evaluation of internal control over financial<br />
reporting, to the registrant’s auditors and the audit committee of the registrant’s board of directors (or persons performing the equivalent<br />
functions):<br />
(a) All significant deficiencies and material weaknesses in the design or operation of internal control over financial reporting which<br />
are reasonably likely to adversely affect the registrant’s ability to record, process, summarize and report financial information; and<br />
(b) Any fraud, whether or not material, that involves management or other employees who have a significant role in the registrant’s<br />
internal control over financial reporting.<br />
February 18, 2010<br />
/s/<br />
Robert M. Patterson<br />
Robert M. Patterson<br />
Senior Vice President and Chief Financial Officer<br />
POLYONE CORPORATION
Exhibit 32.1<br />
CERTIFICATION PURSUANT TO<br />
18 U.S.C. SECTION 1350,<br />
AS ADOPTED PURSUANT TO<br />
SECTION 906 OF THE SARBANES-OXLEY ACT OF 2002<br />
In connection with the <strong>Annual</strong> <strong>Report</strong> on Form 10-K of <strong>PolyOne</strong> Corporation (the “Company”) for the year ended December 31, <strong>2009</strong>, as<br />
filed with the Securities and Exchange Commission on the date hereof (the “<strong>Report</strong>”), I, Stephen D. Newlin, Chairman, President and Chief<br />
Executive Officer of the Company, do hereby certify, pursuant to 18 U.S.C. § 1350, as adopted pursuant to § 906 of the Sarbanes-Oxley Act of<br />
2002, that, to my knowledge:<br />
(1) The <strong>Report</strong> fully complies with the requirements of Section 13(a) or 15(d) of the Securities Exchange Act of 1934; and<br />
(2) The information contained in the <strong>Report</strong> fairly presents, in all material respects, the financial condition and results of operations<br />
of the Company as of the dates and for the periods expressed in the <strong>Report</strong>.<br />
February 18, 2010<br />
/s/<br />
Stephen D. Newlin<br />
Stephen D. Newlin<br />
Chairman, President and Chief Executive Officer<br />
The foregoing certification is being furnished solely pursuant to 18 U.S.C. § 1350 and is not being filed as part of the <strong>Report</strong> or as a<br />
separate disclosure document.<br />
POLYONE CORPORATION
Exhibit 32.2<br />
CERTIFICATION PURSUANT TO<br />
18 U.S.C. SECTION 1350,<br />
AS ADOPTED PURSUANT TO<br />
SECTION 906 OF THE SARBANES-OXLEY ACT OF 2002<br />
In connection with the <strong>Annual</strong> <strong>Report</strong> on Form 10-K of <strong>PolyOne</strong> Corporation (the “Company”) for the year ended December 31, <strong>2009</strong>, as<br />
filed with the Securities and Exchange Commission on the date hereof (the “<strong>Report</strong>”), I, Robert M. Patterson, Senior Vice President and Chief<br />
Financial Officer of the Company, do hereby certify, pursuant to 18 U.S.C. § 1350, as adopted pursuant to § 906 of the Sarbanes-Oxley Act of<br />
2002, that, to my knowledge:<br />
(1) The <strong>Report</strong> fully complies with the requirements of Section 13(a) or 15(d) of the Securities Exchange Act of 1934; and<br />
(2) The information contained in the <strong>Report</strong> fairly presents, in all material respects, the financial condition and results of operations<br />
of the Company as of the dates and for the periods expressed in the <strong>Report</strong>.<br />
February 18, 2010<br />
/s/<br />
Robert M. Patterson<br />
Robert M. Patterson<br />
Senior Vice President and Chief Financial Officer<br />
The foregoing certification is being furnished solely pursuant to 18 U.S.C. § 1350 and is not being filed as part of the <strong>Report</strong> or as a<br />
separate disclosure document.<br />
POLYONE CORPORATION
THIS PAGE IS NOT PART OF POLYONE’S FORM 10-K FILING<br />
<strong>PolyOne</strong> Stock Performance<br />
The following is a graph that compares the cumulative total shareholder returns for <strong>PolyOne</strong>’s common shares, the S&P 500 index and<br />
the S&P Mid Cap Chemicals index with dividends assumed to be reinvested when received. The graph assumes the investing of $100<br />
from December 31, 2004 through December 31, <strong>2009</strong>. The S&P Mid Cap Chemicals index includes a broad range of chemical<br />
manufacturers. Because of the relationship of <strong>PolyOne</strong>’s business within the chemical industry, it is concluded that comparison with<br />
this broader index is appropriate.<br />
$200<br />
Comparison of Cumulative Total Return to Shareholders<br />
$150<br />
$100<br />
$50<br />
$0<br />
12/31/04<br />
12/31/05<br />
12/31/06<br />
12/31/07<br />
12/31/08<br />
12/31/09<br />
Company / Index<br />
POLYONE CORPORATION S&P 500 INDEX S&P MID CAP CHEMICALS<br />
Base<br />
INDEXED RETURNS<br />
Period<br />
Years Ending<br />
12/31/04 12/31/05 12/31/06 12/31/07 12/31/08 12/31/09<br />
<strong>PolyOne</strong> Corporation $100 $ 70.97 $ 82.78 $ 72.63 $34.77 $ 82.45<br />
S&P 500 Index $100 $104.91 $121.48 $128.16 $80.74 $102.11<br />
S&P Mid Cap Chemicals $100 $ 97.94 $115.33 $146.57 $92.22 $146.96<br />
STOCK EXCHANGE LISTING<br />
<strong>PolyOne</strong> Corporation Common Stock is listed in the New York Stock Exchange.<br />
Symbol: POL.<br />
SHAREHOLDER INQUIRIES<br />
If you have any questions concerning your account as a shareholder, name or<br />
address changes, inquiries regarding stock certificates, or if you need tax<br />
information regarding your account, please contact our transfer agent:<br />
Computershare Trust Company, N.A.<br />
P.O. Box 43078<br />
Providence, Rhode Island 02940-3078<br />
Phone: 877-498-8861<br />
www.computershare.com<br />
Additional information about <strong>PolyOne</strong>, including current and historic copies<br />
of Form 10-K and other reports filed with the Securities and Exchange<br />
Commission, is available online at www.polyone.com or free of charge from:<br />
Investor Affairs Administrator<br />
<strong>PolyOne</strong> Corporation<br />
33587 Walker Road<br />
Avon Lake, Ohio 44012<br />
Phone: 440-930-1522<br />
ANNUAL MEETING<br />
The annual meeting of shareholders of <strong>PolyOne</strong> Corporation will be held May 12,<br />
2010 at 9:00 a.m. at the LACENTRE Conference and Banquet Facility,<br />
Champagne C Ballroom, 25777 Detroit Road, Westlake, Ohio. The meeting notice<br />
and proxy materials were mailed to shareholders with this annual report. <strong>PolyOne</strong><br />
Corporation urges all shareholders to vote their proxies so that they can participate<br />
in the decisions at the annual meeting.<br />
FINANCIAL INFORMATION<br />
Security analysts and representatives of financial institutions are invited to<br />
contact:<br />
Joseph P. Kelley<br />
Vice President, Planning and Investor Relations<br />
Phone: 440.930.3502<br />
Fax: 440.930.1750<br />
E-mail: joseph.kelley@polyone.com<br />
AUDITORS<br />
Ernst & Young LLP<br />
925 Euclid Avenue, Suite 1300<br />
Cleveland, Ohio 44115-1476<br />
INTERNET ACCESS<br />
Information on <strong>PolyOne</strong>’s products and services, news releases, corporate<br />
governance, EDGAR filings, Forms 10-K and 10-Q, etc., as well as an electronic<br />
version of this annual report, are available on the Internet at www.polyone.com.<br />
ANNUAL CERTIFICATIONS<br />
<strong>PolyOne</strong> Corporation included as Exhibits 31.1 and 31.2 to its <strong>Annual</strong> <strong>Report</strong><br />
on Form 10-K for <strong>2009</strong>, filed with the Securities and Exchange Commission,<br />
certificates of its Chief Executive Officer and Chief Financial Officer certifying<br />
the quality of <strong>PolyOne</strong>’s public disclosure. On June 9, <strong>2009</strong>, <strong>PolyOne</strong><br />
Corporation submitted to the New York Stock Exchange a certificate of the<br />
Chief Executive Officer of <strong>PolyOne</strong> certifying that he is not aware of any<br />
violation by <strong>PolyOne</strong> of New York Stock Exchange corporate governance<br />
standards.<br />
POLYONE CORPORATION
CORPORATE OFFICERS<br />
BOARD OF DIRECTORS<br />
STEPHEN D. NEWLIN<br />
Chairman, President and Chief Executive Officer<br />
ARIF N. AHMED<br />
Vice President and Treasurer<br />
BERNARD BAERT<br />
Senior Vice President, President of Europe and<br />
International<br />
DR. CECIL C. CHAPPELOW<br />
Vice President, Innovation, Sustainability and<br />
Chief Innovation Officer<br />
DR. WILLIE CHIEN<br />
Vice President, President of Asia<br />
MICHAEL E. KAHLER<br />
Senior Vice President, Chief Commercial Officer<br />
THOMAS J. KEDROWSKI<br />
Senior Vice President, Supply Chain and<br />
Operations<br />
JOSEPH P. KELLEY<br />
Vice President, Planning and Investor Relations<br />
LISA K. KUNKLE<br />
Vice President, General Counsel and Secretary<br />
CRAIG M. NIKRANT<br />
Senior Vice President, President of Global<br />
Specialty Engineered Materials<br />
ROBERT M. PATTERSON<br />
Senior Vice President and Chief Financial Officer<br />
MICHAEL L. RADEMACHER<br />
Senior Vice President, President of Distribution<br />
ROBERT M. ROSENAU<br />
Senior Vice President, President of Performance<br />
Products and Solutions<br />
VINCENT W. SHEMO<br />
Vice President and Corporate Controller<br />
KENNETH M. SMITH<br />
Senior Vice President, Chief Information and<br />
Human Resources Officer<br />
JOHN V. VAN HULLE<br />
Senior Vice President, President of Global Color,<br />
Additives and Inks<br />
FRANK J. VARI<br />
Vice President, Tax<br />
STEPHEN D. NEWLIN<br />
Chairman, President and Chief Executive Officer,<br />
<strong>PolyOne</strong> Corporation. Committees: 3,4<br />
J. DOUGLAS CAMPBELL<br />
Retired Chairman and Chief Executive Officer,<br />
ArrMaz Custom Chemicals, Inc. – a specialty mining<br />
and asphalt additives and reagents producer.<br />
Committees: 2,3,4*<br />
DR. CAROL A. CARTWRIGHT<br />
President, Bowling Green State University –<br />
a public higher education institution.<br />
Committees: 1,5*<br />
GALE DUFF-BLOOM<br />
Retired President, Company Communications<br />
and Corporate Image, J.C. Penney Company Inc.<br />
– a major retailer. Committees: 3,4,5<br />
RICHARD H. FEARON<br />
Vice Chairman and Chief Financial and<br />
Planning Officer, Eaton Corporation – a global<br />
manufacturing company. Committees: 1*,5<br />
GORDON D. HARNETT<br />
Lead Director<br />
Retired Chairman and Chief Executive Officer,<br />
Brush Engineered Materials, Inc. – a supplier and<br />
producer of engineered materials. Committees: 1,2*<br />
RICHARD A. LORRAINE<br />
Retired Senior Vice President and Chief<br />
Financial Officer, Eastman Chemical Company –<br />
a specialty chemicals company. Committees: 1,5<br />
EDWARD J. MOONEY<br />
Retired Chairman and Chief Executive Officer,<br />
Nalco Chemical Company – a specialty<br />
chemicals company. Committees: 2,3*,4<br />
WILLIAM H. POWELL<br />
Retired Chairman and Chief Executive Officer,<br />
National Starch and Chemical Company –<br />
a specialty chemical company. Committees: 2,3,4<br />
FARAH M. WALTERS<br />
President and Chief Executive Officer, QualHealth,<br />
LLC – a healthcare consulting firm. Committees: 2,4<br />
COMMITTEES<br />
1. Audit<br />
2. Compensation<br />
3. Environmental, Health and Safety<br />
4. Financial Policy<br />
5. Nominating and Governance<br />
* Denotes Chairperson


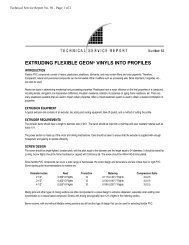
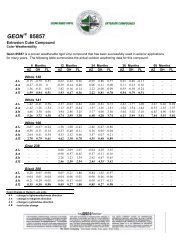
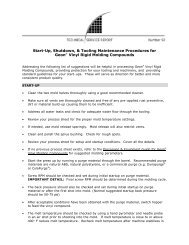
![TPE Injection Molding Guide [PDF] - GLS Thermoplastic Elastomers](https://img.yumpu.com/26329362/1/190x245/tpe-injection-molding-guide-pdf-gls-thermoplastic-elastomers.jpg?quality=85)