Truck GPS Data Research by Abdul Pinjari - FSUTMSOnline
Truck GPS Data Research by Abdul Pinjari - FSUTMSOnline
Truck GPS Data Research by Abdul Pinjari - FSUTMSOnline

Create successful ePaper yourself
Turn your PDF publications into a flip-book with our unique Google optimized e-Paper software.
<strong>Truck</strong> <strong>GPS</strong> <strong>Data</strong> for Freight Planning<br />
presented to<br />
Florida Model Task Force, Orlando<br />
presented <strong>by</strong><br />
Frank Tabatabaee<br />
<strong>Abdul</strong> <strong>Pinjari</strong><br />
Jeff Short<br />
(ATRI)<br />
Florida DOT<br />
University of South Florida (USF)<br />
American Transportation <strong>Research</strong> Institute<br />
Date: March 6, 2012
Acknowledgements<br />
FDOT Systems Planning Office<br />
• Frank Tabatabaee<br />
American Transportation <strong>Research</strong> Institute (ATRI)<br />
• Jeff Short<br />
• Dave Pierce<br />
• Lisa Park<br />
• Dan Murray<br />
1<br />
Graduate Students from University of South Florida<br />
• Aayush Thakur<br />
• Anissa Nur Irmania & Jonathan Koons
Background<br />
Significant growth in freight movement calls for improved freight<br />
planning and decision processes<br />
Major challenge: Inadequate data!<br />
Recent efforts to exploit technology for data collection<br />
• <strong>GPS</strong>-based automatic vehicle monitoring and location (AVM) & AVL) data<br />
The ATRI-FPM Initiative<br />
• Joint venture <strong>by</strong> ATRI and FHWA<br />
• A national system for monitoring freight performance measures<br />
on key corridors<br />
• Based on satellite data from trucking companies who use <strong>GPS</strong><br />
technologies to monitor their fleet<br />
2
Project Objectives<br />
Investigate the use of ATRI-FPM data for freight performance<br />
measurement and planning in Florida<br />
Develop methods for the following applications with the data<br />
1. Derive freight performance measures for Florida’s highways<br />
2. Derive a truck-trip database (from ATRI-FPM data) to<br />
understand the characteristics of truck travel in Florida<br />
3. Derive truck trip OD tables for the Florida Statewide Model<br />
3
Freight Performance Measurement with<br />
ATRI-FPM <strong>GPS</strong> data<br />
Contributors<br />
Jeff Short, ATRI<br />
Dave Pierce, ATRI<br />
Lisa Park, ATRI<br />
Speeds<br />
Reliability measures<br />
Congestion Measures<br />
4
APPLICATIONS OF ATRI'S DATA<br />
FOR THE STATE OF FLORIDA<br />
Average Highway Speeds<br />
Reliability Measurements<br />
Analysis of Chokepoints<br />
Measures of Corridor Demand and Freight Activity Intensity<br />
<strong>Truck</strong> Flow Analysis<br />
Origin and Destination Estimates<br />
Other Analysis
Application One: Average Highway<br />
Speeds<br />
<strong>Data</strong> are processed through a series of software<br />
programs to generate measures<br />
Those measures are plotted along a corridor map in<br />
a GIS environment<br />
<strong>Data</strong> can be analyzed both in terms of space mean<br />
speed and spot mean speed
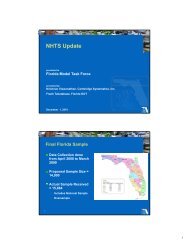
Application One: Average Highway<br />
Speeds<br />
Sample Study Area, I-95 Miles 24-48.
Application One: Average Highway<br />
Speeds<br />
Average Speeds <strong>by</strong> Hour, I-95 Miles 24-48
Application Two: Reliability<br />
Measures<br />
For both space and spot mean speed calculations,<br />
relevant reliability measures include the Travel<br />
Time Index (TTI) and Planning Time Index (PTI)<br />
TTI is the ratio of the average speed for a given<br />
highway segment at a particular time of day to the<br />
functional free flow speed of the same segment of<br />
highway.<br />
PTI is the ratio of the “worst-case scenario”<br />
average travel speed for a given highway segment<br />
at a particular time of day to the functional free flow<br />
speed of the same segment of highway.
Application Two: Reliability Measures<br />
Location of Study Corridors
Application Two: Reliability Measures<br />
Miami, FL - April-June 2010<br />
Freeway Section<br />
(sorted from most congested to<br />
Polyline<br />
least congested)<br />
1<br />
2<br />
3<br />
4<br />
5<br />
6<br />
7<br />
8<br />
Length<br />
(mi)<br />
Morning Peak<br />
(6a-9a)<br />
Travel Time Index<br />
Midday<br />
(9a-4p)<br />
I-95 NB: SR 91 to SR 84 12.2 1.16 1.10 1.18 1.17 1.69 1.35 2.04 1.82<br />
I-95 SB: SR 84 to SR 91 12.2 1.12 1.16 1.36 1.19 1.68 1.77 3.12 2.12<br />
I-95 NB: I-195 to SR 91 8.2 1.09 1.17 2.07 1.68 1.38 2.40 10.00 6.56<br />
I-95 SB: SR 91 to I-195 8.2 1.36 1.27 1.33 1.36 3.41 2.93 4.16 3.49<br />
I-95 NB: US 1 to I-195 5.1 1.21 1.18 1.65 1.38 3.17 1.64 4.31 3.62<br />
I-95 SB: I-195 to US 1 5.1 1.25 1.18 1.39 1.27 3.13 2.24 4.57 3.31<br />
I-75 NB: SR 821 to I-595 13.3 1.04 1.05 1.15 1.06 1.11 1.15 1.66 1.21<br />
I-75 SB: I-595 to SR 821 13.3 1.09 1.06 1.09 1.09 1.35 1.16 1.28 1.33<br />
SR 826 NB: SR 836 to I-75 8.3 1.12 1.18 1.86 1.53 1.50 1.67 5.20 3.56<br />
SR 826 SB: I-75 to SR 836 8.3 1.28 1.31 1.51 1.32 2.18 2.57 7.59 3.10<br />
SR 91 NB: SR 821 to SR 852 2.9 1.35 1.18 1.29 1.33 3.15 2.30 3.97 3.36<br />
SR 91 SB: SR 852 to Sr 821 0.3 1.29 1.21 1.17 1.26 5.96 4.15 1.81 4.93<br />
I-75 NB: SR 826 to SR 821 4.9 1.05 1.05 1.08 1.06 1.10 1.08 1.10 1.10<br />
I-75 SB: SRI 821 to SR 826 4.8 1.42 1.15 1.08 1.30 6.65 2.91 1.29 4.73<br />
SR 826 EB: I-75 to I-95 8.3 1.35 1.15 1.21 1.31 2.94 1.58 2.74 2.88<br />
SR 826 WB: I-95 to I-75 8.3 1.40 1.23 1.32 1.38 3.42 2.28 3.64 3.46<br />
Evening<br />
Peak<br />
(4p-7p)<br />
Average<br />
Peak<br />
Period<br />
Morning<br />
Peak<br />
(6a-9a)<br />
Planning Time Index<br />
Midday<br />
(9a-4p)<br />
Evening<br />
Peak<br />
(4p-7p)<br />
Average<br />
Peak<br />
Period<br />
Travel Time Index and Planning Time Index for Eight Miami Corridors
Application Three: Analysis of<br />
Chokepoints<br />
Analysis of chokepoints can offer a better<br />
understanding of when, where and possibly why,<br />
congestion is occurring<br />
Study areas are often no more than 4 miles across,<br />
and are assessed in one hour increments<br />
Further analysis would provide quantification of<br />
which segments or directions of an interchange<br />
have the worst congestion
Application Three: Analysis of Chokepoints<br />
Bottleneck Analysis for I-4 at I-275 in Tampa from 2009 FHWA/ATRI Bottleneck Report
Application Four: Measures of Corridor<br />
Demand and Freight Activity Intensity<br />
Relative volume relationships between corridors.<br />
Freight Intensity Index: derived <strong>by</strong> dividing the number of<br />
position reads <strong>by</strong> the length of the segment.<br />
<strong>Data</strong> is indexed with the highest freight intensity receiving<br />
a value of 100.<br />
The FPM data can also be used to explore regional freight<br />
activities <strong>by</strong> determining the number of truck position<br />
data points contained within each county and dividing<br />
that figure <strong>by</strong> the length of the roadway segments in the<br />
county.
Application Four: Measures of Corridor<br />
Demand and Freight Activity Intensity<br />
Freight Intensity Index for Florida, April-June 2010
Application Four: Measures of Corridor<br />
Demand and Freight Activity Intensity<br />
Freight Intensity Analysis <strong>by</strong> County
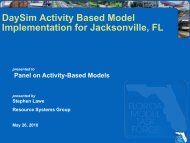
Application Five: <strong>Truck</strong> Flow<br />
Analysis<br />
Identify freight movement trends between geographic<br />
areas<br />
Insight into what routes are taken between two locations<br />
Sample of more than 1,000 trucks that originated in, or were<br />
traveling through, Miami on a given day; the traced paths<br />
after 7 days of truck movement are shown in red, as well<br />
as the percentage of the truck population that entered<br />
each state.
Miami<br />
1,000 <strong>Truck</strong> Sample
1,000 <strong>Truck</strong>s After 24 Hours
Same 1,000 <strong>Truck</strong>s After 48 Hours
Same 1,000 <strong>Truck</strong>s After 72 Hours
Same 1,000 <strong>Truck</strong>s After 5 Days
Same 1,000 <strong>Truck</strong>s After 7 Days
Same 1,000 <strong>Truck</strong>s After 7 Days
25<br />
Focus of Performance Measurement on<br />
Florida’s Strategic Intermodal System (SIS)
PM Peak Period Speeds on Florida’s SIS Highways
Jacksonville<br />
PM Peak Period Speeds on Florida’s SIS Highways
Jacksonville<br />
PM Peak Period Speeds on Florida’s SIS Highways
Tampa<br />
PM Peak Period Speeds on Florida’s SIS Highways
PM Peak Period Speeds on Florida’s SIS Highways<br />
Miami
Miami<br />
PM Peak Period Speeds on Florida’s SIS Highways
Miami<br />
PM Peak Period Speeds on Florida’s SIS Highways
33<br />
Bottleneck Analysis
__<br />
In-state truck routes in the data<br />
Florida I-75 Freight Route Choice Illustration<br />
34 34
__<br />
In-state routes<br />
. 4000 unique trucks that were on I-75<br />
during a 1week period (Oct 24-30)<br />
Florida I-75 Freight Route Choice<br />
35 35
Close-up of route patterns in<br />
Gainesville /Ocala region<br />
Florida I-75 Freight Route Choice<br />
36 36
1333 of the 4000 trucks crossed I-75 here<br />
37 Florida I-75 Freight Route Choice<br />
37
949 trucks took this route<br />
308 trucks took this route<br />
Of the 1333 trucks that crossed I-75 here<br />
Florida I-75 Freight Route Choice<br />
38<br />
38
Project Objectives<br />
Investigate the use of ATRI-FPM data for freight<br />
measurement and planning in Florida<br />
• Derive freight performance measures for Florida’s<br />
highways<br />
• Derive a truck-trip database from ATRI-FPM data<br />
• Convert <strong>GPS</strong> data streams to truck trips, and analyze truck<br />
travel characteristics in Florida<br />
• Billions of <strong>GPS</strong> data points!<br />
• Needed to simplify the problem (Seasonality of truck flows)<br />
• Derive truck trip OD tables for the Florida Statewide<br />
Freight model<br />
39
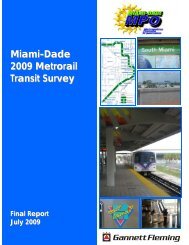
Seasonality in the Florida <strong>Truck</strong> Count <strong>Data</strong><br />
Vehicle Count Station Locations in Florida<br />
Count Stations<br />
SIS Highway Network<br />
40
<strong>Truck</strong> Counts <strong>by</strong> Month of the Year<br />
10000<br />
9000<br />
8000<br />
<strong>Truck</strong> Flows in Florida (Counts for all <strong>Truck</strong>s)<br />
<strong>by</strong> Month<br />
95th<br />
Percentile<br />
75th<br />
Percentile<br />
Median<br />
25th<br />
Percentile<br />
<strong>Truck</strong>s per day<br />
7000<br />
6000<br />
5000<br />
4000<br />
Mean<br />
5th<br />
Percentile<br />
3000<br />
2000<br />
1000<br />
0<br />
41
<strong>Truck</strong> Counts <strong>by</strong> Month of the Year<br />
<strong>Truck</strong>s per day<br />
3000<br />
2500<br />
2000<br />
1500<br />
1000<br />
500<br />
0<br />
Florida <strong>Truck</strong> Flows (Counts for Single Unit <strong>Truck</strong>s) <strong>by</strong><br />
Month<br />
Mean<br />
95th<br />
Percentile<br />
75th<br />
Percentile<br />
Median<br />
25th<br />
Percentile<br />
5th<br />
Percentile<br />
<strong>Truck</strong>s per day<br />
7000<br />
6000<br />
5000<br />
4000<br />
3000<br />
2000<br />
1000<br />
0<br />
Florida <strong>Truck</strong> Flows (Counts for Tractor-Trailers) <strong>by</strong> Month<br />
95th<br />
Percentile<br />
75th<br />
Percentile<br />
Median<br />
25th<br />
Percentile<br />
5th<br />
Percentile<br />
Mean<br />
42
<strong>Truck</strong> Counts <strong>by</strong> Day of Week<br />
12000<br />
Florida <strong>Truck</strong> Flows (Counts for all <strong>Truck</strong>s)<br />
<strong>by</strong> Day of Week<br />
95th<br />
Percentile<br />
75th<br />
Percentile<br />
Median<br />
10000<br />
8000<br />
Mean<br />
25th<br />
Percentile<br />
5th<br />
Percentile<br />
<strong>Truck</strong>s per day<br />
6000<br />
4000<br />
2000<br />
0<br />
AADT Sunday Monday Tuesday Wednesday Thursday Friday Saturday<br />
43
<strong>Truck</strong> Counts <strong>by</strong> Day of Week<br />
4000<br />
3500<br />
Florida <strong>Truck</strong> Flows (Counts for Single Unit <strong>Truck</strong>s)<br />
<strong>by</strong> Day of Week<br />
95th<br />
Percentile<br />
75th<br />
Percentile<br />
Median<br />
25th<br />
Percentile<br />
<strong>Truck</strong>s per day<br />
3000<br />
2500<br />
2000<br />
1500<br />
1000<br />
500<br />
Mean<br />
5th<br />
Percentile<br />
44<br />
<strong>Truck</strong>s per day<br />
0<br />
9000<br />
8000<br />
7000<br />
6000<br />
5000<br />
4000<br />
3000<br />
2000<br />
1000<br />
0<br />
AADT Sunday Monday Tuesday Wednesday Thursday Friday Saturday<br />
Florida <strong>Truck</strong> Flows (Counts for Tractor-Trailers)<br />
<strong>by</strong> Day of Week<br />
Mean<br />
AADT Sunday Monday Tuesday Wednesday Thursday Friday Saturday<br />
95th<br />
Percentile<br />
75th<br />
Percentile<br />
Median<br />
25th<br />
Percentile<br />
5th<br />
Percentile
Conversion of <strong>GPS</strong> <strong>Data</strong> Streams to <strong>Truck</strong> Trips<br />
Seasonality analysis of the truck count data suggests<br />
• Seasonal variation not significant<br />
• Weekday vs. weekend differences<br />
Experience with one week of <strong>GPS</strong> data<br />
• Take all trucks that were in Florida at any time during 1 week<br />
• Start with <strong>GPS</strong> traces of those trucks within Florida (1.5 Million traces)<br />
• Then trace those trucks outside Florida as well (4.35 Million traces)<br />
• Initial results in next slides<br />
Next step: Derive trips from multiple weeks of data (2-3<br />
months)<br />
45
46<br />
Examples of truck movements in the data
47<br />
47
Distance vs. Time between Consecutive <strong>GPS</strong> Points:<br />
1 Week <strong>GPS</strong> <strong>Data</strong> within and Outside Florida<br />
Distance between 2 consecutive points (in miles)<br />
0 - 0.1 0.1 - 1 1 - 3 3 - 5 5 - 10 10 - 15 15 - 20 20 - 30 30-70 70-150 150-400 > 400 Total Cum%<br />
0 - 1 408082 248830 2627 9 9 4 2 2 0 0 0 3 659570 15.55%<br />
1 - 3 191717 172206 105488 10472 12 6 1 3 4 1 2 3 479919 26.87%<br />
Time difference between 2 consecutive points (in minutes)<br />
3 - 5 115523 222730 361660 274138 228827 21 2 1 1 0 0 2 1202907 55.23%<br />
5 - 10 162734 83541 140623 102754 126394 11514 89 10 2 1 0 4 627666 70.03%<br />
10 - 15 97722 19032 60694 52723 116597 94761 66965 4304 7 0 2 0 512809 82.13%<br />
15 - 30 144120 11117 38492 36323 88716 74971 85088 9602 1266 1 2 2 489703 93.67%<br />
30 - 60 84714 1616 1076 734 1421 950 862 1209 1930 407 86 1 94601 95.90%<br />
60 - 120 54409 1095 597 375 484 282 195 277 779 320 233 2 58730 97.29%<br />
120-240 47938 596 319 166 226 100 63 84 182 80 217 3 49972 98.47%<br />
240-420 31531 294 157 94 120 63 33 37 60 23 104 2 32588 99.24%<br />
420-720 22346 345 179 106 146 76 53 43 92 33 88 17 23575 99.79%<br />
720-2880 8062 136 58 28 38 18 12 16 52 23 82 24 8609 100.00%<br />
>2880 177 2 3 1 1 1 2 0 3 1 1 5 200 100.00%<br />
Total 1369075 761540 711973 477923 562991 182767 153367 15588 4378 817 362 68 4240849<br />
Cum% 32.28% 50.24% 67.03% 78.30% 91.57% 95.88% 99.50% 99.87% 99.97% 99.97% 99.99% 100.00%
Trips Extracted from 1 Week <strong>Data</strong> within Florida:<br />
Trip Length Distribution<br />
120<br />
110<br />
100<br />
90<br />
Length of trip (in miles)<br />
80<br />
70<br />
60<br />
50<br />
40<br />
30<br />
20<br />
10<br />
0<br />
95th<br />
Percentile<br />
75th<br />
Percentile<br />
Median<br />
25th<br />
Percentile<br />
5th<br />
Percentile<br />
49
Trips Extracted from 1 Week <strong>Data</strong> within Florida:<br />
Trip Duration Distribution<br />
180<br />
160<br />
140<br />
Mean<br />
Duration of trip (in minutes)<br />
120<br />
100<br />
80<br />
60<br />
40<br />
20<br />
0<br />
50
Trips Extracted from 1 Week <strong>Data</strong> within & Outside FL:<br />
Trip Length Distribution<br />
220<br />
200<br />
180<br />
160<br />
Length of trip (in miles)<br />
140<br />
120<br />
100<br />
80<br />
60<br />
40<br />
20<br />
0<br />
51
Trips Extracted from 1 Week <strong>Data</strong> within & Outside FL:<br />
Trip Duration Distribution<br />
300<br />
280<br />
260<br />
240<br />
Duration of trip (in minutes)<br />
220<br />
200<br />
180<br />
160<br />
140<br />
120<br />
100<br />
80<br />
60<br />
40<br />
20<br />
0<br />
52
Scatter Plots – Trip length vs. Trip duration<br />
For 1-week dataset within Florida (52526 trips)<br />
Speeds range from 5mph to 65mph<br />
For 1-week dataset within & outside Florida (137378 trips)<br />
Speeds range from 5mph to 70mph<br />
53
Conversion of <strong>GPS</strong> <strong>Data</strong> Streams to <strong>Truck</strong> Trips<br />
Next steps on deriving a truck trip database<br />
• Validate and refine the algorithm<br />
• Overlay the trips onto land-use GIS layers to refine trips data<br />
• Derive trips from multiple weeks of data (2-3 months)<br />
54
Project Objectives<br />
Investigate the use of ATRI-FPM data for freight<br />
measurement and planning in Florida<br />
• Derive freight performance measures for FL highways<br />
• Derive a truck-trip database from ATRI-FPM <strong>GPS</strong> data<br />
• Derive truck trip OD tables for the Florida Statewide<br />
Freight model<br />
• The trips derived from the <strong>GPS</strong> data is a sample (large sample)<br />
• Need a way to arrive at the population of truck flows<br />
• Exploring the use of different data sources and methods<br />
• The 100% truck count data, and OD estimation methods<br />
• Linking truck flows with commodity flows (e.g., Transearch)<br />
• Parcel/TAZ-level industry employment data<br />
55
Thank You<br />
Questions/Discussion<br />
56
Additional Slides (for Q&A)<br />
57<br />
Task<br />
Schedule<br />
1. Review ATRI’s truck <strong>GPS</strong> (i.e., ATRI-FPM data) & applications May 2011 –<br />
Aug 2011<br />
2. Review other data sources that ATRI-FPM data can supplement,<br />
and how ATRI-FPM data can be combined w/ other data sources.<br />
July 2011 –<br />
Oct 2011<br />
3. Derive freight performance measures for Florida’s highways Sept 2011 –<br />
Nov 2011<br />
4. Derive a truck trip database from ATRI’s truck <strong>GPS</strong> data Nov 2011 –<br />
April 2012<br />
5. Analyze truck trip database to understand truck travel in FL April 2012 –<br />
June 2012<br />
6. Investigate ways to relate commodity flows with truck flows June 2012 –<br />
Oct 2012<br />
7. Derive a truck trip OD table for a reasonable level of geography Sept 2012 –<br />
Dec 2012<br />
8 and 9. Final research report, review <strong>by</strong> FDOT, and revisions Dec 2012 –<br />
April 2013
Task 1: Review ATRI’s data and Applications (Complete)<br />
• Review ATRI’s truck <strong>GPS</strong> data and applications<br />
− Materials describing the data<br />
− Review of the data in Florida<br />
− Synthesis of the data applications<br />
• Meeting between USF, ATRI, and FDOT<br />
− Identify subsets of data for further applications<br />
− Identify the geographical/network/temporal scope for<br />
applications<br />
• Other Administrative<br />
− Kick-off meeting<br />
− mechanism to transfer large datasets between ATRI & USF<br />
− Non-disclosure agreement between ATRI and USF<br />
58
Task 2: Review other freight data sources that can be used in<br />
conjunction with ATRI’s truck <strong>GPS</strong> data (Complete)<br />
• <strong>Data</strong> reviewed<br />
− Commodity flow data (e.g., Transearch, FAF)<br />
− Traffic counts, ITS data, local survey data<br />
• Literature reviewed<br />
− Work with Freight <strong>GPS</strong> data<br />
− NCHRP/NCFRP reports<br />
− Freight-exclusive conference proceedings<br />
− Work within Florida (e.g., disaggregation of FAF)<br />
59
Task 3: Derive Freight Performance Measures for the highway<br />
network in Florida (ongoing, ATRI is the lead)<br />
• Performance measures<br />
− Speeds<br />
− Reliability measures<br />
− Congestion measures<br />
• Geographical, network, and Temporal scope<br />
− Florida’s SIS network<br />
− Peak travel months<br />
− Different time periods of the day<br />
60
Task 4: Derive a truck trip database from the ATRI-FPM data<br />
(ongoing, USF is the lead)<br />
• <strong>GPS</strong> data streams are being converted into “trips”<br />
− Identify trip end locations, determine non-congestion stops,<br />
stops at signals<br />
− Trip start and end times, trip distance, speed, dwell time<br />
• Will result in the following:<br />
− Algorithms to convert the <strong>GPS</strong> data streams to truck trips<br />
− A truck trip database for Florida<br />
Task 5: Analyze the truck trip database<br />
• Analyze the truck trip travel characteristics such as trip<br />
distances, trip travel times, speeds, time of day, dwell time, etc.<br />
61<br />
• Compare the above characteristics to those from available truck<br />
trip data (e.g., survey data)
Task 6: Investigate methods to relate commodity flows with<br />
truck flows<br />
• Develop relationships between commodity flows and truck flows<br />
at an aggregate-level for which both commodity flow and truck<br />
flow data is available<br />
• The above relationships can be used to derive truck flows at a<br />
disaggregate level (using commodity flows at disaggregate level)<br />
• Other methods being reviewed as well<br />
Task 7: Derive a 2010 year truck trip OD table for the Florida<br />
Statewide model<br />
Tasks 8 and 9: Final report, and revisions.<br />
62
Deliverables<br />
• Kick-off meeting<br />
• Quarterly progress reports<br />
• Technical Memorandum-1 (Review of the applications of ATRI data)<br />
• Freight performance measures for FL<br />
• <strong>Truck</strong> trip database for Florida<br />
• <strong>Truck</strong> flow OD table for Florida<br />
• Final research report<br />
• Project closure meeting<br />
63
3<br />
<strong>Truck</strong> ID = i<br />
Initialize x=0<br />
Get record x for truck<br />
ID i from <strong>GPS</strong> database<br />
Is spot<br />
speed = 0?<br />
Y<br />
Flag x as Origin<br />
Initialize tl, tpt, tps, odwt,<br />
ddwt, sdwt, pm and ps<br />
x = x+1<br />
Initialize and<br />
calculate td, trt and<br />
trs between x-1 and x<br />
x = x+1<br />
N<br />
1<br />
<strong>Truck</strong> Trip Origin Destination Identification Variable descriptions: Algorithm<br />
Flag as incomplete trip with x-1 as<br />
destination, Calculate pm=pm-1<br />
Flag as incomplete trip with x-1 as<br />
destination, Calculate pm=pm-1<br />
Flag as complete trip<br />
with x-1 as destination<br />
Flag as complete trip<br />
with x-1 as destination<br />
Y<br />
Y<br />
Is spot<br />
speed = 0?<br />
N<br />
Is spot speed<br />
(x-1) = 0?<br />
N<br />
Y<br />
N<br />
Is spot speed<br />
(x-1) = 0?<br />
1. Trip length (tl) – Total spatial distance traveled <strong>by</strong> the truck between origin and destination<br />
2. Trip time (tpt) – Total time taken to travel from origin to destination<br />
3. Trip speed (tps) – Average speed of truck during the trip (tl/tpt)<br />
4. Travel distance (td) – Spatial distance between two geographic (<strong>GPS</strong>) location records<br />
5. Travel time (trt) – Time difference between two geographic (<strong>GPS</strong>) location records<br />
6. Travel speed (tps) – Average speed of truck between the two <strong>GPS</strong> records (td/trt)<br />
7. Origin dwell time (odwt) – Total time duration of stop at origin i.e. when the truck is not moving<br />
8. Destination dwell time (ddwt) – Total time duration of stop at destination<br />
9. Stop dwell time (sdwt) – Stop duration at traffic stops<br />
10. Total stop dwell time (tsdwt) – Total stop duration at traffic stops<br />
11. Points motion (pm) – Number of <strong>GPS</strong> records skipped when truck is in motion<br />
12. Points stop (ps) – Number of <strong>GPS</strong> records skipped when the truck is not moving or is at a stop<br />
13. Points traffic stops (pts) – Number of <strong>GPS</strong> records skipped when truck is at a traffic stop<br />
Calculate tl=tl+td;<br />
tpt=tpt+trt; tps=tl/tpt<br />
N<br />
Is spot<br />
speed = 0?<br />
Flag as incomplete trip<br />
Y<br />
Next<br />
<strong>Truck</strong> ID<br />
N<br />
Is trt>3 min?<br />
Y<br />
Flag as destination<br />
Is trt>0?<br />
Y<br />
N<br />
Record x is the<br />
last record?<br />
Y<br />
Next<br />
<strong>Truck</strong> ID<br />
Is td>528 ft &<br />
trt>30 min?<br />
Y<br />
N<br />
N<br />
N<br />
Is spot<br />
speed = 0?<br />
Y<br />
Is spot speed<br />
(x-1) = 0?<br />
Y<br />
Is sdwt>3 min?<br />
Y<br />
3<br />
Calculate tl=tl+td;<br />
tpt=tpt+trt; tps=tl/tpt;<br />
sdwt=0; pm=pm+1<br />
N<br />
N<br />
Y<br />
Is trt>3 min?<br />
Y<br />
Is trs>0.2 mph?<br />
N<br />
N<br />
Is trt>3 min?<br />
Y<br />
Is td>528 ft?<br />
Y<br />
N<br />
Y<br />
N<br />
Is tl>0?<br />
N<br />
Is td>528 ft?<br />
N<br />
Y<br />
Is trt>3 min?<br />
N<br />
Calculate sdwt =<br />
sdwt+trt; tsdwt =<br />
tsdwt+trt; pts=pts+1<br />
Y<br />
Is tl>0?<br />
Flag as estimated trip<br />
with x-1 as destination,<br />
Calculate pm=pm-1<br />
2<br />
Y<br />
Calculate tl=tl+td;<br />
tpt=tpt+trt; tps=tl/tpt;<br />
pm=pm+1<br />
3<br />
Is spot speed<br />
(x-1) = 0?<br />
Calculate ddwt=ddwt+trt<br />
1<br />
N<br />
Y<br />
Calculate tpt=tpt-trt;<br />
odwt=odwt+trt<br />
Flag x-1 as origin of next trip<br />
Calculate sdwt =<br />
sdwt+trt; tsdwt =<br />
tsdwt+trt; pts=pts+1<br />
2<br />
N<br />
Calculate tl=tl+td;<br />
tpt=tpt; tps=tl/tpt;<br />
ddwt=ddwt+trt<br />
Calculate tl=tl+td;<br />
tpt=tpt+trt; tps=tl/tpt<br />
Flag x as destination of complete trip<br />
Flag x as origin of next trip<br />
Y<br />
Is trt>3 min?<br />
Calculate sdwt =<br />
sdwt+trt; tsdwt =<br />
tsdwt+trt; pts=pts+1<br />
2<br />
N<br />
Calculate odwt =<br />
odwt+trt; ps=ps+1<br />
3<br />
2<br />
Flag x-1 as destination of complete trip<br />
Flag x-1 as origin of next trip
Trips Extracted from 1 Week <strong>Data</strong> within Florida<br />
Trip length Vs. Trip Duration<br />
Length of trip (in miles)<br />
1 - 3 3 - 5 5 - 10 10 - 15 15 - 20 20 - 30 30 - 50 50 - 70 70 - 100 100 - 150 150 - 200 200 - 300 300 - 400 > 400 Total<br />
1 - 3 17 0 0 0 0 0 0 0 0 0 0 0 0 0 17<br />
3 - 5 732 57 2 0 0 0 0 0 0 0 0 0 0 0 791<br />
5 - 10 2043 389 96 5 0 0 0 0 0 0 0 0 0 0 2533<br />
10 - 15 2088 949 443 36 5 0 0 0 0 0 0 0 0 0 3521<br />
15 - 30 2415 2647 3208 919 307 135 28 0 0 0 0 0 0 0 9659<br />
Duration of the trip (in minutes)<br />
30 - 60 94 1494 3836 2667 1857 1936 917 55 4 0 0 0 0 0 12860<br />
60 - 90 0 0 717 970 1127 2136 2315 705 151 5 0 0 0 0 8126<br />
90 - 120 0 0 61 260 309 840 2071 1085 621 110 0 0 0 0 5357<br />
120 - 180 0 0 0 89 132 363 1333 1494 1323 673 101 4 0 0 5512<br />
180 - 240 0 0 0 0 19 56 172 305 650 856 172 78 0 0 2308<br />
240 - 300 0 0 0 0 0 19 51 62 152 399 144 103 4 0 934<br />
300 - 420 0 0 0 0 0 6 53 48 61 186 127 57 33 0 571<br />
420 - 540 0 0 0 0 0 0 15 18 16 24 10 21 12 3 119<br />
540 - 720 0 0 0 0 0 0 3 37 50 34 4 6 0 0 134<br />
720 - 1440 0 0 0 0 0 0 0 9 29 32 4 4 3 0 81<br />
1440 - 2880 0 0 0 0 0 0 0 0 0 2 0 1 0 0 3<br />
Total 7389 5536 8363 4946 3756 5491 6958 3818 3057 2321 562 274 52 3 52526
Trips Extracted from 1 Week <strong>Data</strong> within & Outside FL<br />
Trip length Vs. Trip Duration<br />
Length of trip (in miles)<br />
1 - 3 3 - 5 5 - 10 10 - 15 15 - 20 20 - 30 30 - 50 50 - 70 70 - 100 100 - 150 150 - 200 200 - 300 300 - 400 > 400 Total<br />
0 - 1 3 0 0 0 0 0 0 0 0 0 0 0 0 0 3<br />
1 - 3 81 10 0 0 0 0 0 0 0 0 0 0 0 0 91<br />
3 - 5 1080 134 21 0 0 0 0 0 0 0 0 0 0 0 1235<br />
5 - 10 3332 643 260 23 0 0 0 0 0 0 0 0 0 0 4258<br />
10 - 15 3540 1586 874 153 38 2 0 0 0 0 0 0 0 0 6193<br />
Duration of the trip (in minutes)<br />
15 - 30 4053 4633 6069 2202 950 635 253 0 0 0 0 0 0 0 18795<br />
30 - 60 174 2496 6986 5277 4057 5017 3213 336 11 0 0 0 0 0 27567<br />
60 - 90 0 0 1386 1987 2321 4445 6098 2810 839 19 0 0 0 0 19905<br />
90 - 120 0 0 130 545 671 1771 4566 3231 2697 775 3 0 0 0 14389<br />
120 - 180 0 0 0 190 333 848 3235 4119 4643 4362 1013 42 0 0 18785<br />
180 - 240 0 0 0 0 65 194 592 1048 2376 3469 1937 1086 1 0 10768<br />
240 - 300 0 0 0 0 0 71 174 247 739 1891 1315 1702 150 1 6290<br />
300 - 420 0 0 0 0 0 22 167 157 341 999 1191 1440 926 179 5422<br />
420 - 540 0 0 0 0 0 0 53 94 108 168 204 493 340 416 1876<br />
540 - 720 0 0 0 0 0 0 9 146 162 194 92 170 115 269 1157<br />
720 - 1440 0 0 0 0 0 0 0 14 111 161 100 119 55 69 629<br />
1440 -<br />
2880<br />
0 0 0 0 0 0 0 0 0 5 1 5 4 0 15<br />
Total 12263 9502 15726 10377 8435 13005 18360 12202 12027 12043 5856 5057 1591 934 137378