NHTS Update by Krishnan Viswanathan - FSUTMSOnline
NHTS Update by Krishnan Viswanathan - FSUTMSOnline
NHTS Update by Krishnan Viswanathan - FSUTMSOnline

You also want an ePaper? Increase the reach of your titles
YUMPU automatically turns print PDFs into web optimized ePapers that Google loves.
<strong>NHTS</strong> Data <strong>Update</strong><br />
presented to<br />
MTF Data Committee<br />
presented <strong>by</strong><br />
Frank Tabatabaee, Florida DOT<br />
<strong>Krishnan</strong> <strong>Viswanathan</strong>, Cambridge Systematics, Inc.<br />
May 25 2010
Presentation Outline<br />
<strong>NHTS</strong> Background<br />
Sampling Plan<br />
Final Florida Sample<br />
Structure of Data Files<br />
Summary Statistics<br />
Data Distribution<br />
1
<strong>NHTS</strong> Background<br />
Data used to:<br />
• Quantify travel behavior<br />
• Analyze changes in travel characteristics over time<br />
• Relate travel behavior to the demographics of the traveler<br />
• Study the relationship of demographics and travel over<br />
time<br />
Data items not included<br />
• Travel costs<br />
• Information on specific routes<br />
• Longitudinal information<br />
• Reasons for specific mode<br />
2
Sampling Plan<br />
Region<br />
Sample Size<br />
Region 1 1,200<br />
Region 2 1,224<br />
Region 3 1,200<br />
Region 4 4,116<br />
Region 5 2,000<br />
Region 7 2,250<br />
Region 8 2,000<br />
3
Sampling Plan<br />
Rural Counties<br />
FDOT<br />
District Total Households Sample Size<br />
Confidence<br />
Interval (95%<br />
CL)<br />
1 83,828 453 ± 4.6%<br />
2 125,436 678 ± 3.8%<br />
3 51,894 280 ± 5.9%<br />
5 21,284 115 ± 9.2%<br />
6 35,106 190 ± 7.1%<br />
7 52,661 284 ± 5.8%<br />
Rural Total 370,209 2,000 ± 2.2%<br />
4
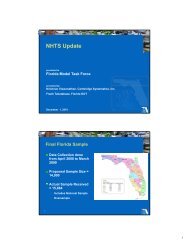
Final Florida Sample<br />
Data Collection done<br />
from April 2008 to March<br />
2009<br />
Proposed Sample Size =<br />
14,000<br />
Actual Sample Received<br />
= 15,884<br />
• Includes National Sample<br />
• Oversample<br />
5
Typical <strong>NHTS</strong> Household<br />
Amy and Keith live in a metropolitan area with their two children Lucy and<br />
Ben. When Keith picked up their mail in early March 2008, he noticed an<br />
envelope from the US Department of Transportation. On opening the<br />
envelope, he found that it contained a letter from the Department of<br />
Transportation with a five-dollar cash incentive, and a brochure describing the<br />
<strong>NHTS</strong>. The letter informed Keith that their home telephone number had been<br />
selected in the sample for the National Household Travel Survey, and that<br />
they would be receiving a telephone call from an interviewer. Several days<br />
later, the household was contacted <strong>by</strong> telephone <strong>by</strong> an <strong>NHTS</strong> interviewer and<br />
participated in the survey.<br />
6
Structure of Data Files<br />
Data File<br />
Households<br />
Persons<br />
Travel Day Trips<br />
Vehicle<br />
Information<br />
Included<br />
Data unique to a<br />
household, or<br />
questions<br />
asked once for each<br />
sample household.<br />
Data determined<br />
once for each<br />
completed<br />
person interview.<br />
Data about each trip<br />
the person made on<br />
the household’s<br />
randomly-assigned<br />
travel day.<br />
Data relating to each<br />
of the household’s<br />
vehicles.<br />
Record<br />
Level<br />
One record<br />
per<br />
household<br />
One record<br />
per<br />
person<br />
One record<br />
per travel<br />
day person<br />
trip<br />
One record<br />
per vehicle<br />
ID Variable<br />
HOUSEID<br />
HOUSEID,<br />
PERSONID<br />
HOUSEID,<br />
PERSONID,<br />
TDTRPNUM<br />
HOUSEID,<br />
VEHID<br />
Weight<br />
Variable<br />
WTHHFIN<br />
WTPERFIN<br />
SFWGT (for<br />
school children<br />
between 6 to 12)<br />
WTTRDFIN<br />
WTHHFIN<br />
7
Data Weighting<br />
Weights are needed to produce valid population-level<br />
estimates<br />
The weights include a correction for the probability of<br />
selection based on your sample plan in addition to a<br />
non-response adjustment to reduce sampling error and<br />
bias<br />
To weight a variable, simply multiply the record <strong>by</strong> its<br />
weight.<br />
For school children aged 6-12 in the Person File use<br />
SFWGT<br />
8
Control Totals<br />
9<br />
Unweighted<br />
(Sample) Weighted (Population)<br />
Household Count 15,884 7,088,960<br />
Count of Household vehicles 29,290 13,071,128<br />
Person Count 30,952 17,107,577<br />
Retired 11,217 3,140,866<br />
Workers 12,191 8,293,260<br />
Drivers 25,758 13,064,424<br />
Adults 27,486 14,188,908<br />
Person Miles Traveled 1,090,572.52 208,828,167,053.99 ‡<br />
Vehicle Miles Traveled 661,765.98 127,614,445,243.54 ‡<br />
Vehicle Trips 73,830 13,926,854,274 ‡<br />
Person Trips 114,910 22,810,650,886 ‡<br />
Person Per Household 1.95 2.41<br />
Workers Per Household 0.77 1.17<br />
Driver Per Household 1.62 1.84<br />
Workers Per Adult 0.44 0.58<br />
Drivers Per Adult 0.94 0.92<br />
Vehicles Per Household 1.84 1.84<br />
Vehicles Per Driver 1.14 1<br />
Vehicles Per Worker 2.4 1.58<br />
‡ Annualized (not appropriate for analysis of typical weekday conditions)
Household Size Distribution<br />
45.00%<br />
40.00%<br />
35.00%<br />
2009 <strong>NHTS</strong> (Weighted) and Census 2000<br />
Florida Household Size Distribution<br />
2008-2009 <strong>NHTS</strong> Weighted<br />
Census 2000*<br />
30.00%<br />
25.00%<br />
20.00%<br />
15.00%<br />
10.00%<br />
5.00%<br />
10<br />
0.00%<br />
1 2 3 4 5 6 7 or More<br />
Household Size
Trip Purpose Distribution<br />
50%<br />
45%<br />
40%<br />
35%<br />
30%<br />
30.70%<br />
25%<br />
24.20%<br />
20%<br />
19.80%<br />
15%<br />
15.40%<br />
10%<br />
10.00%<br />
5%<br />
11<br />
0%<br />
HBO HBSHOP HBSOCREC HBW NHB
Household Size <strong>by</strong> Vehicles Distribution<br />
Count of Household Vehicles<br />
Household Size 0 1 2 3+<br />
1 4.2% 16.1% 2.1% 0.6%<br />
2 1.8% 11.1% 21.7% 7.1%<br />
3 0.3% 2.4% 6.3% 5.9%<br />
4+ 0.5% 2.4% 10.1% 7.5%<br />
12
Average Trip Distribution<br />
Average Trip<br />
Trip Purpose Length (miles)<br />
Home Based Work 12.3<br />
Home Based Shop 6.3<br />
Home Based<br />
Social/Recreation 9.7<br />
Home Based<br />
Other 9.1<br />
Non-Home Based 12.5<br />
13
14<br />
Average Trip Distribution<br />
Home<br />
Based<br />
Work<br />
Home Based<br />
Social /<br />
Recreation<br />
Home Based<br />
Home Based Non-Home<br />
Trip Distance<br />
Shop<br />
Other Based<br />
Less than 10 miles 76.3% 84.1% 76.8% 53.7% 77.3%<br />
10 and 20 miles 14.9% 10.6% 12.1% 27.1% 12.7%<br />
20 and 30 miles 4.7% 2.7% 5.1% 11.0% 4.4%<br />
30 and 40 miles 1.7% 1.0% 2.5% 4.6% 1.9%<br />
40 and 50 miles 0.8% 0.7% 1.0% 1.8% 0.8%<br />
SUBTOTAL 98.5% 99.1% 97.6% 98.2% 97.2%<br />
50 and 60 miles 0.5% 0.2% 0.4% 0.8% 0.6%<br />
60 and 70 miles 0.2% 0.2% 0.5% 0.4% 0.3%<br />
70 and 80 miles 0.1% 0.1% 0.2% 0.3% 0.2%<br />
80 and 90 miles 0.1% 0.1% 0.2% 0.1% 0.3%<br />
90 and 100 miles 0.1% 0.1% 0.2% 0.1% 0.1%<br />
100 and 110 miles 0.1% 0.1% 0.1% 0.1%<br />
110 and 120 miles 0.0% 0.0% 0.1% 0.0% 0.1%<br />
120 and 130 miles 0.0% 0.0% 0.1% 0.1%<br />
130 and 140 miles 0.0% 0.0% 0.1% 0.0% 0.1%<br />
140 and 150 miles 0.0% 0.0% 0.1% 0.1%<br />
150 and 160 miles 0.0% 0.0% 0.0% 0.0% 0.0%<br />
160 and 170 miles 0.0% 0.0% 0.0% 0.0%<br />
170 and 180 miles 0.0% 0.0% 0.1% 0.0%<br />
180 and 190 miles 0.0% 0.0% 0.0% 0.0%<br />
190 and 200 miles 0.0% 0.0% 0.0% 0.0%<br />
More than 200 Miles 0.1% 0.1% 0.3% 0.0% 0.6%<br />
Total 100.0% 100.0% 100.0% 100.0% 100.0%
Average Vehicle Occupancy<br />
Average Vehicle<br />
Trip Purpose<br />
Occupancy<br />
Home Based Work 1.07<br />
Home Based Shop 1.48<br />
Home Based Social/Recreation 1.59<br />
Home Based Other 1.60<br />
Non-Home Based 1.57<br />
Not Ascertained 1.80<br />
15
Mode Shares<br />
Mode Person Worker<br />
Drive Alone 39.5% 51.1%<br />
Shared Ride 2 24.2% 20.6%<br />
Shared Ride 3+ 20.8% 16.4%<br />
Transit 1.3% 1.0%<br />
Walk and Bike 1.5% 0.9%<br />
Other Means 12.7% 10.1%<br />
16
Data Distribution<br />
License Agreement needs to signed<br />
• Promise of privacy to participants<br />
Frank Tabatabaee – Point of Contact for Data related<br />
issues<br />
Once signed agreement is received, Data CD shipped<br />
out<br />
00_README_FIRST.txt<br />
• Layouts CD structure<br />
17
18<br />
CD Contents
19<br />
License Agreement
Next Steps…<br />
Develop guidelines for data analysis<br />
How to generate FSUTMS parameters<br />
Potential web-based training<br />
Training and user guide from FHWA forthcoming<br />
20
Contact Information<br />
Frank Tabatabaee<br />
• Frank.Tabatabaee@dot.state.fl.us<br />
• 850-414-4931<br />
21