A Practical Guide to SPM
A Practical Guide to SPM
A Practical Guide to SPM

You also want an ePaper? Increase the reach of your titles
YUMPU automatically turns print PDFs into web optimized ePapers that Google loves.
22<br />
Position<br />
Retracting<br />
Extending<br />
Voltage<br />
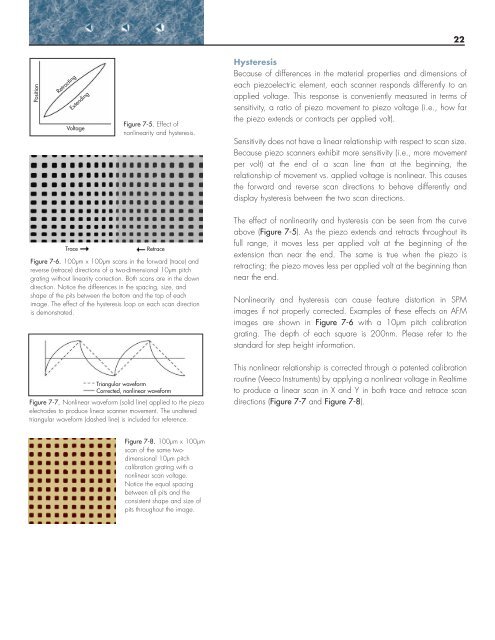
Figure 7-5. Effect of<br />
nonlinearity and hysteresis.<br />
Hysteresis<br />
Because of differences in the material properties and dimensions of<br />
each piezoelectric element, each scanner responds differently <strong>to</strong> an<br />
applied voltage. This response is conveniently measured in terms of<br />
sensitivity, a ratio of piezo movement <strong>to</strong> piezo voltage (i.e., how far<br />
the piezo extends or contracts per applied volt).<br />
Sensitivity does not have a linear relationship with respect <strong>to</strong> scan size.<br />
Because piezo scanners exhibit more sensitivity (i.e., more movement<br />
per volt) at the end of a scan line than at the beginning, the<br />
relationship of movement vs. applied voltage is nonlinear. This causes<br />
the forward and reverse scan directions <strong>to</strong> behave differently and<br />
display hysteresis between the two scan directions.<br />
Trace<br />
Retrace<br />
Figure 7-6. 100µm x 100µm scans in the forward (trace) and<br />
reverse (retrace) directions of a two-dimensional 10µm pitch<br />
grating without linearity correction. Both scans are in the down<br />
direction. Notice the differences in the spacing, size, and<br />
shape of the pits between the bot<strong>to</strong>m and the <strong>to</strong>p of each<br />
image. The effect of the hysteresis loop on each scan direction<br />
is demonstrated.<br />
Triangular waveform<br />
Corrected, nonlinear waveform<br />
Figure 7-7. Nonlinear waveform (solid line) applied <strong>to</strong> the piezo<br />
electrodes <strong>to</strong> produce linear scanner movement. The unaltered<br />
triangular waveform (dashed line) is included for reference.<br />
The effect of nonlinearity and hysteresis can be seen from the curve<br />
above (Figure 7-5). As the piezo extends and retracts throughout its<br />
full range, it moves less per applied volt at the beginning of the<br />
extension than near the end. The same is true when the piezo is<br />
retracting: the piezo moves less per applied volt at the beginning than<br />
near the end.<br />
Nonlinearity and hysteresis can cause feature dis<strong>to</strong>rtion in <strong>SPM</strong><br />
images if not properly corrected. Examples of these effects on AFM<br />
images are shown in Figure 7-6 with a 10µm pitch calibration<br />
grating. The depth of each square is 200nm. Please refer <strong>to</strong> the<br />
standard for step height information.<br />
This nonlinear relationship is corrected through a patented calibration<br />
routine (Veeco Instruments) by applying a nonlinear voltage in Realtime<br />
<strong>to</strong> produce a linear scan in X and Y in both trace and retrace scan<br />
directions (Figure 7-7 and Figure 7-8).<br />
Figure 7-8. 100µm x 100µm<br />
scan of the same twodimensional<br />
10µm pitch<br />
calibration grating with a<br />
nonlinear scan voltage.<br />
Notice the equal spacing<br />
between all pits and the<br />
consistent shape and size of<br />
pits throughout the image.