A Practical Guide to SPM
A Practical Guide to SPM
A Practical Guide to SPM

You also want an ePaper? Increase the reach of your titles
YUMPU automatically turns print PDFs into web optimized ePapers that Google loves.
15<br />
potential on the surface is different from the potential of the tip. The<br />
force is nullified by varying the voltage of the tip so that the tip is at<br />
the same potential as the region of the sample surface underneath it.<br />
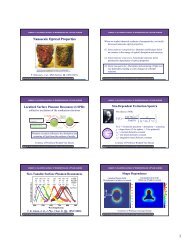
SP imaging can be used <strong>to</strong> detect and quantify contact potential<br />
differences (CPD) on the surface. SP imaging has found numerous<br />
applications, including corrosion science.<br />
Cantilever amplitude variation due <strong>to</strong> force modulation<br />
Compliant region<br />
Stiff region<br />
Figure 5-9. Force modulation imaging. The amplitude of<br />
cantilever oscillation varies according <strong>to</strong> the mechanical<br />
properties of the sample surface.<br />
Sample<br />
Figure 5-10. Contact AFM (left) and force modulation (right)<br />
images of a carbon fiber/polymer composite collected<br />
simultaneously, 5µm scans.<br />
Force Modulation Imaging<br />
Force modulation imaging is a secondary imaging mode derived from<br />
contact AFM that measures relative elasticity/stiffness of surface<br />
features. It is commonly used <strong>to</strong> map the distribution of materials of<br />
composite systems. As with LFM and MFM, force modulation imaging<br />
allows simultaneous acquisition of both <strong>to</strong>pographic and materialproperties<br />
maps.<br />
In force modulation imaging mode, the probe tip tracks the sample<br />
<strong>to</strong>pography as in normal contact AFM. In addition, a periodic<br />
mechanical signal, typically less than 5 kHz, is applied <strong>to</strong> the base of<br />
the cantilever. The amplitude of cantilever modulation that results from<br />
this applied signal varies according <strong>to</strong> the elastic properties of the<br />
sample, as shown in Figure 5-9.<br />
The resulting force modulation image is a map of the sample's elastic<br />
response. The frequency of the applied signal is typically tens of<br />
kilohertz, which is faster than the Z feedback loop is set up <strong>to</strong> track.<br />
Thus, <strong>to</strong>pographic information can be separated from local variations<br />
in the sample's elastic properties and the two types of images can be<br />
collected simultaneously, as shown in Figure 5-10.<br />
Scanning Capacitance Microscopy<br />
Scanning capacitance microscopy (SCM) is a secondary imaging<br />
mode derived from contact AFM. SCM maps variations in majority<br />
electrical carrier concentration (electrons or holes) across the sample<br />
surface (typically a doped semiconduc<strong>to</strong>r). SCM applies a highfrequency<br />
(90 kHz) AC bias <strong>to</strong> the sample and uses an ultra-highfrequency<br />
(1 GHz) detec<strong>to</strong>r <strong>to</strong> measure local tip-sample capacitance<br />
changes as the tip scans across the sample surface. These<br />
capacitance changes are a function of the majority carrier<br />
concentration in semiconduc<strong>to</strong>rs; hence, relative carrier concentration<br />
can be mapped in the range of 10 16 –10 21 cm -3 .<br />
Applications include two-dimensional profiling of dopants in<br />
semiconduc<strong>to</strong>r process evaluation and failure analysis.