A Practical Guide to SPM
A Practical Guide to SPM
A Practical Guide to SPM

You also want an ePaper? Increase the reach of your titles
YUMPU automatically turns print PDFs into web optimized ePapers that Google loves.
12<br />
V. Secondary AFM<br />
Imaging Modes<br />
AFM tip<br />
Laser beam<br />
Fast direction<br />
of raster scan<br />
To detec<strong>to</strong>r<br />
Cantilever twist<br />
The imaging modes described below are derived from the four<br />
primary AFM imaging modes discussed in the previous chapter.<br />
Lateral Force Microscopy<br />
Lateral force microscopy (LFM) is a contact AFM mode that identifies<br />
and maps relative differences in the friction forces between the probe<br />
tip and the sample surface. In LFM, the scanning is always<br />
perpendicular <strong>to</strong> the long axis of the cantilever. Forces on the<br />
cantilever that are parallel <strong>to</strong> the plane of the sample surface cause<br />
twisting of the cantilever around its long axis. This twisting is measured<br />
by a quad-cell PSPD, as with TRmode.<br />
Horizontal<br />
deflection<br />
= Higher frictional areas<br />
Figure 5-1. Lateral force microscopy.<br />
Trace<br />
Retrace<br />
Twisting of the cantilever usually arises from two sources: changes in<br />
surface friction and changes in <strong>to</strong>pography, as shown in Figure 5-1.<br />
In the first case, the tip may experience greater friction as it traverses<br />
some areas, causing the cantilever <strong>to</strong> twist more. In the second case,<br />
the cantilever may twist when it encounters edges of <strong>to</strong>pographic<br />
features. To separate one effect from the other, usually three signals are<br />
collected simultaneously: both trace and retrace LFM signals, along<br />
with either the trace or retrace AFM signal.<br />
LFM applications include identifying transitions between different<br />
components in polymer blends and composites, identifying<br />
contaminants on surfaces, delineating coverage by coatings, and<br />
chemical force microscopy (CFM) using probe tips functionalized for<br />
specific chemical species.<br />
<br />
Figure 5-2. Phase imaging.<br />
Detec<strong>to</strong>r signal<br />
Drive signal<br />
<br />
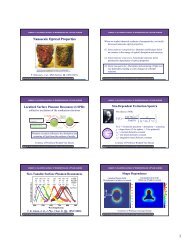
Phase Imaging<br />
Phase imaging is the mapping of the measure phase of the cantilever’s<br />
periodic oscillations, relative <strong>to</strong> the phase of the periodic signal that<br />
drives the cantilever. Changes in this measured phase often<br />
correspond <strong>to</strong> changes in the properties across the sample surface<br />
(Figure 5-2).<br />
Phase imaging is a secondary imaging mode derived from<br />
TappingMode or non-contact mode that goes beyond <strong>to</strong>pographic<br />
data <strong>to</strong> detect variations in composition, adhesion, friction,<br />
viscoelasticity, and other properties, including electric and magnetic.<br />
Applications include locating contaminants, mapping different<br />
components in composite materials, and differentiating regions of high<br />
and low surface adhesion or hardness as well as regions of different<br />
electrical or magnetic properties.<br />
The AFM's feedback loop operates in the usual manner, using changes<br />
in the cantilever's oscillation amplitude <strong>to</strong> map sample <strong>to</strong>pography.<br />
The phase is moni<strong>to</strong>red while the <strong>to</strong>pographic image is being taken<br />
so that images of <strong>to</strong>pography and phase (material properties) can be<br />
collected simultaneously.