Exercise 4: Introduction to IDRISI
Exercise 4: Introduction to IDRISI
Exercise 4: Introduction to IDRISI

You also want an ePaper? Increase the reach of your titles
YUMPU automatically turns print PDFs into web optimized ePapers that Google loves.
1N1663 Spatial Planning with GIS Period 3 Division of Geoinformatics<br />
<strong>Exercise</strong> 4: <strong>Introduction</strong> <strong>to</strong> <strong>IDRISI</strong><br />
1. INTRODUCTION TO <strong>IDRISI</strong><br />
Recommended readings:<br />
P:\WIN\Idrisi32\Documentation\Guide1.pdf<br />
• <strong>Introduction</strong> <strong>to</strong> GIS: p 5-16.<br />
• Idrisi system overview: p 35-37, p 41-42, p 44-55.<br />
2. <strong>IDRISI</strong> SYSTEM OVERVIEW<br />
The aim:<br />
1. Aquire knowledge about the program interface;<br />
2. Aquire knowledge about metadata (data that is used <strong>to</strong> describe other data) from the map<br />
layer data files; and<br />
3. Aquire knowledge about the program files.<br />
2.1. Start <strong>IDRISI</strong>:<br />
Start/ programs/L/Idrisi32<br />
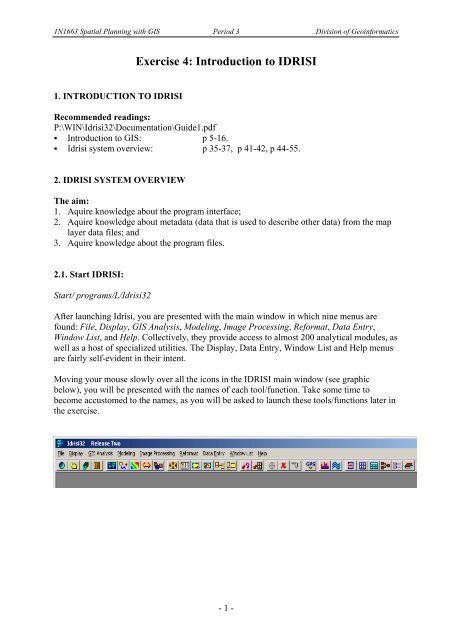
After launching Idrisi, you are presented with the main window in which nine menus are<br />
found: File, Display, GIS Analysis, Modeling, Image Processing, Reformat, Data Entry,<br />
Window List, and Help. Collectively, they provide access <strong>to</strong> almost 200 analytical modules, as<br />
well as a host of specialized utilities. The Display, Data Entry, Window List and Help menus<br />
are fairly self-evident in their intent.<br />
Moving your mouse slowly over all the icons in the <strong>IDRISI</strong> main window (see graphic<br />
below), you will be presented with the names of each <strong>to</strong>ol/function. Take some time <strong>to</strong><br />
become accus<strong>to</strong>med <strong>to</strong> the names, as you will be asked <strong>to</strong> launch these <strong>to</strong>ols/functions later in<br />
the exercise.<br />
- 1 -
1N1663 Spatial Planning with GIS Period 3 Division of Geoinformatics<br />
a. Management<br />
• Use the Windows Explorer <strong>to</strong> create a main working folder in your home<br />
direc<strong>to</strong>ry on the H: drive (for instance: “H:\Idrisi\Working_folder”<br />
• Create a path in Idrisi <strong>to</strong> the main working folder by choosing File/Data Paths in<br />
Idrisi<br />
• Extract the files in the zipfile : G:\KURSER\Geoinfo\1N1663\Intro<strong>IDRISI</strong>.zip <strong>to</strong><br />
your working folder.<br />
2.2 Displaying Map layers<br />
Since the earliest days of au<strong>to</strong>mated car<strong>to</strong>graphy and GIS, map layers have been digitally<br />
encoded according <strong>to</strong> two fundamentally different logics—raster and vec<strong>to</strong>r. Click on the<br />
DISPLAY icon on the <strong>to</strong>ol bar. Note that separate options are included for raster and vec<strong>to</strong>r<br />
layers, as well as a map composition option and palette files. Select raster layers and double<br />
click in the white area <strong>to</strong> load your image (Display/Display launcher/ Raster<br />
layer/westluse.rst) – leave all other options as default.<br />
Double click<br />
here <strong>to</strong> load<br />
an image<br />
2.2.1 Now select the Cursor Inquiry Mode icon on the <strong>to</strong>olbar (the one with the question mark<br />
and arrow). When you move the cursor in<strong>to</strong> the map display, notice that it changes <strong>to</strong> a crosshair.<br />
Click on different polygons in the map.<br />
2.2.2 Then click on the Feature Properties but<strong>to</strong>n in the Composer – see diagran below (or on<br />
the Feature Properties <strong>to</strong>ol bar icon <strong>to</strong> the immediate right of the Cursor Inquiry Mode icon)-,<br />
and continue <strong>to</strong> click on polygons. Note the information presented in the Feature Properties<br />
box that opens below Composer.<br />
- 2 -
1N1663 Spatial Planning with GIS Period 3 Division of Geoinformatics<br />
Feature<br />
properties in<br />
the Composer<br />
2.2.3 Click on the Add Layer but<strong>to</strong>n in the Composer. This dialog is a modified version of<br />
Display Launcher with options <strong>to</strong> add either an additional raster or vec<strong>to</strong>r layer <strong>to</strong> the current<br />
composition. Any number of layers can be added in this way. In this instance,<br />
select the vec<strong>to</strong>r layer option and choose westroad.vct. (You can switch on and off layers by<br />
clicking <strong>to</strong> the left of the file name in the Composer.)<br />
2.2.4 It is possible <strong>to</strong> change the position of the layers by dragging and dropping a layer. The<br />
order of displaying layers in <strong>IDRISI</strong> is the opposite <strong>to</strong> ArcGIS. A layer at the bot<strong>to</strong>m of the<br />
list in the Composer will appear on <strong>to</strong>p in the map. Make sure that your vec<strong>to</strong>r layer,<br />
westroad.vct, is “below” your raster layer in the Composer.<br />
2.2.4 Select the westluse layer in Composer. Then click on the Layer Properties but<strong>to</strong>n. Layer<br />
Properties, as the name suggests, displays some important details about the selected<br />
(highlighted) layer, including the palette or symbol file in use. Have a look at the properties<br />
and then close the windows by using: Window list/ Close all windows (This will close ALL<br />
windows open in <strong>IDRISI</strong>).<br />
2.3 Examining and managing your <strong>IDRISI</strong> data files.<br />
Launch the <strong>IDRISI</strong> File Explorer (either by clicking on the icon or by selecting File/ Idrisi<br />
File Explorer). The <strong>IDRISI</strong> File Explorer is a general purpose utility for listing, examining<br />
and managing your <strong>IDRISI</strong> data files. The left-hand panel lists all of the various file types that<br />
are used in <strong>IDRISI</strong>, while the right-hand panel is used <strong>to</strong> select a specific file. When you open<br />
Idrisi File Explorer, it au<strong>to</strong>matically lists the files in your working folder. However, the drop-<br />
- 3 -
1N1663 Spatial Planning with GIS Period 3 Division of Geoinformatics<br />
down list box <strong>to</strong> the upper-right can be used <strong>to</strong> select any of your resource folders or selected<br />
system folders.<br />
Highlight the westluse layer by clicking on its entry in the right-hand panel. Notice that the<br />
name is listed as "westluse.rst". This is the actual data file for this raster image, which has an<br />
".rst" file extension. Notice, however, that the panel on the left indicates that operations on<br />
these files also involve a second file with an ".rdc" extension. The ".rdc" file is its<br />
accompanying metadata file. The term metadata means "data about data", i.e., documentation<br />
(which explains the "rdc" extension—it stands for "raster documentation").<br />
2.3.1 Now with westluse highlighted, click on the View Structure but<strong>to</strong>n. This shows the<br />
actual data values behind the upper left-most portion (8 columns and 16 rows) of the raster<br />
image. Each of these numbers represents a land use type, and is symbolized by the<br />
corresponding palette entry. For example, cells with a number 3 indicate forested land and are<br />
symbolized with the third color in the westluse palette. Use the arrow keys <strong>to</strong> move around<br />
the image. Then exit from the View Structure dialog.<br />
2.3.2 Making sure that the westluse raster layer is still highlighted in <strong>IDRISI</strong> File Explorer,<br />
click on the View Metadata but<strong>to</strong>n. This but<strong>to</strong>n accesses the Metadata module (also accessible<br />
from the File menu or the fourth icon on the <strong>to</strong>ol bar) which shows us the contents of the<br />
"westluse.rdc" file. This file contains the fundamental information that allows the file <strong>to</strong> be<br />
displayed as a raster image and <strong>to</strong> be registered with other map data (i.e. georeferenced).<br />
The file type is specified as binary (A data file format in which numbers are s<strong>to</strong>red in binary<br />
representation. In <strong>IDRISI</strong>, binary files require 1 byte/number for integer data, and 4<br />
bytes/number for real data. Binary files are more efficient than ASCII files for s<strong>to</strong>ring<br />
numeric data.). <strong>IDRISI</strong> also provides the ability <strong>to</strong> convert raster images <strong>to</strong> an ASCII format,<br />
although this format is only used <strong>to</strong> facilitate import and export.<br />
The data type is byte. This is a special sub-type of integer. Integer numbers have no fractional<br />
parts, increasing only by whole number steps. The byte data type includes only the positive<br />
integers between 0 and 255. In contrast, files designated as having an integer data type can<br />
contain any whole numbers from -32768 <strong>to</strong> + 32767. The reason that they both exist is that<br />
byte files only require one byte per cell whereas integer files require 2. Thus, if only a limited<br />
integer range is required (as in the case of westluse which has 13 classes), use of the byte data<br />
type can halve the amount of computer s<strong>to</strong>rage space required. Raster files can also be s<strong>to</strong>red<br />
as real numbers, requiring 4 bytes of s<strong>to</strong>rage for each number.<br />
The columns and rows indicate the basic raster structure. Note that you cannot change this<br />
structure by simply changing these values. Entries in a documentation file simply describe<br />
what exists. Changing the structure of a file requires the use of special procedures (which are<br />
extensively provided within <strong>IDRISI</strong>).<br />
The seven fields related <strong>to</strong> the reference system indicate where the image exists in space. The<br />
Georeferencing chapter in the <strong>IDRISI</strong> Guide <strong>to</strong> GIS and Image Processing Volume 1 gives<br />
extensive details on these entries. However, for now, simply recognize that the reference<br />
system is typically the name of a special reference system parameter file (called a REF file in<br />
<strong>IDRISI</strong>) that is s<strong>to</strong>red in the GEOREF sub-folder of the <strong>IDRISI</strong> program direc<strong>to</strong>ry. Reference<br />
units can be meters, feet, kilometers, miles, degrees or radians (abbreviated m, ft, km, mi, deg,<br />
rad). The unit distance multiplier is used <strong>to</strong> accommodate units of other types (e.g., minutes).<br />
- 4 -
1N1663 Spatial Planning with GIS Period 3 Division of Geoinformatics<br />
Thus, if the units are one of the six recognized unit types, the unit distance will always be 1.0.<br />
With other types, the value will be something other than 1. For example, units can be<br />
expressed in yards if one sets the units <strong>to</strong> feet and the unit distance <strong>to</strong> 3.<br />
The positional error indicates how close the actual location of a feature is <strong>to</strong> its mapped<br />
position. This is often unknown and may be left blank or may read unknown.<br />
The resolution field indicates the size of each pixel (in X) in reference units. It may also be<br />
left blank or may read unknown. Both the positional error and resoltuion fields are<br />
informational only (i.e., are not used analytically).<br />
The minimum and maximum value fields express the lowest and highest values that occur in<br />
any cell, while the display minimum and display maximum express the limits that are used for<br />
scaling (see below). Commonly, the display minimum and display maximum values are the<br />
same as the minimum and maximum values.<br />
The value units field indicates the unit of measure used for the attributes while the value error<br />
field indicates either an RMS value for quantitative data or a proportional error value for<br />
qualitative data.<br />
The value error field can also contain the name of an error map. Both fields may be left blank<br />
or read unknown. They are used analytically by only a few modules.<br />
A data flag is any special value. Some <strong>IDRISI</strong> modules recognize the data flags background<br />
or missing data as indicating non-data.<br />
2.3.3 Now click on the Legend tab. This contains interpretations for each of the land use<br />
categories. Clearly it was this information that was used <strong>to</strong> construct the legend for this layer.<br />
You can now close Metadata.<br />
2.4 Symbol Workshop for Palettes<br />
Now open Symbol Workshop: Palettes <strong>to</strong> examine a palette named westluse.smp (Display/<br />
Symbol Workshop). Symbol Workshop is used for creating and editing <strong>IDRISI</strong> symbol and<br />
palette files. These files record the graphic renditions for up <strong>to</strong> 256 symbols. From the Symbol<br />
Workshop’s File menu, you can open an existing palette file. In this case, open westluse.smp.<br />
(Hint: You will need <strong>to</strong> check the Palette option)<br />
Select Palette<br />
before opeing<br />
westluse.smp<br />
- 5 -
1N1663 Spatial Planning with GIS Period 3 Division of Geoinformatics<br />
The 256 symbols are displayed in a 16 x 16 grid. To edit a symbol, double click the particular<br />
symbol grid cell. The index number of the symbol (0-255) will appear as you move the cursor<br />
over each grid cell. Each number in the grid corresponds <strong>to</strong> the numbers (values) in the legend<br />
(Load westluse.rst using Display, and <strong>IDRISI</strong> File Explorer <strong>to</strong> compare the legend for<br />
westluse.rst).<br />
Experiment by changing some of the colours in the palette. When you are finished, save your<br />
new palette with a different name. Display westluse.rst with your newly created palette file<br />
(Hint: Use Layers properties from the Composer <strong>to</strong> apply your new palette).<br />
3. MAP COMPILATION<br />
Using what you have learnt above, make a map of Wesboro in which include land use and<br />
roads. The map should contain the following items:<br />
• Legend for land use;<br />
• Legend for roads (you should create your own legend palette for roads as there are<br />
three levels of roads – assign appropriate colours);<br />
• Scale bar;<br />
• North arrow;<br />
• Your names (using Text Insert from Map Properties)<br />
The Map Properties box can be used <strong>to</strong> for inserting scale bars, north arrows, text, etc. It is<br />
accessed from the Composer.<br />
- 6 -
1N1663 Spatial Planning with GIS Period 3 Division of Geoinformatics<br />
You should also provide a brief definition for the abbreviations listed below: (Hint: Use the<br />
Help menu)<br />
.rst<br />
.rdc<br />
.vct<br />
.vdc<br />
.rcl<br />
.avl<br />
.adc<br />
.mdb<br />
.map<br />
.smp<br />
.iml<br />
.imm<br />
.exp<br />
Once you have finished making the map and defining the abbreviations, you need <strong>to</strong><br />
show Duncan the completed map on the computer screen and you should also submit a<br />
print-out of the map <strong>to</strong>gether with the answers <strong>to</strong> above abbreviations. A full report is<br />
not required for this exercise.<br />
- 7 -