Basic Radar Signal Processing
Basic Radar Signal Processing
Basic Radar Signal Processing
Create successful ePaper yourself
Turn your PDF publications into a flip-book with our unique Google optimized e-Paper software.
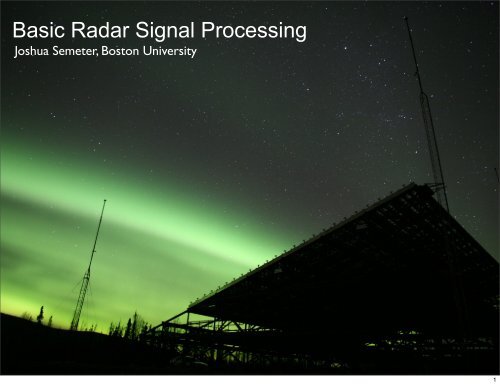
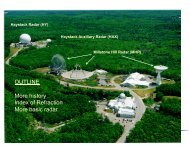
<strong>Basic</strong> <strong>Radar</strong> <strong>Signal</strong> <strong>Processing</strong><br />
Joshua Semeter, Boston University<br />
1
Why study ISR?<br />
• You get to learn about many useful things, in<br />
substantial depth.<br />
- Plasma physics<br />
- <strong>Radar</strong><br />
- Coding<br />
- Electronics (Power, RF, DSP)<br />
- <strong>Signal</strong> <strong>Processing</strong><br />
• But what if I probably won’t stay in this field?<br />
- See above!<br />
2
Outline<br />
• Principle of Pulsed Doppler <strong>Radar</strong><br />
•<br />
•<br />
The Doppler spectrum of the ionospheric plasma<br />
Mathematics of Doppler <strong>Processing</strong><br />
• Pulse Compression 3
The Ubiquitous deciBel<br />
The relative value of two things, measured on a logarithmic scale, is often<br />
expressed in deciBel’s (dB)<br />
Example: SNR<br />
<strong>Signal</strong>-to-noise ratio (dB) = 10 log 10<br />
<strong>Signal</strong> Power<br />
Noise Power<br />
Scientific<br />
Factor of: Notation dB<br />
0.1 10 -1 -10<br />
0.5 10 0.3 - 3<br />
1 10 0 0<br />
2 10 0.3 3<br />
10 10 1 10<br />
100 10 2 20<br />
1000 10 3 30<br />
.<br />
1,000,000 10 6 60<br />
4
Waves versus Pulses<br />
What do radars transmit?<br />
Waves?<br />
Waves, modulated<br />
by “on-off” action of<br />
pulse envelope<br />
or Pulses?<br />
How many cycles are in a typical pulse?<br />
PFISR frequency: 449 MHz<br />
Typical long-pulse length: 480 µs 215,520 cycles! 5
Pulsed <strong>Radar</strong><br />
Pulse length<br />
100 µsec<br />
Power<br />
Peak power<br />
1 Mega-Watt<br />
Target<br />
Return<br />
10 -12 Watt<br />
Inter-pulse period<br />
(IPP) 1 msec<br />
Time<br />
Duty cycle =<br />
Pulse length<br />
Pulse repetition interval<br />
10%<br />
Average power = Peak power * Duty cycle<br />
100 kWatt<br />
Pulse repetition frequency (PRF) = 1/(IPP)<br />
1 kHz<br />
Continuous wave (CW) radar: Duty cycle = 100% (always on)<br />
6
Distance = Time<br />
Range resolution: Set by pulse length given in units of time, τ p , or length, cτ p<br />
ΔR = R 2<br />
− R 1<br />
= cτ p<br />
2<br />
Maximum unambiguous range: Set by Inter-pulse Period (IPP)<br />
2R/c<br />
IPP<br />
IPP<br />
IPP = Interpulse period (s)<br />
PRF = pulse repetition frequence<br />
= 1/IPP (Hz)<br />
R u<br />
= c IPP<br />
2<br />
7
Velocity = Frequency<br />
Transmitted signal: cos(2πf o<br />
t)<br />
After return from target:<br />
⎡ ⎛<br />
cos⎢<br />
2πf o ⎜ t + 2R<br />
⎣ ⎝ c<br />
⎞ ⎤<br />
⎟ ⎥<br />
⎠ ⎦<br />
To measure frequency, we need to observe signal for at least one cycle.<br />
So we will need a model of how R changes with time. Assume constant velocity:<br />
Substituting:<br />
⎡ ⎛<br />
cos⎢<br />
2π⎜<br />
f o<br />
+<br />
⎣ ⎝<br />
R = R o<br />
+ v o<br />
t<br />
f o<br />
2v o<br />
c<br />
− f D<br />
⎞<br />
⎟ t + 2πf R ⎤<br />
o o<br />
⎥<br />
⎠ c ⎦<br />
constant<br />
f D<br />
= −2 f o v o<br />
c<br />
= −2v o<br />
λ o<br />
By convention, positive Doppler frequency shift<br />
Target and radar closing<br />
8
Two key concepts<br />
Two key concepts:<br />
Distant<br />
Time<br />
R = cΔt 2<br />
e-<br />
Velocity<br />
v = − f D<br />
λ 0<br />
2<br />
Frequency<br />
A Doppler radar measures backscattered power as a function range and velocity.<br />
Velocity is manifested as a Doppler frequency shift in the received signal.<br />
9
Two key concepts<br />
Two key concepts:<br />
Distant<br />
Time<br />
R = cΔt 2<br />
Velocity<br />
v = − f D<br />
λ 0<br />
2<br />
Frequency<br />
A Doppler radar measures backscattered power as a function range and velocity.<br />
Velocity is manifested as a Doppler frequency shift in the received signal.<br />
10
J. Semeter, Boston Un<br />
Concept of a “Doppler Spectrum”<br />
er Doppler Spectra<br />
Two key concepts:<br />
Distant Time<br />
R = cΔt 2<br />
ENG SC700 <strong>Radar</strong> Remote Sensing<br />
Velocity<br />
v = − f D<br />
λ 0<br />
2<br />
Frequency<br />
NEXRAD WSR-88D<br />
Power (dB)<br />
Some Other Doppler Spectra<br />
J. Semeter<br />
ine<br />
t give Doppler spectrum<br />
Tennis ball, birds, aircraft engine<br />
Velocity (m/s)<br />
S. Bachma<br />
If there is a distribution of targets moving at different velocities (e.g., electrons in the<br />
ionosphere) then there is no single Doppler shift but, rather, a Doppler spectrum.<br />
What is the Doppler spectrum of the ionosphere at UHF ( λ of 10 to 30 cm)?<br />
11
e, which is the main mode detected by ISRs, and the Langmuir<br />
Longitudinal Modes in a Thermal Plasma<br />
n, 2003]. Using a linear approach to solve the Vlasov-Poisson<br />
DIAZ ET AL.: BEAM-PLASMA INSTABILITY EFFECTS ON IS SPECTRA<br />
X-6 DIAZ ET AL.: BEAM-PLASMA INSTABILITY EFFECTS ON IS SPECTRA<br />
ispersion relation of these modes is obtained. The real part of<br />
me 1 <br />
3<br />
DIAZ ET AL.: BEAM-PLASMA π<br />
2 INSTABILITY Te<br />
2 EFFECTS ON IS SPECTRA<br />
relationωreads<br />
si = −<br />
+ exp − T e<br />
− 3 me ω s 1 <br />
3(2)<br />
8 m i T i 2T i π 2<br />
2 Te<br />
2 27<br />
Ion-acoustic<br />
ω si = −<br />
+ exp − T e<br />
− 3 ω<br />
s<br />
me 1 8 <br />
3<br />
m i T i 2T i 2<br />
s = k B (T e +3T i )/m π i is the2 ion-acoustic Te<br />
ω si = −<br />
+<br />
6<br />
ω s = C s k, where C s = 2 speed. The<br />
exp − T e<br />
dependence<br />
− 3 of this mode<br />
ω s (2)<br />
DIAZ ET8AL.: BEAM-PLASMA m i T i INSTABILITY EFFECTS ON IS SPECTRA<br />
k B (T e +3T2T i )/m i i<br />
2<br />
pheric state parameters is observed in Eq. 2. The Langmuir ismode the(1)<br />
ion-acoustic is detected byspeed. The dependence of<br />
= k B (T e +3T i )/m i is the<br />
ssuming ω si ω s , k 2 on λ 2 ionospheric <br />
ion-acoustic speed. The<br />
De me<br />
1 and 1<br />
T state parameters <br />
dependence<br />
is observed <br />
of this mode<br />
er certain conditions, and the real part of its dispersion 3 relation in Eq. 2. The Langmuir mode is d<br />
π<br />
2<br />
i/T Te e 2 1) can be written<br />
ω si = −<br />
+ exp − T e<br />
− 3 is expressed as<br />
heric state parameters ω s (2)<br />
is observed in Eq. 2. The Langmuir mode is detected by<br />
ISR8<br />
under m i certainT conditions, i and 2T i the 2 real part of its dispersion relation is exp<br />
ere Langmuir C s = ω L = ωpe 2 +3k 2 vthe 2<br />
r certain conditions, k B (T e +3T and i )/m the i<br />
real is the part ≈ ω pe + 3<br />
ion-acoustic of its 2dispersion v theλ De k 2 , (3)<br />
speed. relation<br />
The dependence is expressed of this as<br />
ω L = ωpe 2 +3k 2 vthe 2 ≈ ω pe + 3 mode<br />
imaginary part (assuming ω<br />
2 v theλ De k 2 ,<br />
ionospheric state parameters Li ω<br />
is observed L )<br />
in Eq. 2. The Langmuir mode is detected by<br />
ω L = ωpe 2 +3k 2 vthe 2 ≈ is<br />
ω pe + 3 2 v theλ De k 2 , (3)<br />
under certain conditions,<br />
73 and the andimaginary the real part part of its (assuming dispersion ω Li<br />
relation ω L ) is isexpressed as<br />
aginary Maypart 29, (assuming 2010, π 6:36am ω pe<br />
3 Li 1<br />
D R A F T<br />
ω Li ≈− ω<br />
exp L ) is−<br />
ω2 pe<br />
− 3<br />
ω L = ωpe 2 +3k 2 vthe 2 ≈ ω pe + 3 ω<br />
8 k 3 vthe<br />
3 2k 2 v 2 L . (4)<br />
the<br />
2<br />
2 v theλ<br />
De k 2 , (3)<br />
rward model used toestimate ionospheric parameters π ωpe<br />
3 1<br />
ω Li ≈−<br />
exp −<br />
ω2 pe<br />
π ωpe<br />
3 1<br />
the imaginary ω part (assuming ω 8 k 3 vthe<br />
3 Li ≈−<br />
exp<br />
8 k 3 Li −<br />
ω2 pe<br />
ω L 2k ) is − 3 in ISR assumes that these<br />
dominating modes in the ISR spectrum. However, 2 vthe 2 an2injected beam of particles,<br />
v 3 the<br />
Figure 2·4: Longitudinal modes of−a 3 plasma. Blue lines re<br />
acoustic ω waves and red ones 2k to 2 Langmuir vthe 2 L . (4) 2waves.<br />
74<br />
ward model used to estimate<br />
The forward<br />
ionospheric<br />
model<br />
parameters<br />
used to estimate ionospheric parameters in ISR assumes<br />
in ISR assumes that these<br />
π ωpe<br />
3 1<br />
ω75<br />
≈−<br />
exp −<br />
ω2 pe<br />
−<br />
ω 3 . (4)<br />
cular electrons, can destabilize the plasma, altering the dispersion relations and<br />
plasma particles start to interact more strongly with the growing wav<br />
are the dominating modes This caninsometimes the ISR be spectrum. described in However, terms of the an so-called injectedquasi-linea<br />
beam of<br />
des of these modes.<br />
12<br />
<br />
ω L .
tion equation, has to be used. The system of equations formed<br />
m at high latitudes, therefore a kinetic approach, which<br />
htities includes<br />
equation,<br />
to the<br />
has<br />
simulation Vlasov equation<br />
to be used. The<br />
particles. plus Maxwell’s equations, has<br />
system of equations formed<br />
to obtain the wave modes propagating along the plasma.<br />
ncludes the Vlasov equation plus Maxwell’s equations, has<br />
field equations. The name “Particle-in-Cell” comes from the way of<br />
Simulated ISR Doppler Spectrum<br />
des solve the equation of motion of particles with the Newton-Lorentz<br />
obtain the wave modes propagating along the plasma.<br />
· ∂f j(t, x, v)<br />
+ q j<br />
(E + v × B) · ∂f j(t, x, v)<br />
= 0 (2.3)<br />
∂x m j ∂v<br />
f j (t, x, Particle-in-cell v)<br />
+ q j (PIC):<br />
(E + v × B) · ∂f j(t, x, v)<br />
= 0 (2.3)<br />
∂x m j ∂v<br />
d v i<br />
dt = q i<br />
20<br />
∇×E (E(x i )+v i × B(x i )) for i =1,...,N (2.49)<br />
m<br />
= −∂B<br />
(2.4)<br />
i<br />
uations (Equations ∂t 2.4 and 2.7) together with the prescribed rule 96of<br />
J<br />
∂t<br />
20<br />
∇×E = −∂B<br />
(2.4)<br />
∇×B = µ 0 J + 1 ∂E<br />
∇ · E = ρ c 2 (2.6) (2.5)<br />
0 ∂t<br />
∇×B ∇ · E = = µ 0 J ρ + 1 ∂E<br />
(2.6)<br />
c 2 3000 (2.5)<br />
0 ∂t<br />
∇ · B = 0 (2.7)<br />
Frequency (kHz)<br />
ρ = ρ(x 1 , v 1 ,...,x N , v N ), (2.50)<br />
Ion-acoustic (“Ion Line”)<br />
J = J(x 1 , v 1 ,...,x N , v N ). (2.51)<br />
e and current ∇ · B = densities. 0 (2.7)<br />
e and current densities.<br />
0<br />
Simple<br />
q j n j = rules yield<br />
complex q j behavior f j d 3 v (2.8)<br />
<br />
q j n j = j <br />
q j f j d 3 v (2.8)<br />
the j PIC simulation j is given in Figure 2·8.<br />
q j n j v j = <br />
q j f j v d 3 v, -3000 (2.9)<br />
j<br />
<br />
q j<br />
jcharge and current density of the medium at certain iteration.<br />
y are classified depending on dimensionality of the code and on the<br />
q j n j v j = f j v d 3 v, (2.9)<br />
(a)<br />
e-velocity distribution function of the species j, <br />
tions used. j The codes solving a whole set of 0 and<br />
Maxwell’s equations are<br />
Langmuir (“Plasma Line”)<br />
A<br />
20 40 60 80 100 120<br />
k = 2π λ (1/m)<br />
13<br />
13
ISR Measures a Cut Through This Surface<br />
77<br />
96<br />
31<br />
3000<br />
150<br />
Frequency (kHz)<br />
0<br />
0<br />
-3000<br />
20 40 60 80 100 120<br />
k = 2π λ<br />
(a)<br />
(1/m)<br />
-150<br />
20 40 60 80 100 120<br />
k = 2π λ (1/m)<br />
Ion-acoustic “lines”<br />
are broadened by<br />
Landau damping<br />
AMISR, MHO<br />
EISCAT UHF<br />
Sondrestrom<br />
14
The ISR model<br />
where:<br />
Te/Ti<br />
area ~ Ne<br />
Ti/mi<br />
Vi<br />
From Evans, IEEE Transactions, 1969<br />
15
Incoherent Averaging<br />
Normalized ISR spectrum for different integration times at 1290 MHz<br />
1 sample<br />
30 samples<br />
We are seeking to estimate the<br />
power spectrum of a Gaussian<br />
random process. This requires<br />
that we sample and average many<br />
independent “realizations” of the<br />
process.<br />
Uncertainties ∝<br />
1<br />
Number of Samples<br />
600 samples<br />
16<br />
16
Components of a Pulsed Doppler <strong>Radar</strong><br />
_<br />
+<br />
+<br />
+<br />
_<br />
_<br />
Model Fit<br />
Plasma density (N e )<br />
Ion temperature (T i )<br />
Electron temperature (T e )<br />
Bulk velocity (V i )<br />
17<br />
17
ts spectrum. For a real waveform we have<br />
"!<br />
<br />
"!<br />
Essential Mathematical Operations<br />
!<br />
"!<br />
ly states that the total energy in a waveform is equal to the total<br />
Euler:<br />
its spectrum. For a real waveform<br />
|U( y)| 2 we have<br />
dy (2.26)<br />
u(x) 2 dx = 2 ! 0<br />
Fourier:<br />
!<br />
"!<br />
) = U("y)* for the spectrum of |U( a real y)| waveform.<br />
2 dy (2.26)<br />
u(x) 2 dx = 2 ! 0<br />
Wiener-Khinchine Relation<br />
y) =<br />
Convolution:<br />
U("y)* for the spectrum of a real waveform.<br />
that the autocorrelation function of a waveform is given by the<br />
ourier transform of its power spectrum. For a waveform u with<br />
) espectrum Wiener-Khinchine U, the power Relation spectrum is |U | 2 , and from R2 and R3<br />
U *( Correlation: f ) is the transform of u*("t), so we have<br />
s that the autocorrelation function of a waveform is given by the<br />
Fourier transform of its power spectrum. For a waveform u with<br />
e) spectrum u(t) # u*("t) U, the$ power U( f spectrum ) U *( f is ) |U = |U( | 2 , and f )| 2 from R2 (2.27) and R3<br />
at U *( f ) is the transform of u*("t), so we have<br />
Wiener-Khinchine Theorem:<br />
ng out the convolution, we have<br />
u(t) # u*("t) $ U( f ) U *( f ) = |U( f )| 2 (2.27)<br />
!<br />
!<br />
u*("t) = u(t " t%)u*("t%) dt% = u(s)u(s " t) ds = r(t) 18
Dirac Delta Function<br />
δ(t) =<br />
⎧⎪<br />
⎨<br />
⎩⎪<br />
+∞, x = 0<br />
0, x ≠ 0<br />
The Fourier Transform of a train of delta functions is a train of delta functions.<br />
19
Harmonic Functions<br />
20
Gate function<br />
ISR spectrum<br />
Autocorrelation function (ACF)<br />
Increasing Te<br />
Not surprisingly, the ISR ACF looks like a sinc function…<br />
21
Fourier Transform of an RF Pulse<br />
τ<br />
f 0<br />
frequency<br />
f 0<br />
– ( 1 ⁄ τ)<br />
f 0 + ( 1 ⁄ τ)<br />
The F.T. of a simple RF pulse is a sync function shifted to<br />
Figure 5.3. Amplitude spectrum for a single pulse, or a train of<br />
non-coherent pulses.<br />
the carrier frequency (by convolution property and<br />
Now consider the coherent gated CW waveform<br />
definition of delta function).<br />
f 3 () t = f 2 ( t – nT)<br />
n<br />
=<br />
∞<br />
∑<br />
– ∞<br />
f 3 () t<br />
given by<br />
(5.15)<br />
Clearly f 3 () t is periodic, where T is the period (recall that f r<br />
= 1 ⁄ T is the<br />
PRF). Using the complex exponential Fourier series we can rewrite f () t as<br />
22
Fourier Transform of a Finite Pulse Train<br />
T<br />
NT<br />
frequency<br />
2<br />
------<br />
NT<br />
Figure 5.5. Amplitude spectrum for a coherent pulse train of finite length.<br />
The F.T. of a finite train of RF pulses is a decaying train of<br />
sync functions with width inversely proportional to the<br />
total number of pulses, and separation inversely<br />
5.3. Linear Frequency Modulation Waveforms<br />
proportional to the Interpulse Period (IPP).<br />
Frequency or phase modulated waveforms can be used to achieve much<br />
wider operating bandwidths. Linear Frequency Modulation (LFM) is commonly<br />
used. In this case, the frequency is swept linearly across the pulse width,<br />
either upward (up-chirp) or downward (down-chirp). The matched filter bandwidth<br />
is proportional to the sweep bandwidth, and is independent of the pulse<br />
width. Fig. 5.6 shows a typical example of an LFM waveform. The pulse width<br />
23
Thus we see that the spectrum consists of lines (which follows from<br />
the Fourier repetitive nature Transform of the waveform) of an at intervals Long 1/T, Pulse with strengths Train given<br />
Pulse Spectra<br />
59<br />
Figure 3.17 Regular train of identical RF pulses.<br />
The F.T. of an infinite train of RF pulses is a line spectrum<br />
Figure 3.18 Spectrum of regular RF pulse train.<br />
with lines separated by the pulse repetition frequency.<br />
by two sinc function envelopes centered at frequencies f and !f . As<br />
24
Bandwidth of a pulsed signal<br />
Spectrum of receiver output has sinc shape, with sidelobes half the width of the<br />
central lobe and continuously diminishing in amplitude above and below main lobe<br />
A 1 microsecond pulse has a nullto-null<br />
bandwidth of the central<br />
lobe = 2 MHz<br />
Two possible bandwidth measures:<br />
“null to null” bandwidth<br />
B nn<br />
= 2 τ<br />
“3dB” bandwidth<br />
Unless otherwise specified, assume<br />
bandwidth refers to 3 dB bandwidth<br />
25<br />
25
Pulse-Bandwidth Connection<br />
Shorter pulse<br />
Larger bandwidth<br />
26
Strategies for radar reception<br />
We send a pulse of duration τ. How should we listen for the echo?<br />
Convolution of two rectangle functions<br />
Output<br />
Receiver<br />
Input<br />
Value at a single point<br />
• To determine range, we only need to find the rising edge of the<br />
pulse we sent. So make T 1 T 2 , then we’re integrating noise in time domain.<br />
• So how long should we close the switch?<br />
27
Detection of a signal embedded in noise<br />
Exponential pulse buried in random noise. Sine the signal and noise overlap<br />
in both time and frequency domains, the best way to separate them is not<br />
obvious.<br />
28
Most important consideration: Match the<br />
bandwidth of the signal you are looking for<br />
29
The bandwidth-noise connection<br />
The matched filter is a filter whose impulse response,<br />
or transfer function, is determined by a given signal,<br />
in a way that will result in the maximum attainable<br />
signal-to-noise ratio at the filter output when both<br />
the signal and white noise are passed through it.<br />
The optimum bandwidth of the filter, B,<br />
turns out to be very nearly equal to the<br />
inverse of the transmitted pulse width.<br />
To improve range resolution, we can<br />
reduce τ (pulse width), but that means<br />
increasing the bandwidth of transmitted<br />
signal = More noise…<br />
30
Transmitted signal: cos(2πf o<br />
t)<br />
Doppler Revisited<br />
After return from target:<br />
⎡ ⎛<br />
cos⎢<br />
2πf o ⎜ t + 2R<br />
⎣ ⎝ c<br />
⎞ ⎤<br />
⎟ ⎥<br />
⎠ ⎦<br />
To measure frequency, we need to observe signal for at least one cycle.<br />
So we will need a model of how R changes with time. Assume constant velocity:<br />
Substituting:<br />
⎡ ⎛<br />
cos⎢<br />
2π⎜<br />
f o<br />
+<br />
⎣ ⎝<br />
R = R o<br />
+ v o<br />
t<br />
f o<br />
2v o<br />
c<br />
− f D<br />
⎞<br />
⎟ t + 2πf R ⎤<br />
o o<br />
⎥<br />
⎠ c ⎦<br />
constant<br />
f D<br />
= −2 f o v o<br />
c<br />
= −2v o<br />
λ o<br />
By convention, positive Doppler frequency shift<br />
Target and radar closing<br />
31
Doppler Detection: Intuitive Approach<br />
Phasor diagram is a graphical representation of a sine wave<br />
I & Q components*<br />
I => in-phase component<br />
Acos(φ)<br />
Q => in-quadrature<br />
component<br />
Asin(φ)<br />
Consider strobe light as<br />
cosine reference wave<br />
at same frequency but<br />
with initial phase = 0<br />
*relative to reference signal<br />
32
Doppler Detection: Intuitive Approach<br />
Closing on target – positive Doppler shift<br />
e-<br />
Transmitted<br />
Received<br />
φ 1<br />
φ 2<br />
Target’s Doppler frequency shows up<br />
as a pulse-to-pulse shift in phase.<br />
33
I and Q Demodulation<br />
The fundamental output of a pulsed Doppler radar is a<br />
time series of complex numbers.<br />
34
I and Q Demodulation in Frequency Domain<br />
Transmitted signal<br />
Frequency domain<br />
cos(2πf o<br />
t)<br />
0<br />
f o<br />
-f o<br />
f o +f D<br />
Doppler shifted<br />
cos(2π( f o<br />
+<br />
f D<br />
)t)<br />
-f o -f D<br />
f D<br />
cos(2πf o<br />
t)<br />
cos(2πf D<br />
t)<br />
-f o -f D<br />
Cosine is even function, so sign of f D (and, hence, velocity) is lost.<br />
What we need instead is:<br />
exp( j2πf D<br />
t) = cos(2πf D<br />
t) + j sin(2πf D<br />
t)<br />
-f D f D<br />
f o +f D<br />
exp( j2πf D<br />
t)<br />
The analytic signal<br />
cannot be measured directly, but the cos and sin components<br />
via mixing with two oscillators with same frequency but orthogonal phases. The components<br />
are called “in phase” (or I) and “in quadrature” (or Q):<br />
Aexp( j2πf D<br />
t) = I +<br />
jQ<br />
35<br />
35
Example: Doppler Shift of a Meteor Trail<br />
• Collect N samples of I(t k ) and Q(t k ) from a target<br />
• Compute the complex FFT of I(t k )+jQ(t k ), and find the maximum in the<br />
frequency domain<br />
• Or compute “phase slope” in time domain.<br />
Meteor Echo I & Q<br />
Meteor Echo Power<br />
SNR (dB)<br />
Voltage<br />
Time (s)<br />
36
Does this strategy work for ISR?<br />
Typical ion-acoustic velocity: 3 km/s<br />
Doppler shift at 450 MHz: 10kHz<br />
Correlation time: 1/10kHz = 0.1 ms<br />
Required PRF to probe ionosphere (500km range):<br />
300 Hz<br />
Plasma has completely decorrelated by the time we send the next pulse.<br />
φ 1<br />
φ 2<br />
37
Does this strategy work for ISR?<br />
Typical ion-acoustic velocity: 3 km/s<br />
Doppler shift at 450 MHz: 10kHz<br />
Correlation time: 1/10kHz = 0.1 ms<br />
Required PRF to probe ionosphere (500km range):<br />
300 Hz<br />
Alternately, the Doppler shift is well Pulse beyond Spectra the max unambiguous<br />
Doppler defined by the Inter-Pulse Period T.<br />
59<br />
Figure 3.18 Spectrum of regular RF pulse train.<br />
38
The ISR target is “overspread”<br />
f d >>1/τ (Doppler changes significantly during one pulse)<br />
– Must sample multiple times per pulse<br />
– Result: Doppler can be determined from single pulse.<br />
Range<br />
Time<br />
τ S<br />
39
ISR Receiver: Doppler filter bank<br />
Doppler Filter Bank<br />
Doppler Range<br />
BPF1<br />
BPF2<br />
BPF<br />
f L ,f H<br />
G<br />
BPF3<br />
BPF4<br />
F1 F2 …<br />
Choose f L and f H such that<br />
f L f 0 +f dmax<br />
BPF5<br />
BPF6<br />
Practical Problem: It is hard to make narrow band (High Q) RF filters:<br />
Q =<br />
f 0<br />
f H<br />
− f L<br />
40
ISR Receiver: I and Q plus decorrelation<br />
LPF<br />
I(t i ) “in phase”<br />
BPF<br />
f L ,f H<br />
G<br />
Power<br />
splitter<br />
π/2 phase<br />
shift.<br />
LPF<br />
Q(t i ) “quadrature”<br />
We have time series of V(t) =I(t) + jQ(t), how do I compute the Doppler spectrum?<br />
Estimate the autocorrelation<br />
function (ACF) by computing products<br />
of complex voltages<br />
(“lag products”)<br />
ρ(τ ) = V(t)V * (t + τ )<br />
S<br />
FFT<br />
Power spectrum is Fourier<br />
Transform of the ACF<br />
41
Pulse compression and matched<br />
“If you know what you’re looking for, it’s easier to find.”<br />
c. Kernel<br />
Problem: Find the precise location of the target in the image.<br />
Solution: Correlation<br />
42
Range detection: revisited<br />
ΔR = cτ 2 =<br />
c<br />
2B<br />
τ = Pulse length<br />
B = Bandwidth<br />
• For high range resolution we want short pulse large<br />
bandwidth<br />
• For high SNR we want long pulse small bandwidth<br />
• Long pulse also uses a lot of the duty cycle, can’t listen as<br />
long, affects maximum range<br />
• The Goal of pulse compression is to increase the<br />
bandwidth (equivalent to increasing the range resolution)<br />
while retaining large pulse energy.<br />
43
Linear Frequency Modulation (LFM or<br />
44
Matched filter detection of a chirp<br />
45
Barker codes<br />
+<br />
off<br />
_<br />
46
Matched filtering of Barker Code<br />
3 bit code<br />
47


