Observing the Solar Wind with Interplanetary Scintillation
Observing the Solar Wind with Interplanetary Scintillation
Observing the Solar Wind with Interplanetary Scintillation

Create successful ePaper yourself
Turn your PDF publications into a flip-book with our unique Google optimized e-Paper software.
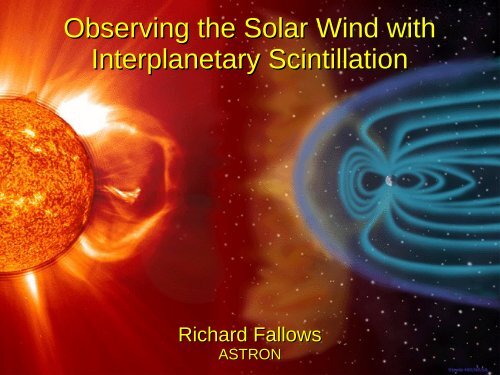
<strong>Observing</strong> <strong>the</strong> <strong>Solar</strong> <strong>Wind</strong> <strong>with</strong><br />
<strong>Interplanetary</strong> <strong>Scintillation</strong><br />
Richard Fallows<br />
ASTRON
The Sun's Atmosphere<br />
The <strong>Solar</strong> Corona (March 2006 eclipse).<br />
The <strong>Solar</strong> <strong>Wind</strong>: Expansion at supersonic speeds<br />
of <strong>the</strong> Corona through <strong>the</strong> solar system. Often two<br />
streams: “Fast” at ~750km/s and “slow” at ~350km/s.<br />
Space Wea<strong>the</strong>r:<br />
The impact of <strong>the</strong> solar wind<br />
and solar events such as<br />
Coronal Mass Ejections on <strong>the</strong><br />
Earth's magnetic field and<br />
ionosphere.
Radio Measurements<br />
Line of sight to radio source<br />
<strong>Scintillation</strong> due to turbulent-scale<br />
density variations in <strong>the</strong> <strong>Solar</strong> <strong>Wind</strong><br />
Time Lag<br />
●<br />
Simultaneous measurements by two antennas show<br />
similar patterns of scintillation.<br />
●<br />
Time-lag for maximum cross-correlation gives<br />
estimate of solar wind outflow speed.
<strong>Scintillation</strong> Index - “g-level”<br />
Plot courtesy P.K. Manoharan<br />
After Coles, 1978<br />
●<br />
●<br />
<strong>Scintillation</strong> index is basic measure of <strong>the</strong> amount of scintillation:<br />
●<br />
g-level is index normalised for distance: Can be related to solar wind density.<br />
Peak at certain distance:<br />
●<br />
●<br />
“Strong” scattering closer to <strong>the</strong> Sun; “Weak” scattering fur<strong>the</strong>r away.<br />
Distance of peak depends on observing frequency'.
Cross-Correlation<br />
Cross-correlation function<br />
of time series from two<br />
stations shows peak at<br />
time-lag.<br />
First estimate of solar wind<br />
speed.
Coronal Mass Ejections (CMEs)<br />
●<br />
Presence of CME can<br />
be indicated by<br />
different features:<br />
●<br />
●<br />
●<br />
Substantial changes in<br />
form of crosscorrelation<br />
function<br />
Sudden increase in<br />
scintillation level<br />
Negative lobe on<br />
cross-correlation<br />
function.<br />
Large “negative lobe” indicates magnetic field rotation
Longer Baselines<br />
If longer baselines are<br />
used, cross-correlation<br />
function may show multiple<br />
peaks.<br />
Peaks correspond to<br />
different solar wind<br />
streams.
Dual-Frequency Correlation<br />
928/1420MHz<br />
928/500MHz<br />
1420/500MHz<br />
0319+415, distance = 85Rs
Tomography<br />
●<br />
Many observations taken as Sun<br />
rotates results, in <strong>the</strong> Sun's<br />
frame of reference, in many<br />
overlapping lines of sight<br />
between antennas and radio<br />
sources.<br />
●<br />
These used to create a<br />
“tomographic” image of <strong>the</strong> inner<br />
heliosphere in both g-level and<br />
solar wind speed.<br />
After Manoharan, 2008
Tomography
Tomography<br />
Co-rotating analysis<br />
Combination of methods<br />
Images courtesy M. Bisi (Aberystwyth) and B. Jackson (UCSD)<br />
EISCAT IPS line of sight through tomographic<br />
image of CME. CME gave Earth glancing blow;<br />
registered in ACE spacecraft data.
Cross-Correlation Analysis<br />
●<br />
●<br />
●<br />
Longer antenna baselines allow<br />
different solar wind streams in<br />
line of sight to be measured<br />
accurately.<br />
Variation of height of crosscorrelation<br />
functions <strong>with</strong><br />
baseline can be used to<br />
determine flow direction.<br />
Data are analysed by fitting a<br />
weak-scattering model to <strong>the</strong><br />
power spectra.<br />
EISCAT IPS observation of CME on 14 th May 2005; auto-correlation is top, remaining are crosscorrelations.<br />
Cross-correlation functions also show two adjacent fast streams. Baselines projected<br />
onto sky plane: Bpar in radial direction, Bperp in meridional direction.
Why EISCAT?<br />
●<br />
●<br />
●<br />
●<br />
<strong>Observing</strong> frequency was, historically, convenient for looking<br />
closer to <strong>the</strong> Sun.<br />
●<br />
Now, <strong>with</strong> space wea<strong>the</strong>r becoming more important, <strong>the</strong><br />
changes in observing frequency mean we can look fur<strong>the</strong>r<br />
from <strong>the</strong> Sun and closer to <strong>the</strong> Earth.<br />
Longer baselines mean better resolution of solar wind streams.<br />
Being a passive experiment means that time awarded equates<br />
to much more in real time.<br />
Time is only “used” when data are recorded:<br />
●<br />
Can have many short observations through a day, and<br />
observe over a few weeks.
What's Needed?<br />
●<br />
●<br />
●<br />
Need ability to track radio sources<br />
Need a reasonable bandwidth<br />
Need high time resolution (~ 100Hz)<br />
●<br />
May also need remote sites to be converted to 1420MHz
Radio Source Tracking<br />
●<br />
●<br />
●<br />
●<br />
The mainland EISCAT antennas were never designed to track<br />
radio sources, only to slew at a constant speed between fixed<br />
positions.<br />
Tracking is achieved by slewing <strong>the</strong> antenna to a new position just<br />
ahead of <strong>the</strong> radio source every few seconds.<br />
The radio source <strong>the</strong>n drifts through <strong>the</strong> beam before <strong>the</strong> position<br />
is updated again.<br />
Rate of antenna position update set to 2.56s for convenient<br />
filtering of any effect of doing this.<br />
●<br />
The ESR does have a tracking mode, so this does not apply to<br />
that antenna.
Radio Source Tracking<br />
Difference between<br />
maximum and<br />
minimum levels<br />
Movement of<br />
main source<br />
Side Lobe<br />
Movement of<br />
strong source<br />
Movement of <strong>the</strong> source<br />
<strong>with</strong>in <strong>the</strong> main beam is<br />
negligible, but strong source<br />
Main Peak<br />
in a sidelobe could modulate<br />
<strong>the</strong> signal by <strong>the</strong> slewing<br />
frequency of 0.39Hz
Filter Settings<br />
Power<br />
Central Filter Frequencies<br />
Frequency<br />
•<br />
Signal passes through a<br />
rack of six channel<br />
boards.<br />
•<br />
Filters on <strong>the</strong>se boards<br />
are used to sample<br />
different parts of <strong>the</strong><br />
signal.<br />
•<br />
For IPS, <strong>the</strong>se filters are<br />
set to 1.8MHz wide <strong>with</strong><br />
central frequencies such<br />
as to cover a bandwidth<br />
of 5.4MHz.<br />
We can/could only use three channel boards:<br />
Data rate too high for more!
Interference Issues<br />
●<br />
●<br />
Rise of mobile phones has encroached on <strong>the</strong> traditional<br />
observing band of EISCAT.<br />
Space around 930MHz now very limited, especially at<br />
Sodankylä.
Median Sampling<br />
●<br />
●<br />
Data usually sampled initially at a very high rate and <strong>the</strong>n<br />
averaged down to a sampling rate of 100Hz later.<br />
●<br />
●<br />
●<br />
Historically, <strong>the</strong> averaging was done in a separate 'IPS card'<br />
Now done by <strong>the</strong> channel board filters.<br />
Averaging performed using a standard mean.<br />
Averaging using <strong>the</strong> median is less susceptible to interference<br />
spikes (if <strong>the</strong>re are not too many...).<br />
●<br />
●<br />
Can do this at EISCAT, but only by recording data at <strong>the</strong> full<br />
rate and averaging in software later!<br />
Sometimes results in data drops because of <strong>the</strong> rate...
1420MHz System<br />
● 1420MHz system established for <strong>the</strong> remote sites in 2003.<br />
●<br />
●<br />
●<br />
●<br />
Protected astronomy band (cannot transmit here!).<br />
Requires replacement of several waveguide and o<strong>the</strong>r parts.<br />
Takes ~1.5 hours per antenna.<br />
Not possible to do this at Tromsø.
1420MHz System
1420MHz System<br />
●<br />
Now have ability to use full front-end bandwidth at 1420MHz:<br />
●<br />
●<br />
●<br />
New total-power receivers installed at remote sites.<br />
These sample <strong>the</strong> signal over <strong>the</strong> full bandwidth for each<br />
polarisation.<br />
The sampled signals are <strong>the</strong>n passed straight through <strong>the</strong><br />
channel boards <strong>with</strong>out fur<strong>the</strong>r filtering.
Summary<br />
● EISCAT used for observing IPS since early 1990s.<br />
●<br />
●<br />
●<br />
Proved a reliable system over <strong>the</strong> years which offers a number<br />
of advantages over o<strong>the</strong>rs.<br />
New move to VHF frequencies will open up more detail on <strong>the</strong><br />
heliosphere closer to Earth.<br />
EISCAT 3D should provide extra opportunities!