Luxury "red bull" - French Chamber of Commerce and Industry in ...
Luxury "red bull" - French Chamber of Commerce and Industry in ...
Luxury "red bull" - French Chamber of Commerce and Industry in ...

You also want an ePaper? Increase the reach of your titles
YUMPU automatically turns print PDFs into web optimized ePapers that Google loves.
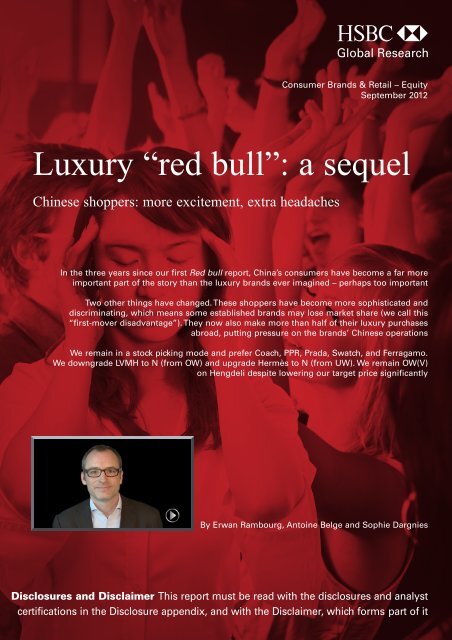
Consumer Br<strong>and</strong>s & Retail – Equity<br />
September 2012<br />
<strong>Luxury</strong> “<strong>red</strong> bull”: a sequel<br />
Ch<strong>in</strong>ese shoppers: more excitement, extra headaches<br />
In the three years s<strong>in</strong>ce our first Red bull report, Ch<strong>in</strong>a’s consumers have become a far more<br />
important part <strong>of</strong> the story than the luxury br<strong>and</strong>s ever imag<strong>in</strong>ed – perhaps too important<br />
Two other th<strong>in</strong>gs have changed. These shoppers have become more sophisticated <strong>and</strong><br />
discrim<strong>in</strong>at<strong>in</strong>g, which means some established br<strong>and</strong>s may lose market share (we call this<br />
“first-mover disadvantage”). They now also make more than half <strong>of</strong> their luxury purchases<br />
abroad, putt<strong>in</strong>g pressure on the br<strong>and</strong>s’ Ch<strong>in</strong>ese operations<br />
We rema<strong>in</strong> <strong>in</strong> a stock pick<strong>in</strong>g mode <strong>and</strong> prefer Coach, PPR, Prada, Swatch, <strong>and</strong> Ferragamo.<br />
We downgrade LVMH to N (from OW) <strong>and</strong> upgrade Hermès to N (from UW). We rema<strong>in</strong> OW(V)<br />
on Hengdeli despite lower<strong>in</strong>g our target price significantly<br />
By Erwan Rambourg, Anto<strong>in</strong>e Belge <strong>and</strong> Sophie Dargnies<br />
Disclosures <strong>and</strong> Disclaimer This report must be read with the disclosures <strong>and</strong> analyst<br />
certifications <strong>in</strong> the Disclosure appendix, <strong>and</strong> with the Disclaimer, which forms part <strong>of</strong> it
Consumer Br<strong>and</strong>s & Retail<br />
Global luxury goods<br />
September 2012<br />
abc<br />
Contents<br />
Summary 1<br />
Calendar <strong>of</strong> events 4<br />
Valuation <strong>and</strong> rat<strong>in</strong>gs 5<br />
Ch<strong>in</strong>a to rema<strong>in</strong> the dom<strong>in</strong>ant<br />
<strong>in</strong>fluence 11<br />
Sophistication, travel <strong>and</strong><br />
overdependence 18<br />
Company pr<strong>of</strong>iles 33<br />
Burberry 34<br />
Christian Dior 38<br />
Coach 42<br />
Ferragamo 46<br />
Hengdeli Hold<strong>in</strong>gs 50<br />
Hermès 54<br />
Hugo Boss 58<br />
Luxottica 62<br />
LVMH 66<br />
PPR 70<br />
Prada 74<br />
Richemont 78<br />
Swatch 82<br />
Tiffany 86<br />
Tod’s 90<br />
Disclosure appendix 97<br />
Disclaimer 100<br />
Key data - <strong>Luxury</strong> goods stocks rat<strong>in</strong>gs <strong>and</strong> target prices<br />
Stock Ticker New rat<strong>in</strong>g Old rat<strong>in</strong>g Curr Sh price<br />
(at 27/08/12)<br />
New target<br />
price<br />
Old target<br />
price<br />
Potential<br />
return<br />
PE 2011 PE 2012e PE 2013e<br />
Hengdeli 3389.HK OW(V) unchanged HKD 2.17 3.20 4.10 47.5% 10.7 10.2 11.0<br />
Coach* COH.N OW(V) OW USD 55.92 79.00 88.00 41.3% 17.3 15.3 13.7<br />
The Swatch Group UHR.VX OW unchanged CHF 401.80 500.00 500.00 24.4% 17.1 14.1 12.7<br />
PPR PRTP.PA OW unchanged EUR 126.35 156.00 150.00 23.5% 15.1 12.8 10.8<br />
Ferragamo SFER.MI OW(V) unchanged EUR 17.38 21.00 18.00 20.8% 36.0 26.3 17.6<br />
Prada 1913.HK OW(V) unchanged HKD 59.15 71.00 62.00 20.0% 35.7 23.4 18.6<br />
Christian Dior DIOR.PA OW unchanged EUR 117.00 140.00 139.00 19.7% 15.4 12.2 10.8<br />
Hugo Boss BOSSn.DE Neutral (V) unchanged EUR 74.99 84.00 88.00 12.0% 18.2 15.8 13.8<br />
Richemont (*) CFR.VX Neutral unchanged CHF 59.95 67.00 62.00 11.8% 20.7 15.4 14.0<br />
Hermès HRMS.PA Neutral UW EUR 220.65 245.00 272.00 11.0% 39.0 33.0 29.5<br />
Burberry* BRBY.L Neutral (V) Neutral GBP(p) 1360.00 1500.00 1550.00 10.3% 23.3 19.5 16.9<br />
Tiffany TIF.N Neutral (V) Neutral USD 62.71 69.00 69.00 10.0% 17.4 17.4 14.7<br />
LVMH LVMH.PA Neutral OW EUR 133.50 145.00 145.00 8.6% 21.4 17.7 15.8<br />
Tod's TOD.MI Neutral unchanged EUR 84.50 90.00 81.00 6.5% 19.2 17.0 15.3<br />
Luxottica LUX.MI Neutral unchanged EUR 28.91 30.50 28.50 5.5% 26.6 21.9 18.2<br />
Average 21.0 17.1 14.6<br />
Source: HSBC estimates, Company data *based on calendar data Potential returns equal the difference between the current share price <strong>and</strong> the target price, <strong>in</strong>clud<strong>in</strong>g the forecast dividend yield when <strong>in</strong>dicated
Consumer Br<strong>and</strong>s & Retail<br />
Global luxury goods<br />
September 2012<br />
abc<br />
Summary<br />
<strong>Luxury</strong> br<strong>and</strong>s have enjoyed great success <strong>in</strong> Ch<strong>in</strong>a over recent years,<br />
but the way <strong>in</strong> which Ch<strong>in</strong>ese consumers are evolv<strong>in</strong>g suggests the<br />
ride may not be as smooth go<strong>in</strong>g forward. Ch<strong>in</strong>ese consumers’<br />
<strong>in</strong>creas<strong>in</strong>g sophistication <strong>and</strong> overseas shopp<strong>in</strong>g sprees pose<br />
challenges to megabr<strong>and</strong>s, while the sector’s dependence on the<br />
Ch<strong>in</strong>ese raises questions on concentration risk <strong>and</strong> valuations.<br />
Ch<strong>in</strong>a, Ch<strong>in</strong>a, Ch<strong>in</strong>a. Before you start roll<strong>in</strong>g your eyes, this is not another report extoll<strong>in</strong>g the growth<br />
prospects for Ch<strong>in</strong>ese luxury consumption, but one that highlights the fact that the dynamics driv<strong>in</strong>g this<br />
space have well <strong>and</strong> truly changed. What we thought was set <strong>in</strong> stone three years ago – the dom<strong>in</strong>ance <strong>of</strong><br />
ma<strong>in</strong>stream megabr<strong>and</strong>s <strong>and</strong> their tireless store expansion – can no longer be taken for granted. Ch<strong>in</strong>ese<br />
consumer behaviour has evolved at a surpris<strong>in</strong>gly rapid pace <strong>and</strong> this poses challenges to the megabr<strong>and</strong>s.<br />
Ch<strong>in</strong>a set to cont<strong>in</strong>ue dom<strong>in</strong>at<strong>in</strong>g for years to come …<br />
Ch<strong>in</strong>a: from dream to reality. How th<strong>in</strong>gs have changed. In the late 1990s, the luxury <strong>in</strong>dustry (<strong>and</strong><br />
we were part <strong>of</strong> it back then) coveted Ch<strong>in</strong>a but had barely scratched the surface <strong>of</strong> its potential.<br />
Today, Ch<strong>in</strong>ese consumption dom<strong>in</strong>ates the sector’s global sales. In the three years s<strong>in</strong>ce we<br />
published the first Red bull report, sales to Ch<strong>in</strong>ese consumers domestically <strong>and</strong> abroad have<br />
exp<strong>and</strong>ed from 10% to fully 25% <strong>of</strong> the sector’s total revenues, exceed<strong>in</strong>g what most luxury goods<br />
CEOs had da<strong>red</strong> hope for. In our op<strong>in</strong>ion, the real debate now is not so much about Ch<strong>in</strong>a as the<br />
Ch<strong>in</strong>ese, especially as they now do most <strong>of</strong> their luxury shopp<strong>in</strong>g abroad.<br />
Positive long-term social / cultural drivers. Although we have already seen strong multi-year<br />
growth, we th<strong>in</strong>k there is more to come from Ch<strong>in</strong>a, supported by social trends, “the urge to splurge”,<br />
br<strong>and</strong> obsession, <strong>and</strong> the trad<strong>in</strong>g-up phenomenon. <strong>Luxury</strong> goods are <strong>of</strong>ten conside<strong>red</strong> by Western<br />
<strong>in</strong>vestors as purely discretionary; we believe this viewpo<strong>in</strong>t underplays the powerful social / cultural<br />
forces driv<strong>in</strong>g luxury consumption <strong>in</strong> Ch<strong>in</strong>a.<br />
Penetration rema<strong>in</strong>s limited. Is Ch<strong>in</strong>a the next Japan? Is the ma<strong>in</strong>l<strong>and</strong> luxury sector approach<strong>in</strong>g<br />
maturity? These are frequently voiced concerns <strong>and</strong> we reiterate <strong>in</strong> this report that we do not th<strong>in</strong>k Ch<strong>in</strong>a’s<br />
luxury sector is even close to be<strong>in</strong>g mature. With a diversified consumer base, a still limited retail footpr<strong>in</strong>t<br />
<strong>and</strong> wage <strong>in</strong>flation driv<strong>in</strong>g a gradual expansion <strong>of</strong> the middle class, Ch<strong>in</strong>a rema<strong>in</strong>s above all a market<br />
where br<strong>and</strong>s are recruit<strong>in</strong>g customers rather than serv<strong>in</strong>g repeat ones.<br />
1
Consumer Br<strong>and</strong>s & Retail<br />
Global luxury goods<br />
September 2012<br />
abc<br />
…but sophistication, travel <strong>and</strong> Ch<strong>in</strong>a dependence are risks<br />
Rapidly chang<strong>in</strong>g consumer behaviour. Long gone are the days <strong>of</strong> one-br<strong>and</strong>-suits-all fashion <strong>in</strong> Ch<strong>in</strong>a.<br />
As Ch<strong>in</strong>ese consumers become better <strong>in</strong>formed <strong>and</strong> more dem<strong>and</strong><strong>in</strong>g, they are mov<strong>in</strong>g away from logo<br />
products, <strong>and</strong> look<strong>in</strong>g for more differentiated designs that show they are “<strong>in</strong> the know”. Of course, firstmovers<br />
– like Louis Vuitton <strong>and</strong> Omega – are still recruit<strong>in</strong>g customers, but <strong>in</strong> our view they now carry a<br />
first-mover disadvantage as Ch<strong>in</strong>ese consumers tire <strong>of</strong> logo fashion <strong>and</strong> seek more differentiated looks.<br />
Indeed, the pace at which Ch<strong>in</strong>ese consumer behaviour is evolv<strong>in</strong>g has been faster than we expected <strong>and</strong> is<br />
the reason why we now th<strong>in</strong>k the megabr<strong>and</strong>s could lose market share.<br />
Social / political risks. Corporate gift<strong>in</strong>g has been a key driver <strong>of</strong> luxury dem<strong>and</strong> <strong>in</strong> Ch<strong>in</strong>a <strong>and</strong> is the<br />
primary reason why the luxury market <strong>in</strong> Ch<strong>in</strong>a is the only male-driven one <strong>in</strong> the world. With challeng<strong>in</strong>g<br />
economic conditions, high pr<strong>of</strong>ile graft cases <strong>and</strong> ris<strong>in</strong>g social tension driven by Ch<strong>in</strong>a’s grow<strong>in</strong>g wealth<br />
divide, there is a risk that corporate gift<strong>in</strong>g may suffer as the Ch<strong>in</strong>ese government clamps down on<br />
conspicuous consumption <strong>and</strong> gets tough on corruption. Chang<strong>in</strong>g cultural values may also pose a risk, as<br />
social practices <strong>of</strong> wealthy men tak<strong>in</strong>g mistresses appear to be on the wane. Moreover, the Ch<strong>in</strong>ese<br />
authorities have not made it easy for consumers to purchase imported luxury br<strong>and</strong>s (import duties,<br />
consumption tax) <strong>and</strong> it is uncerta<strong>in</strong> whether this will change any time soon.<br />
Why overseas shopp<strong>in</strong>g sprees will cont<strong>in</strong>ue <strong>and</strong> why this could become an issue. There are many<br />
good reasons why Ch<strong>in</strong>ese nationals are purchas<strong>in</strong>g more luxury items abroad. It is not just that goods are<br />
cheaper overseas, travell<strong>in</strong>g has become easier for Ch<strong>in</strong>ese nationals, service <strong>in</strong>creas<strong>in</strong>gly matters to them,<br />
<strong>and</strong> there is a cachet to purchas<strong>in</strong>g items abroad. In one section <strong>of</strong> this report, we focus on how<br />
theoretically Taiwan could become the next Hong Kong for the luxury <strong>in</strong>dustry, open<strong>in</strong>g up sizeable<br />
opportunities for br<strong>and</strong>s. But there are risks associated with this trend <strong>of</strong> overseas shopp<strong>in</strong>g sprees, not<br />
least that the br<strong>and</strong>’s retail footpr<strong>in</strong>t <strong>in</strong> the ma<strong>in</strong>l<strong>and</strong> could become a series <strong>of</strong> showrooms for local<br />
consumers that will ultimately make their purchases elsewhere. In addition, if br<strong>and</strong>s close the Ch<strong>in</strong>a-<br />
Europe price gap, then this could alienate European consumers <strong>and</strong> squeeze gross marg<strong>in</strong>s.<br />
The threat <strong>of</strong> overdependence. You can have too much <strong>of</strong> a good th<strong>in</strong>g. As the luxury sector has become<br />
highly dependent on the Ch<strong>in</strong>ese consumer, this poses a problem for br<strong>and</strong> managers <strong>and</strong> valuations: how<br />
much should you pay for companies that are plac<strong>in</strong>g most <strong>of</strong> their eggs <strong>in</strong> one basket?<br />
Key changes<br />
Changes <strong>in</strong> rat<strong>in</strong>gs. The key rat<strong>in</strong>g change is for LVMH, which we downgrade from OW to N with an<br />
unchanged target price <strong>of</strong> EUR145 after a strong run. This downgrade is consistent with our view that as<br />
Ch<strong>in</strong>ese consumers become more sophisticated, lead<strong>in</strong>g br<strong>and</strong>s like Louis Vuitton will lose share (three<br />
years back we thought exactly the reverse). That said, we have reta<strong>in</strong>ed an OW rat<strong>in</strong>g on Christian Dior<br />
as we believe the discount to RNAV rema<strong>in</strong>s attractive (28%) <strong>and</strong> we have upgraded Hermès (from UW to<br />
N) follow<strong>in</strong>g the stock’s steep de-rat<strong>in</strong>g over the past few months.<br />
Conviction stocks. We see limited upside <strong>in</strong> most luxury stocks but reta<strong>in</strong> conviction OW rat<strong>in</strong>gs on<br />
Coach (TP USD79), PPR (TP EUR146), Prada (TP HKD70), Swatch (TP CHF500), <strong>and</strong> Ferragamo<br />
(TP EUR21). While we rema<strong>in</strong> OW (V) on Hengdeli, we have cut its target price from HKD4.10 to<br />
HKD3.20 to reflect the <strong>in</strong>creas<strong>in</strong>g level <strong>of</strong> Ch<strong>in</strong>ese luxury consumption tak<strong>in</strong>g place outside <strong>of</strong> Ch<strong>in</strong>a.<br />
2
Consumer Br<strong>and</strong>s & Retail<br />
Global luxury goods<br />
September 2012<br />
abc<br />
Summary <strong>of</strong> HSBC sales estimate changes <strong>and</strong> comparison with Bloomberg consensus<br />
_______________ 2012e Sales______________ ______________ 2013e Sales __________________<br />
______ HSBC _______ HSBC vs _____ HSBC ______ HSBC vs<br />
(m) Curr. New Old Chg. Cons. consensus New Old Chg. Cons. consensus<br />
Burberry* GBP 2,110 2,100 0% 2,088 1% 2,366 2,335 1% 2,355 0%<br />
Christian Dior EUR 29,604 29,168 1% 28,569 4% 32,604 31,785 3% 31,048 5%<br />
Coach** USD 5,215 5,500 -5% 5,308 -2% 5,829 6,150 -5% 5,854 0%<br />
Ferragamo EUR 1,200 1,170 3% 1,149 4% 1,380 1,300 6% 1,265 9%<br />
Hengdeli CNY 11,990 12,969 -8% 12,473 -4% 13,007 15,141 -14% 14,293 -9%<br />
Hermès EUR 3,373 3,300 2% 3,323 2% 3,750 3,628 3% 3,671 2%<br />
Hugo Boss EUR 2,330 2,300 1% 2,303 1% 2,520 2,500 1% 2,504 1%<br />
Luxottica EUR 7,180 7,084 1% 7,074 1% 7,843 7,689 2% 7,600 3%<br />
LVMH EUR 28,370 28,000 1% 28,087 1% 31,210 30,500 2% 30,453 2%<br />
PPR EUR 13,807 13,525 2% 13,694 1% 14,822 14,410 3% 14,624 1%<br />
Prada EUR 3,351 3,256 3% 3,167 6% 3,865 3,656 6% 3,731 4%<br />
Richemont* EUR 10,250 9,600 7% 10,248 0% 10,925 10,275 6% 11,097 -2%<br />
The Swatch Group CHF 7,770 7,700 1% 7,706 1% 8,420 8,350 1% 8,390 0%<br />
Tiffany USD 3,800 3,760 1% 3,867 -2% 4,100 4,120 0% 4,201 -2%<br />
Tod's EUR 975 953 2% 966 1% 1,060 1,020 4% 1,052 1%<br />
* FY March n+1; ** FY June n+1 Source: HSBC estimates, Bloomberg consensus<br />
Summary <strong>of</strong> HSBC EBIT estimate changes <strong>and</strong> comparison with Bloomberg consensus<br />
________________ 2012e EBIT _____________<br />
_______________ 2013e EBIT __________________<br />
______ HSBC _______ HSBC vs _____ HSBC_______ HSBC vs<br />
(m) Curr. New Old Chg. Cons. consensus New Old Chg. Cons. consensus<br />
Burberry* GBP 435 436 0% 428 2% 496 495 0% 495 0%<br />
Christian Dior EUR 6,381 6,493 -2% 6,134 4% 7,301 7,291 0% 7,080 3%<br />
Coach** USD 1,633 1,853 -12% 1,662 -2% 1,865 2,144 -13% 1,876 -1%<br />
Ferragamo EUR 207 200 4% 195 6% 260 235 11% 236 10%<br />
Hengdeli CNY 1,203 1,403 -14% 1,320 -9% 1,268 1,614 -21% 1,510 -16%<br />
Hermès EUR 1,050 1,023 3% 1,014 4% 1,173 1,143 3% 1,140 3%<br />
Hugo Boss EUR 451 466 -3% 444 2% 504 524 -4% 499 1%<br />
Luxottica EUR 990 990 0% 973 2% 1,170 1,120 4% 1,108 6%<br />
LVMH EUR 6,245 6,370 -2% 6,027 4% 7,127 7,137 0% 6,621 8%<br />
PPR EUR 1,870 1,880 -1% 1,824 3% 2,193 2,160 2% 2,079 5%<br />
Prada EUR 918 900 2% 813 13% 1,137 1,068 6% 990 15%<br />
Richemont* EUR 2,296 1,977 16% 2,330 -1% 2,389 2,176 10% 2,454 -3%<br />
The Swatch Group CHF 1,936 1,900 2% 1,877 3% 2,151 2,115 2% 2,103 2%<br />
Tiffany USD 755 748 1% 762 -1% 854 855 0% 858 -1%<br />
Tod's EUR 215 208 3% 209 3% 237 225 5% 231 3%<br />
* FY March n+1; ** FY June n+1 Source: HSBC estimates, Bloomberg consensus<br />
Summary <strong>of</strong> HSBC EPS estimate changes <strong>and</strong> comparison with Bloomberg consensus<br />
_______________ 2012e EPS ______________<br />
________________2013e EPS __________________<br />
______ HSBC _______ HSBC vs _____ HSBC ______ HSBC vs<br />
(m) Curr. New Old Chg. Cons. consensus New Old Chg. Cons. consensus<br />
Burberry* GBP 72.30 72.46 0% 71.40 1% 83.14 82.98 0% 82.00 1%<br />
Christian Dior EUR 9.58 9.65 -1% 8.21 17% 10.82 10.88 -1% 9.42 15%<br />
Coach** USD 3.78 4.29 -12% 3.85 -2% 4.36 5.00 -13% 4.45 -2%<br />
Ferragamo EUR 0.66 0.67 -1% 0.62 6% 0.99 0.95 4% 0.84 17%<br />
Hengdeli CNY 0.17 0.18 -3% 0.19 -6% 0.16 0.21 -23% 0.21 -23%<br />
Hermès EUR 6.69 6.62 1% 6.33 6% 7.48 7.41 1% 7.17 4%<br />
Hugo Boss EUR 4.74 4.93 -4% 4.65 2% 5.42 5.63 -4% 5.25 3%<br />
Luxottica**** EUR 1.32 1.35 -2% 1.25 6% 1.59 1.55 3% 1.43 11%<br />
LVMH EUR 7.56 7.71 -2% 7.31 3% 8.43 8.61 -2% 8.17 3%<br />
PPR*** EUR 9.84 10.33 -5% 9.48 4% 11.72 12.20 -4% 11.07 6%<br />
Prada EUR 0.26 0.25 4% 0.23 13% 0.33 0.31 5% 0.28 17%<br />
Richemont* EUR 3.45 2.94 17% 3.31 4% 3.60 3.24 11% 3.73 -4%<br />
The Swatch Group CHF 28.47 27.95 2% 27.36 4% 31.74 31.21 2% 30.34 5%<br />
Tiffany USD 3.61 3.74 -4% 3.67 -2% 4.28 4.39 -3% 4.19 2%<br />
Tod's EUR 4.97 4.63 7% 4.84 3% 5.53 5.03 10% 5.40 2%<br />
* FY March n+1; ** FY June n+1; *** HSBC EPS for PPR <strong>in</strong>clude discont<strong>in</strong>ued bus<strong>in</strong>ess **** HSBC EPS for Luxottica is before trade-mark amortisation Source: HSBC estimates, Bloomberg consensus<br />
3
Consumer Br<strong>and</strong>s & Retail<br />
Global luxury goods<br />
September 2012<br />
abc<br />
Calendar <strong>of</strong> events<br />
<strong>Luxury</strong> goods calendar <strong>of</strong> events<br />
Company Type <strong>of</strong> Event Date<br />
Burberry H1 2012/2013 sales 11-Oct-12<br />
Burberry H1 2012/2013 results 07-Nov-12<br />
Christian Dior Q3 2012 sales No specific date forecasted<br />
Coach Q1 2013 results 30-Oct-12<br />
Ferragamo Q3 2012 results 13-Nov-12<br />
Hermès Q3 2012 sales No specific date forecasted<br />
Hugo Boss Q3 2012 results 30-Oct-12<br />
Luxottica Q3 2012 results 25-Oct-12<br />
LVMH Q3 2012 sales No specific date forecasted<br />
PPR Q3 2012 sales 25-Oct-12<br />
Prada Q2 H1 2012 results 24-Sep-12<br />
Prada Q3 2012 results 06-Dec-12<br />
Richemont 5 month sales /AGM 05-Sep-12<br />
Richemont H1 2012/2013 results 09-Nov-12<br />
Tiffany Q3 2012 results 29-Nov-12<br />
Tod's Q3 2012 results 13-Nov-12<br />
FHS Data August 2012 period 20-Sep-12<br />
FHS Data September / 9M 2012 period 18-Oct-12<br />
FHS Data October 2012 period 20-Nov-12<br />
FHS Data November 2012 period 20-Dec-12<br />
FHS Data December / FY 2012 period 04-Feb-13<br />
Source: Company data<br />
4
Consumer Br<strong>and</strong>s & Retail<br />
Global luxury goods<br />
September 2012<br />
abc<br />
Valuation <strong>and</strong> rat<strong>in</strong>gs<br />
We downgrade LVMH to N (from OW) follow<strong>in</strong>g its strong run <strong>and</strong><br />
upgrade Hermès to N (from UW)<br />
We reta<strong>in</strong> OW rat<strong>in</strong>gs on Coach, PPR, Prada, Swatch,<br />
Ferragamo, Dior, <strong>and</strong> Hengdeli<br />
We rema<strong>in</strong> focused on stock pick<strong>in</strong>g <strong>and</strong> highlight four themes to<br />
monitor over the next 12 months<br />
Rat<strong>in</strong>gs changes<br />
The most important rat<strong>in</strong>g change <strong>in</strong> this report is for<br />
LVMH, which we have downgraded from OW to N<br />
with no change <strong>in</strong> the EUR145 target price, after a<br />
strong run.<br />
We have been OW on LVMH s<strong>in</strong>ce June 2012,<br />
despite evidence that Louis Vuitton (the core EBIT<br />
contributor for the group) would structurally lose<br />
market share to competition, if only for scale<br />
reasons, as we thought the shares were undervalued<br />
after los<strong>in</strong>g 18% from its 2012 peak. Louis<br />
Vuitton’s first-mover disadvantage became more<br />
visible <strong>in</strong> 2Q, as growth rema<strong>in</strong>ed decent but slower<br />
than for its peers <strong>and</strong> <strong>in</strong>vestments <strong>in</strong> the br<strong>and</strong><br />
started to weigh on the group’s pr<strong>of</strong>itability. Whist<br />
lower estimates <strong>in</strong> fashion <strong>and</strong> leather have been<br />
broadly compensated for by positive forex effects<br />
(i.e. a weaker EUR), our target price does not imply<br />
a sufficient potential return to ma<strong>in</strong>ta<strong>in</strong> an<br />
OW rat<strong>in</strong>g.<br />
In addition, we have upgraded our rat<strong>in</strong>g for<br />
Hermès from UW to N follow<strong>in</strong>g the stock’s poor<br />
run; though we rem<strong>in</strong>d <strong>in</strong>vestors that the stock does<br />
not trade on fundamentals.<br />
Other luxury rat<strong>in</strong>gs<br />
Overweight rat<strong>in</strong>gs<br />
Our highest conviction calls are:<br />
Prada (OW V): the strongest fundamental story<br />
<strong>in</strong> the space, <strong>in</strong> our view, but valuation limits the<br />
potential return after a strong run<br />
Coach (OW V): we believe the market<br />
overreacted to 4Q results. Much <strong>of</strong> the damage<br />
was self-<strong>in</strong>flicted <strong>and</strong> as such should be<br />
temporary. In addition, we th<strong>in</strong>k the men’s <strong>and</strong><br />
Asia opportunities are strong drivers.<br />
PPR (OW): while the story <strong>of</strong> asset reallocation<br />
is start<strong>in</strong>g to unfold short term, we th<strong>in</strong>k it is still<br />
more the luxury portfolio performance that is<br />
be<strong>in</strong>g undervalued by the market.<br />
Ferragamo (OW V): despite a strong run, the<br />
company should cont<strong>in</strong>ue to generate sales <strong>and</strong><br />
marg<strong>in</strong> improvement-backed upgrades, <strong>and</strong><br />
rema<strong>in</strong>s the best small cap story <strong>in</strong> the space, <strong>in</strong><br />
our view.<br />
5
Consumer Br<strong>and</strong>s & Retail<br />
Global luxury goods<br />
September 2012<br />
abc<br />
We also have OW rat<strong>in</strong>gs on:<br />
Christian Dior (OW): the hold<strong>in</strong>g company <strong>of</strong><br />
LVMH has underperformed <strong>and</strong> now appears<br />
aga<strong>in</strong> to be a value play on LVMH’s robust<br />
fundamentals given the 28% discount to RNAV.<br />
Swatch (OW): relative to Richemont, the higher<br />
dependency on watches <strong>and</strong> wholesale makes its<br />
position<strong>in</strong>g theoretically more exposed to a<br />
macro downturn. However, we don’t see a sharp<br />
downturn as imm<strong>in</strong>ent <strong>and</strong> its lower price po<strong>in</strong>ts<br />
should make its sales more resilient.<br />
Hengdeli (OW V): a pure play on watches <strong>and</strong><br />
on Ch<strong>in</strong>a, a bit like Swatch but for the less riskaverse.<br />
Given where the stock is trad<strong>in</strong>g, we see<br />
a potentially large reward but have significantly<br />
<strong>red</strong>uced the target price on the view that Ch<strong>in</strong>ese<br />
consumption <strong>of</strong> watches has gradually shifted to<br />
markets where Hengdeli does not operate.<br />
Neutral rat<strong>in</strong>gs<br />
Richemont (N): its capacity to surprise on the<br />
upside may have been used up by the positive<br />
alert <strong>in</strong> early August <strong>and</strong> whilst 1H results<br />
should be robust as guided, underly<strong>in</strong>g sales<br />
growth may well decelerate from here <strong>and</strong> this<br />
could be unsupportive.<br />
Tod’s (N): the eponymous br<strong>and</strong> is hav<strong>in</strong>g<br />
great success <strong>in</strong> becom<strong>in</strong>g global but it looks<br />
like Hogan may cont<strong>in</strong>ue to weigh <strong>in</strong> the short<br />
term (with performance dragged by Italian<br />
consumers <strong>and</strong> ongo<strong>in</strong>g distribution<br />
streaml<strong>in</strong><strong>in</strong>g). Also, the stock benefits less than<br />
other European names from recent FX moves.<br />
Luxottica (N): capta<strong>in</strong> <strong>of</strong> the <strong>in</strong>dustry with a<br />
lot <strong>of</strong> self-help (Coach <strong>and</strong> Armani licenses,<br />
M&A, retail marg<strong>in</strong> recovery <strong>and</strong> FX), but<br />
valuation is unattractive, <strong>in</strong> our view.<br />
Hugo Boss (N V): slower growth <strong>in</strong> Asia, more<br />
limited operat<strong>in</strong>g leverage <strong>and</strong> high exposure to<br />
wholesale <strong>and</strong> Europe make this stock fairly<br />
valued at current levels, we believe.<br />
Tiffany (N V): 4Q represents a huge sw<strong>in</strong>g factor<br />
(40-45% <strong>of</strong> annual pr<strong>of</strong>its). Comps should be<br />
favourable, but this may not be enough for the<br />
company to achieve its new FY12 guidance<br />
(already revised twice) as trad<strong>in</strong>g-down by<br />
consumers may not be over <strong>in</strong> the US, its FX<br />
exposure is unfavourable, <strong>and</strong> its Asian<br />
developments are not as quick as for peers.<br />
Sentiment <strong>and</strong> valuation<br />
Still <strong>in</strong> stock pick<strong>in</strong>g mode<br />
Whilst the sector has tended to move together <strong>in</strong> the<br />
past 18 months with a de-rat<strong>in</strong>g <strong>in</strong> the fall <strong>of</strong> 2011 on<br />
the back <strong>of</strong> fears <strong>of</strong> a hard l<strong>and</strong><strong>in</strong>g for Ch<strong>in</strong>a, a rerat<strong>in</strong>g<br />
early <strong>in</strong> 2012 on greater confidence, a pullback<br />
<strong>in</strong> 2Q, <strong>and</strong> then another leg up dur<strong>in</strong>g this summer,<br />
we believe there are reasons for stocks to behave<br />
differently short term. Indeed we feel that as growth<br />
stabilises, there will be market share ga<strong>in</strong>ers <strong>and</strong><br />
losers, companies better positioned to capture tourism<br />
trends, <strong>and</strong> w<strong>in</strong>ners <strong>and</strong> losers on currency impacts.<br />
The outperformers YTD are Ferragamo (+71%),<br />
Prada (+71%) <strong>and</strong> Tod’s (+34%); the<br />
underperformers are Hengdeli (-14%), Coach<br />
(-9%) <strong>and</strong> Tiffany (-7%).<br />
Burberry (N V): the lack <strong>of</strong> operat<strong>in</strong>g leverage<br />
despite strong sales growth may now become an<br />
issue especially s<strong>in</strong>ce Prada <strong>and</strong> Ferragamo have<br />
been listed <strong>and</strong> display both. Some clarity is<br />
needed on ways to operate <strong>in</strong> perfumes <strong>and</strong><br />
cosmetics <strong>and</strong> to term<strong>in</strong>ate the Japanese license,<br />
we believe.<br />
6
Consumer Br<strong>and</strong>s & Retail<br />
Global luxury goods<br />
September 2012<br />
abc<br />
Valuation<br />
<strong>Luxury</strong> goods sector performance vs FTSE Eur<strong>of</strong>irst 300<br />
While the sector’s valuation (at a high teens forward<br />
PE) is not that dem<strong>and</strong><strong>in</strong>g from a historical st<strong>and</strong>po<strong>in</strong>t,<br />
we believe there would need to be strong visibility on<br />
growth outside <strong>of</strong> Ch<strong>in</strong>ese consumers to justify<br />
280<br />
240<br />
200<br />
160<br />
120<br />
significant multiple expansion from here.<br />
80<br />
We cont<strong>in</strong>ue to value all stocks on a DCF basis<br />
(except for PPR which we value by sum-<strong>of</strong>-the-parts)<br />
<strong>and</strong> use a sector beta <strong>of</strong> 1.2 to reflect the fact that<br />
Lux ury Goods Index<br />
40<br />
Jan-<br />
02<br />
Jan-<br />
03<br />
Jan- Jan- Jan- Jan-<br />
04 05 06 07<br />
Jan-<br />
08<br />
Jan- Jan- Jan- Jan-<br />
09 10 11 12<br />
FTSE 300 Price <strong>in</strong>dex<br />
luxury stocks historically have tended to trade at a<br />
Source: Thomson Reuters Datastream<br />
discount to their long-term fundamental valuation<br />
when earn<strong>in</strong>gs momentum is slow<strong>in</strong>g, which will<br />
happen shortly, <strong>in</strong> our view.<br />
Sector valuation history (forward PE)<br />
40.0 x<br />
2000 bubble<br />
35.0 x<br />
30.0 x<br />
25.0 x<br />
20.0 x<br />
SRAS<br />
epidemic<br />
Ch<strong>in</strong>a starts<br />
to matter<br />
2007 market<br />
peak<br />
15.0 x<br />
10.0 x<br />
5.0 x<br />
Asian f<strong>in</strong>ancial<br />
crisis<br />
09/11 attacks<br />
Post-Lehman collapse<br />
0.0 x<br />
Jun-97 Aug-98 Oct-99 Dec-00 Feb-02 Apr-03 Jun-04 Aug-05 Oct-06 Dec-07 Feb-09 Apr-10 Jun-11 Aug-12<br />
Source: FactSet, HSBC<br />
Share price performances - <strong>Luxury</strong> goods stocks<br />
FY01 FY02 FY03 FY04 FY05 FY06 FY07 FY08 FY09 FY10 Q1 11 Q2 11 Q3 11 Q4 11 FY11 Q1 12 Q2 12 Q3 TD* FY12TD*<br />
LVMH -35 -14 47 -2 33 7 3 -42 64 57 -9 11 -20 10 -11 18 -7 11 22<br />
Hermes 15 -24 17 -4 44 35 -9 16 -7 68 -1 32 11 2 47 10 -4 -9 -4<br />
Richemont -29 -16 15 27 52 24 10 -74 71 58 -3 4 -26 15 -14 20 45 -27 27<br />
The Swatch Group -26 -23 29 12 17 37 27 -57 80 59 -3 4 -29 15 -17 19 -10 8 16<br />
Christian Dior -32 -7 50 4 50 8 11 -55 78 49 -7 9 -22 8 -14 26 -6 8 28<br />
Burberry nm -2 63 10 5 54 -12 -61 170 88 4 24 -19 1 6 26 -11 3 15<br />
Tod's 6 -34 13 1 63 7 -22 -37 72 42 13 11 -31 -1 -15 34 -6 7 34<br />
PPR -37 -52 9 -4 29 19 -3 -58 81 41 -9 13 -21 14 -7 17 -13 13 14<br />
Luxottica 20 -32 9 9 43 9 -7 -42 42 26 1 -4 -13 13 -5 25 6 5 33<br />
Hugo Boss 90 -58 59 54 21 31 0 -58 70 130 4 19 -14 -6 1 52 -10 -4 32<br />
Ferragamo** nm nm nm nm nm nm nm nm nm nm nm 14 -3 2 13 53 6 6 71<br />
Average -6 -28 34 12 33 22 -1 -47 68 60 4 12 -17 7 -1 27 -1 2 26<br />
Eurotop 300 -18 -32 12 9 22 16 2 -45 26 7 0 -1 -17 8 -11 9 -4 7 9<br />
Prada** nm nm nm nm nm nm nm nm nm nm nm 19 -30 5 -12 46 2 15 71<br />
Hengdeli nm nm nm nm nm 220 37 -73 268 57 -11 0 -34 -7 -46 31 -26 -11 -14<br />
Hang Seng Index -24 -18 35 13 5 34 39 -48 52 5 2 -5 -21 5 -20 12 -5 2 7<br />
Tiffany -1 -24 89 -29 20 2 17 -42 61 45 -1 28 -23 11 8 3 -23 18 -7<br />
Coach 36 69 129 49 18 29 -29 -32 76 52 -6 23 -19 19 11 -9 -24 -4 -9<br />
S&P 500 -13 -23 26 9 3 14 4 -38 23 13 5 0 -14 11 0 12 -3 4 12<br />
*Share prices at 27 August 2012 ** Prada's IPO on 23 June 2011, **Ferragamo's IPO on 18 June 2011 Source: Thomson Reuters Datastream<br />
7
Consumer Br<strong>and</strong>s & Retail<br />
Global luxury goods<br />
September 2012<br />
abc<br />
Rais<strong>in</strong>g global estimates<br />
slightly for 2012 with regional<br />
rebalanc<strong>in</strong>g<br />
As Ch<strong>in</strong>ese consumers make <strong>in</strong>crementally more<br />
luxury purchases abroad <strong>and</strong> this phenomenon has<br />
accelerated <strong>in</strong> Europe with the sharp weaken<strong>in</strong>g <strong>of</strong><br />
the EUR, we have seen lower-than-expected growth<br />
<strong>in</strong> Ch<strong>in</strong>a <strong>and</strong> have reflected this <strong>in</strong> our estimates.<br />
Conversely, European markets are supported by<br />
these tourism flows <strong>and</strong> the US did much better than<br />
we expected six months ago. Apart from a few<br />
exceptions (Burberry US distribution streaml<strong>in</strong><strong>in</strong>g,<br />
Coach outlet issue <strong>and</strong> Tiffany pr<strong>of</strong>it warn<strong>in</strong>gs),<br />
trends have generally been very solid. Japan rema<strong>in</strong>s<br />
the cash cow <strong>of</strong> the sector, with prospects for luxury<br />
dem<strong>and</strong> <strong>in</strong> that country look<strong>in</strong>g better than 18<br />
months ago. F<strong>in</strong>ally Asia ex-Japan <strong>and</strong> ex-Ch<strong>in</strong>a has<br />
held up <strong>in</strong> l<strong>in</strong>e with our estimates.<br />
Trimm<strong>in</strong>g estimates for ma<strong>in</strong>l<strong>and</strong> Ch<strong>in</strong>a…<br />
In March 2012, we facto<strong>red</strong> <strong>in</strong> organic sales growth<br />
<strong>of</strong> 33% for the year <strong>in</strong> ma<strong>in</strong>l<strong>and</strong> Ch<strong>in</strong>a. Note this is<br />
an aggregate <strong>of</strong> all stocks we cover with no<br />
weight<strong>in</strong>g. Follow<strong>in</strong>g evidence <strong>of</strong> a transfer <strong>of</strong><br />
growth from Ch<strong>in</strong>a to Europe but also to a lesser<br />
extent <strong>of</strong> lower growth <strong>in</strong> sales to Ch<strong>in</strong>ese nationals,<br />
we have lowe<strong>red</strong> our estimate for growth <strong>in</strong><br />
ma<strong>in</strong>l<strong>and</strong> Ch<strong>in</strong>a to 19%.<br />
…but <strong>in</strong>creas<strong>in</strong>g estimates for the West<br />
In Europe, despite the economic uncerta<strong>in</strong>ties,<br />
bus<strong>in</strong>ess has been stronger than expected, as<br />
tourism flows (mostly, but not only, Ch<strong>in</strong>ese<br />
visitors) have been very supportive; all the more so<br />
as the EUR has weakened significantly aga<strong>in</strong>st<br />
most currencies over 1H12. We now believe that<br />
for the sector as a whole, more than half <strong>of</strong> the<br />
dem<strong>and</strong> for luxury products <strong>in</strong> Europe is bought by<br />
non-locals. We have <strong>in</strong>creased estimates for<br />
organic growth from 5% last March to 7%.<br />
In the US so far, we have not seen a psychological<br />
shock <strong>of</strong> the magnitude <strong>of</strong> that which accompanied<br />
the collapse <strong>of</strong> Lehman <strong>in</strong> September 2008, which<br />
expla<strong>in</strong>s why trends <strong>in</strong> luxury consumption <strong>in</strong> the<br />
US have cont<strong>in</strong>ued to outperform overall consumer<br />
trends. Whilst it is difficult to assess the impact <strong>of</strong><br />
the fiscal cliff that the US faces, as well as the<br />
upcom<strong>in</strong>g elections on luxury dem<strong>and</strong>, what we<br />
<strong>Luxury</strong> goods: contribution <strong>of</strong> each geographic region to organic sales growth<br />
2007 2008 2009 2010 2011 1H12 2H12e 2012e 2013e<br />
Geographic breakdown<br />
Europe 42% 42% 39% 36% 34% 33% 33% 33% 31%<br />
Japan 12% 12% 11% 9% 8% 8% 8% 8% 7%<br />
US 20% 19% 18% 18% 18% 18% 18% 18% 18%<br />
Ch<strong>in</strong>a 3% 5% 6% 8% 10% 10% 10% 10% 11%<br />
Rest <strong>of</strong> Asia & other 22% 23% 25% 28% 29% 31% 31% 31% 32%<br />
Total 100% 100% 100% 100% 100% 100% 100% 100% 100%<br />
Organic sales growth rate<br />
Europe 13% 5% -7% 9% 12% 9% 5% 7% 4%<br />
Japan 6% -9% -15% -4% 4% 5% 2% 4% 3%<br />
US 16% 2% -14% 14% 24% 17% 9% 13% 9%<br />
Ch<strong>in</strong>a 40% 45% 30% 45% 47% 28% 10% 19% 20%<br />
Rest <strong>of</strong> Asia & other 22% 13% 8% 23% 27% 17% 10% 13% 12%<br />
Total 15% 6% -4% 15% 20% 14% 7% 11% 9%<br />
Contribution to growth<br />
Europe 5.1% 1.9% -2.8% 3.1% 4.4% 3.1% 1.6% 2.4% 1.3%<br />
Japan 0.9% -1.1% -1.8% -0.5% 0.4% 0.4% 0.2% 0.3% 0.2%<br />
US 3.5% 0.3% -2.7% 2.4% 4.3% 3.1% 1.6% 2.3% 1.6%<br />
Ch<strong>in</strong>a 1.2% 1.5% 1.4% 3.4% 3.6% 2.7% 1.0% 1.9% 2.1%<br />
Rest <strong>of</strong> Asia & other 4.7% 2.9% 1.8% 6.4% 7.8% 5.0% 3.0% 3.9% 3.8%<br />
Total 15% 6% -4% 15% 20% 14% 7% 11% 9%<br />
Source: HSBC estimates<br />
8
Consumer Br<strong>and</strong>s & Retail<br />
Global luxury goods<br />
September 2012<br />
abc<br />
have seen is a discrepancy <strong>of</strong> trends between value<br />
position<strong>in</strong>g (see Coach outlets disappo<strong>in</strong>tment) <strong>and</strong><br />
dem<strong>and</strong> on higher price po<strong>in</strong>ts.<br />
All <strong>in</strong>, we have <strong>in</strong>creased our sales growth estimates<br />
from 4% <strong>in</strong> March to 13% now not so much on<br />
tourism flows <strong>in</strong>creas<strong>in</strong>g but more on greater<br />
growth com<strong>in</strong>g from a buoyant high end local<br />
consumer dem<strong>and</strong> <strong>in</strong> the US.<br />
Asia ex-Japan ex-Ch<strong>in</strong>a sales solid as ever…<br />
Whilst some markets (Taiwan, Korea, S<strong>in</strong>gapore<br />
<strong>and</strong> Hong Kong) are see<strong>in</strong>g growth rates<br />
decelerat<strong>in</strong>g, they are still at hefty levels for some<br />
players.<br />
As we expla<strong>in</strong> later <strong>in</strong> this report, Taiwan can<br />
theoretically become a rival to Hong Kong <strong>in</strong> lur<strong>in</strong>g<br />
ma<strong>in</strong>l<strong>and</strong> Ch<strong>in</strong>ese with notably better service.<br />
Korea, as we described <strong>in</strong> our recent report Korea<br />
<strong>Luxury</strong> - Still boom<strong>in</strong>g or lost its ‘Seoul’?, is<br />
suffer<strong>in</strong>g from polarisation but the high end is still<br />
do<strong>in</strong>g well. Hong Kong is suffer<strong>in</strong>g from slow<strong>in</strong>g<br />
tourism <strong>in</strong>flows, driven by shift<strong>in</strong>g Ch<strong>in</strong>ese<br />
consumption patterns, <strong>in</strong>sufficient accommodation<br />
capacity <strong>and</strong> a gradual decl<strong>in</strong>e <strong>in</strong> the city’s status as<br />
an upmarket shopp<strong>in</strong>g dest<strong>in</strong>ation <strong>in</strong> the eyes <strong>of</strong><br />
Ch<strong>in</strong>ese consumers. Whilst they are not big<br />
contributors yet, countries like Vietnam <strong>and</strong><br />
Indonesia are beg<strong>in</strong>n<strong>in</strong>g to appear on the radar<br />
screen, support<strong>in</strong>g growth for the region as a whole.<br />
… <strong>and</strong> even Japan sales are not that bad really<br />
Despite the devastation caused by the March<br />
2011 tsunami, Japanese sales trends were<br />
slightly positive for most players <strong>in</strong> our<br />
coverage <strong>in</strong> 2011. While we expected this<br />
stabilisation to cont<strong>in</strong>ue <strong>in</strong> 2012 with 2%<br />
average organic sales growth facto<strong>red</strong> <strong>in</strong> for<br />
the year, we now believe that Japan should<br />
show better growth still at 4%.<br />
No doubt Japan appears to be the sector’s cash<br />
cow, enabl<strong>in</strong>g many groups to f<strong>in</strong>ance growth<br />
elsewhere, but the recent trends have been<br />
surpris<strong>in</strong>gly resilient with br<strong>and</strong>s adapt<strong>in</strong>g their<br />
distribution strategy (more freest<strong>and</strong><strong>in</strong>g<br />
locations, less department store reliance).<br />
Strong FX tailw<strong>in</strong>ds<br />
Who said FX was irrelevant? When Richemont put<br />
out a positive alert <strong>in</strong> early August, the group<br />
mentioned that 1H EBIT would <strong>in</strong>crease 20-40%<br />
with an important impact <strong>of</strong> currency. The stock<br />
s<strong>in</strong>ce that announcement has had a 7% run.<br />
Currency rema<strong>in</strong>s key for this sector with European<br />
listed companies benefit<strong>in</strong>g from the current EUR<br />
weakness, Tiffany suffer<strong>in</strong>g from the same <strong>and</strong><br />
Prada not be<strong>in</strong>g much <strong>in</strong>fluenced (P&L benefits but<br />
shares don’t as they are HKD-denom<strong>in</strong>ated).<br />
Look<strong>in</strong>g at the chart below, the EUR/USD shift has<br />
been quite sudden <strong>and</strong> seems to have broadly<br />
stabilised over the past two months. This has<br />
several implications: one is that management teams<br />
will probably look at this stability <strong>and</strong> address price<br />
discrepancies between Europe <strong>and</strong> Ch<strong>in</strong>a by rais<strong>in</strong>g<br />
prices <strong>in</strong> Europe; the other, f<strong>in</strong>ancial, is that<br />
operat<strong>in</strong>g pr<strong>of</strong>it for the European listed companies<br />
will be boosted by higher pr<strong>of</strong>its from their non-<br />
EUR denom<strong>in</strong>ated subsidiaries.<br />
We take <strong>in</strong>to account recent average spot rates for<br />
our models. We are thus us<strong>in</strong>g EUR/USD <strong>of</strong> 1.25,<br />
EUR/CHF <strong>of</strong> 1.20, EUR/JPY <strong>of</strong> 100 <strong>and</strong> GBP/EUR<br />
<strong>of</strong> 1.25.<br />
EUR/USD s<strong>in</strong>ce 1 January 2005<br />
1.65<br />
1.55<br />
1.45<br />
1.35<br />
1.25<br />
1.15<br />
Jan-05 Jan-06 Jan-07 Jan-08 Jan-09 Jan-10 Jan-11 Jan-12<br />
Source: Thomson Reuters Datastream<br />
9
Consumer Br<strong>and</strong>s & Retail<br />
Global luxury goods<br />
September 2012<br />
abc<br />
Themes for the next 12 months<br />
In our October 2011 Around the world, around the<br />
world <strong>and</strong> our March 2012 Stop, look, listen reports we<br />
identified broad themes for the sector. Some <strong>of</strong> these<br />
are still quite relevant today, <strong>in</strong> particular (<strong>and</strong> <strong>in</strong> order<br />
<strong>of</strong> importance):<br />
Travel<br />
S<strong>in</strong>ce October 2011, we have argued that it is more<br />
relevant to look at the luxury sector <strong>in</strong> terms <strong>of</strong> sales<br />
by nationality <strong>in</strong>stead <strong>of</strong> sales by region as the luxury<br />
consumer <strong>and</strong> notably the Ch<strong>in</strong>ese, Russian, Indian,<br />
Brazilian, Middle Eastern consumers purchase more<br />
abroad than at home.<br />
Obviously this is not the way the companies report<br />
their numbers but it does appear <strong>in</strong> our view to be the<br />
most relevant way to th<strong>in</strong>k about the sector. The<br />
importance <strong>of</strong> this theme has led to a few negative<br />
surprises (e.g. Louis Vuitton <strong>in</strong>creas<strong>in</strong>g sales by<br />
“only” a s<strong>in</strong>gle digit <strong>in</strong> ma<strong>in</strong>l<strong>and</strong> Ch<strong>in</strong>a as Ch<strong>in</strong>ese<br />
purchase goods abroad; Hengdeli sales growth<br />
decelerat<strong>in</strong>g more than we expected).<br />
As expla<strong>in</strong>ed later on <strong>in</strong> this report, we expect travel to<br />
become even more important <strong>in</strong> the future, as beyond<br />
the current FX <strong>in</strong>centive, there are <strong>in</strong>creas<strong>in</strong>gly more<br />
reasons for consumers to purchase luxury<br />
products abroad.<br />
Polarisation or first-mover disadvantage<br />
We do not see trad<strong>in</strong>g-down <strong>in</strong> luxury spend<strong>in</strong>g<br />
(consumers that want to buy a Patek would not<br />
settle for a Swatch) but we do believe that the core<br />
br<strong>and</strong>s with accessible price po<strong>in</strong>ts (Louis Vuitton,<br />
Gucci <strong>and</strong> Omega) will lose share.<br />
M&A / use <strong>of</strong> cash<br />
Despite stepp<strong>in</strong>g up capex, most companies <strong>in</strong> the<br />
sector will be faced with cash piles sooner or later.<br />
Richemont <strong>and</strong> Swatch already are <strong>in</strong> substantial net<br />
cash positions, <strong>and</strong> other groups should get there<br />
quickly. We doubt, however, that any sizeable deal<br />
is imm<strong>in</strong>ent <strong>and</strong> we believe <strong>in</strong>vestors should<br />
remember that synergies are scarce <strong>in</strong> the luxury<br />
<strong>in</strong>dustry, thus limit<strong>in</strong>g the potential for value<br />
creation via M&A. Dividend hikes or buy-backs are<br />
likely occurrences.<br />
Currency<br />
This is a recurr<strong>in</strong>g macro theme <strong>in</strong> luxury <strong>and</strong><br />
depend<strong>in</strong>g on one’s house view a potential<br />
differentiator between the cont<strong>in</strong>ental European<br />
stocks (which should ga<strong>in</strong> from a weak EUR if spot<br />
rates rema<strong>in</strong> at current levels), Burberry (which<br />
should ga<strong>in</strong> slightly from a weak GBP) <strong>and</strong> the US<br />
stocks (which should suffer from a strong USD),<br />
Tiffany, <strong>in</strong> our coverage, as Coach is barely<br />
exposed to EUR-denom<strong>in</strong>ated sales.<br />
Sales growth at constant forex <strong>and</strong> perimeter<br />
% FY00 FY01 FY02 FY03 FY04 FY05 FY06 FY07 FY08 FY09 FY10 1Q11 2Q11 3Q11 4Q11e FY11 1Q12 2Q12e FY12e FY13e FY14e<br />
Hermès 14 8 6 8 12 7 8 11 9 4 19 21 22 18 14 18 18 13 13 11 9<br />
LVMH 8 4 4 4 11 11 12 13 7 -3 14 14 15 15 12 14 14 10 9 8 8<br />
<strong>of</strong> which Louis Vuitton 20 12 7 14 13 12 11 14 12 7 15 12 14 17 15 15 12 6 7 7 7<br />
Richemont** 13 0 0 0 13 17 16 16 2 -5 19 13 35 37 24 30 25 na 8 6 7<br />
Swatch Group 12 1 1 1 6 8 12 17 4 -8 22 23 25 21 19 22 16 12 11 8 7<br />
Burberry** 40 14 12 15 10 3 15 19 7 1 15 10 24 26 21 21 15 11 13 12 11<br />
PPR <strong>Luxury</strong> na na na 5 13 16 18 15 8 -4 12 22 24 25 19 22 18 17 14 11 9<br />
Gucci br<strong>and</strong> 24 1 -8 4 13 18 17 11 4 -1 11 20 23 21 12 19 12 10 9 8 8<br />
Hengdeli na na na na na na na na 20 7 39 na 46 na 30 38 na 6 5 8 13<br />
Prada na na na na na na na na na -6 24 na 24 na 26 25 41 19 28 14 12<br />
Tod's 15 27 13 8 15 20 14 17 9 0 9 16 17 14 8 14 7 8 6 8 7<br />
Luxottica na na 3 -2 11 11 14 10 -1 -4 7 9 10 10 11 9 9 5 9 8 8<br />
Tiffany 13 0 4 14 8 9 11 13 -4 -5 12 16 24 17 7 15 8 2 5 8 8<br />
Coach*** 12 21 32 37 29 26 29 20 -1 9 14 14 19 13 13 13 16 9 9 11 12<br />
Hugo Boss na na na na 13 12 14 12 6 -8 5 19 29 16 17 19 10 14 9 8 8<br />
Ferragamo na na na na na na na na na -10 17 26 34 19 20 24 19 17 16 13 11<br />
*half-year **year end<strong>in</strong>g March n+1 ***year end<strong>in</strong>g June n+1<br />
Source : Company data, HSBC estimates<br />
10
Consumer Br<strong>and</strong>s & Retail<br />
Global luxury goods<br />
September 2012<br />
abc<br />
Ch<strong>in</strong>a to rema<strong>in</strong> the<br />
dom<strong>in</strong>ant <strong>in</strong>fluence<br />
The Ch<strong>in</strong>ese consumer has been more <strong>in</strong>fluential than expected for<br />
the luxury sector<br />
Social / cultural trends are supportive to the po<strong>in</strong>t where we wonder if<br />
Ch<strong>in</strong>ese luxury consumption can really be regarded as discretionary<br />
Market penetration rema<strong>in</strong>s low<br />
Ch<strong>in</strong>a: from dream to reality<br />
Faster, higher, stronger<br />
It’s like Groundhog Day: every day for the past 15<br />
years, the luxury goods sector has been wak<strong>in</strong>g up<br />
<strong>and</strong> talk<strong>in</strong>g about Ch<strong>in</strong>a. In the late 1990s, the<br />
<strong>in</strong>dustry (<strong>and</strong> some <strong>of</strong> us were part <strong>of</strong> it then) was<br />
talk<strong>in</strong>g obsessively about Ch<strong>in</strong>a though it was a<br />
mere dream, i.e. irrelevant to the companies’ figures.<br />
Over only the past three years s<strong>in</strong>ce we published the<br />
first Red bull report, Ch<strong>in</strong>a has gone from be<strong>in</strong>g a<br />
tangible to a dom<strong>in</strong>ant reality for the sector. We<br />
believe sales contributions from Ch<strong>in</strong>a are greater<br />
than what most luxury CEOs had hoped for three<br />
years ago. And whilst some <strong>in</strong>vestors are probably<br />
fed up <strong>of</strong> listen<strong>in</strong>g to how the Ch<strong>in</strong>ese consumer is<br />
<strong>in</strong>fluenc<strong>in</strong>g the future <strong>of</strong> the <strong>in</strong>dustry, we would<br />
argue that it is really worth pay<strong>in</strong>g attention now.<br />
<strong>Luxury</strong> goods companies - 2011 geographical sales breakdown<br />
Europe Americas Japan Asia & others Ma<strong>in</strong>l<strong>and</strong> Ch<strong>in</strong>a HK + Taiwan + Macau Rest <strong>of</strong> Asia & others<br />
Hermès 37% 16% 17% 30% 7% 13% 10%<br />
Richemont* 35% 14% 10% 41% 12% 17% 12%<br />
LVMH 33% 22% 8% 37% 10% 9% 18%<br />
<strong>of</strong> which Louis Vuitton 25% 19% 16% 40% 11% 13% 16%<br />
PPR 32% 19% 12% 36% 7% 7% 22%<br />
<strong>of</strong> which Gucci Br<strong>and</strong> 25% 21% 14% 40% 12% 11% 17%<br />
Burberry* 34% 25% 4% 37% 10% 9% 18%<br />
Tod's 70% 7% 4% 19% 5% 7% 7%<br />
The Swatch Group 34% 8% 2% 56% 19% 19% 18%<br />
Luxottica 23% 61% 2% 14% 2% 1% 11%<br />
Ferragamo 24% 27% 13% 36% 10% 10% 16%<br />
Hugo Boss 60% 22% 2% 16% 9% 2% 5%<br />
European average 38% 22% 7% 32% 9% 9% 14%<br />
Coach** 1% 72% 17% 10% 3% 3% 4%<br />
Tiffany*** 11% 49% 17% 22% 5% 8% 9%<br />
Hengdeli 0% 0% 0% 100% 69% 31% 0%<br />
Prada*** 37% 14% 10% 39% 11% 11% 17%<br />
Total average 31% 25% 8% 35% 12% 11% 12%<br />
Note: this average <strong>in</strong>clud<strong>in</strong>g PPR (rather than the Gucci Group) *FY March 12 **FY June 12 ***FY Jan 2012<br />
Source: Company data, HSBC<br />
11
Consumer Br<strong>and</strong>s & Retail<br />
Global luxury goods<br />
September 2012<br />
abc<br />
Ten years ago, Japan exposure was the talk <strong>of</strong> the<br />
town <strong>in</strong> the luxury world. Today, questions<br />
regard<strong>in</strong>g spend<strong>in</strong>g by Ch<strong>in</strong>ese nationals as a<br />
percentage <strong>of</strong> global sales, the def<strong>in</strong>ition <strong>of</strong> Greater<br />
Ch<strong>in</strong>a as a market, Ch<strong>in</strong>a outbound travel, <strong>and</strong> capex<br />
<strong>in</strong> the ma<strong>in</strong>l<strong>and</strong>, Hong Kong <strong>and</strong> Macau have<br />
become st<strong>and</strong>ard even for companies like Coach,<br />
Luxottica <strong>and</strong> Ralph Lauren for which Ch<strong>in</strong>a is not<br />
yet that significant relative to other markets.<br />
Prior to 2007, less than 3% <strong>of</strong> luxury sales took<br />
place <strong>in</strong> ma<strong>in</strong>l<strong>and</strong> Ch<strong>in</strong>a <strong>and</strong> probably less than 5%<br />
were driven by Ch<strong>in</strong>ese nationals all <strong>in</strong>. The<br />
ma<strong>in</strong>l<strong>and</strong>’s contribution pretty much tripled <strong>in</strong> four<br />
years (to 9% <strong>of</strong> European luxury sales <strong>in</strong> 2011) <strong>and</strong><br />
more importantly ma<strong>in</strong>l<strong>and</strong> Ch<strong>in</strong>ese contribution<br />
(i.e. sales to Ch<strong>in</strong>ese irrespective <strong>of</strong> the place <strong>of</strong><br />
purchase) is now <strong>in</strong> excess <strong>of</strong> 25% for most<br />
companies we cover. For some – th<strong>in</strong>k the Swatch<br />
Group, Richemont, Prada – Ch<strong>in</strong>ese consumers<br />
should account for much more than one-third <strong>of</strong><br />
sales, clearly not someth<strong>in</strong>g that can be disregarded<br />
<strong>in</strong> their <strong>in</strong>vestment case.<br />
Whilst one can only hope that the debate, hav<strong>in</strong>g<br />
moved from Japan to Ch<strong>in</strong>a, will move aga<strong>in</strong> from<br />
Ch<strong>in</strong>a to say, Brazil or Indonesia, we doubt that will<br />
happen soon. Sales to the Ch<strong>in</strong>ese should rema<strong>in</strong><br />
dom<strong>in</strong>ant <strong>in</strong> the space for the foreseeable future,<br />
although luxury consumption <strong>in</strong> Ch<strong>in</strong>a is slow<strong>in</strong>g for<br />
reasons we will expla<strong>in</strong> <strong>in</strong> this report.<br />
The real debate is how the sector’s substantial<br />
exposure to Ch<strong>in</strong>a <strong>and</strong> the growth l<strong>in</strong>ked to this<br />
exposure trade <strong>of</strong>f aga<strong>in</strong>st the need to ma<strong>in</strong>ta<strong>in</strong><br />
geographical diversity. The pric<strong>in</strong>g power <strong>of</strong> luxury<br />
br<strong>and</strong>s is derived from the perception that they are<br />
universal. If they become perceived as be<strong>in</strong>g “too<br />
Ch<strong>in</strong>ese” like what was seen <strong>in</strong> Japan years ago, this<br />
may be an issue. But we’ll come to that later.<br />
Not a bad <strong>in</strong>vestment<br />
Unlike many <strong>in</strong>dustries, a luxury goods bus<strong>in</strong>ess <strong>in</strong><br />
Ch<strong>in</strong>a can prove to be pr<strong>of</strong>itable very quickly, at<br />
least on a four walls basis (i.e. exclud<strong>in</strong>g regional<br />
HQ costs). We believe the advantages <strong>of</strong> do<strong>in</strong>g<br />
bus<strong>in</strong>ess <strong>in</strong> Ch<strong>in</strong>a <strong>in</strong>clude:<br />
Prices higher than <strong>in</strong> the Western world, <strong>in</strong> most<br />
cases more than cover<strong>in</strong>g extra costs <strong>of</strong> shipp<strong>in</strong>g<br />
<strong>and</strong> duties. The gross marg<strong>in</strong> <strong>in</strong> Ch<strong>in</strong>a should,<br />
therefore, be higher than the global average for a<br />
luxury br<strong>and</strong>.<br />
In terms <strong>of</strong> SG&A expenses, Ch<strong>in</strong>ese operations<br />
can benefit from local sourc<strong>in</strong>g <strong>of</strong> fixtures <strong>and</strong><br />
fitt<strong>in</strong>gs for stores, more attractive rents than <strong>in</strong><br />
the Western world <strong>and</strong> lower personnel costs<br />
(mostly store staff), represent<strong>in</strong>g less as a<br />
percentage <strong>of</strong> sales than the global average. In<br />
addition, stores are open longer hours <strong>and</strong> staff<br />
regulations are more flexible than <strong>in</strong> Europe.<br />
In recent years, rents have exploded <strong>in</strong> Hong Kong<br />
<strong>and</strong> New York to levels that make it difficult for<br />
small br<strong>and</strong>s to operate <strong>in</strong> a pr<strong>of</strong>itable manner; this is<br />
not the case <strong>in</strong> ma<strong>in</strong>l<strong>and</strong> Ch<strong>in</strong>a yet. Besides this,<br />
unlike <strong>in</strong> some European cities, there is no “key<br />
money” to be paid <strong>in</strong> Ch<strong>in</strong>a for a new lease. Look<strong>in</strong>g<br />
at the rents below, Guangzhou is the second priciest<br />
city after Beij<strong>in</strong>g (at USD590 per sq ft) <strong>and</strong> ahead <strong>of</strong><br />
Shanghai, very much lower though than many <strong>of</strong> the<br />
world’s capital cities.<br />
Top 10 highest retail store rental prices <strong>in</strong> the world: 1Q12<br />
City<br />
Annual rent per square foot (USD)<br />
Hong Kong 3,864<br />
New York 2,475<br />
Sydney 1,112<br />
Tokyo 1,025<br />
London 956<br />
Zurich 853<br />
Melbourne 837<br />
Paris 779<br />
Moscow 739<br />
Beij<strong>in</strong>g 655<br />
Source: CBRE<br />
12
Consumer Br<strong>and</strong>s & Retail<br />
Global luxury goods<br />
September 2012<br />
abc<br />
On the downside, however:<br />
Advertis<strong>in</strong>g spend as a percentage <strong>of</strong> sales, at<br />
least <strong>in</strong> the <strong>in</strong>itial phase, will likely be greater<br />
than the global average as br<strong>and</strong>s endeavour to<br />
build consumer awareness.<br />
Central costs (<strong>in</strong>clud<strong>in</strong>g subsidiary HQ <strong>and</strong><br />
potential senior staff expat packages) are<br />
difficult to leverage unless the br<strong>and</strong> achieves a<br />
significant footpr<strong>in</strong>t <strong>in</strong> the country.<br />
The larger br<strong>and</strong>s are bound to be more pr<strong>of</strong>itable as<br />
their greater footpr<strong>in</strong>t enables them to leverage many<br />
<strong>of</strong> the central costs <strong>of</strong> do<strong>in</strong>g bus<strong>in</strong>ess <strong>in</strong> Ch<strong>in</strong>a.<br />
Moreover, as hotels, department stores <strong>and</strong> mall<br />
developers underst<strong>and</strong> the power <strong>of</strong> attraction held<br />
by luxury br<strong>and</strong>s with up-<strong>and</strong>-com<strong>in</strong>g consumers,<br />
usually l<strong>and</strong>lords tend to give lead<strong>in</strong>g br<strong>and</strong>s<br />
preferential rents (or lower concessionaire rates) or<br />
even <strong>in</strong> some <strong>in</strong>stances <strong>of</strong>fer a free year or two to<br />
ensure the br<strong>and</strong> actually is part <strong>of</strong> their future<br />
development project.<br />
As shown <strong>in</strong> the theoretical P&L, while smaller<br />
br<strong>and</strong>s can f<strong>in</strong>d Ch<strong>in</strong>a development costly <strong>and</strong><br />
hazardous, the larger br<strong>and</strong>s enjoy pr<strong>of</strong>itability on a<br />
par with the rest <strong>of</strong> the world, if not greater.<br />
Although theoretically gross marg<strong>in</strong> levels may be<br />
higher, the lack <strong>of</strong> operat<strong>in</strong>g leverage on costs can be<br />
quite damag<strong>in</strong>g for a small br<strong>and</strong> or one <strong>in</strong> the <strong>in</strong>itial<br />
stages <strong>of</strong> development <strong>in</strong> Ch<strong>in</strong>a.<br />
Global luxury br<strong>and</strong> st<strong>and</strong>ard cost structure <strong>and</strong> how large <strong>and</strong> small<br />
br<strong>and</strong>s can experience Ch<strong>in</strong>a differently<br />
Global<br />
P&L Fixed Variable<br />
Big <strong>in</strong><br />
Ch<strong>in</strong>a<br />
Look<strong>in</strong>g beyond the Middle K<strong>in</strong>gdom<br />
Small <strong>in</strong><br />
Ch<strong>in</strong>a<br />
Net sales 100 100 100<br />
Cost <strong>of</strong> goods 30 * * 25 25<br />
Gross pr<strong>of</strong>it 70 75 75<br />
Gross marg<strong>in</strong> 70.0% 75.0% 75.0%<br />
Store expenses<br />
o/w personnel 7.00 75% 25% 3.00 4.00<br />
o/w rents 10.00 50% 50% 4.00 6.00<br />
o/w D&A. 3.00 100% 3.00 3.00<br />
o/w other 3.00 60% 40% 3.00 3.00<br />
Sub-total 23.00 65% 35% 13.00 16.00<br />
G & A 14.00 80% 20% 19.00 25.00<br />
Communication 7.00 70% 30% 14.00 22.00<br />
Sell<strong>in</strong>g 3.00 50% 50% 3.00 3.00<br />
Total operat<strong>in</strong>g<br />
expenses<br />
47.00 69.5% 30.5% 49.00 66.00<br />
EBIT 23.00 26.00 9.00<br />
EBIT marg<strong>in</strong> 23.0% 26.0% 9.0%<br />
* highly dependent on level <strong>of</strong> <strong>in</strong>-house production<br />
Source: HSBC estimates<br />
It’s more about the Ch<strong>in</strong>ese now than Ch<strong>in</strong>a itself.<br />
We estimate more than 50% <strong>of</strong> sales <strong>of</strong> luxury<br />
goods <strong>in</strong> Western Europe are generated by<br />
foreigners. This figure would be lower <strong>in</strong> North<br />
America (20%) but comparable <strong>in</strong> Hong Kong<br />
(well north <strong>of</strong> 50%). As far as the Ch<strong>in</strong>ese are<br />
concerned, accord<strong>in</strong>g to Ba<strong>in</strong> & Co, 59% <strong>of</strong> their<br />
luxury purchases were made abroad <strong>in</strong> 2011, <strong>of</strong><br />
which 34% were <strong>in</strong> Hong Kong <strong>and</strong> Macau <strong>and</strong><br />
25% overseas (Taiwan <strong>in</strong>cluded).<br />
Put differently, ma<strong>in</strong>l<strong>and</strong> Ch<strong>in</strong>a may have<br />
represented c10% <strong>of</strong> sales for the luxury sector <strong>in</strong><br />
2011 but the Ch<strong>in</strong>ese probably account for more<br />
than 25% <strong>of</strong> sales already.<br />
Sales by nationality <strong>of</strong> consumer: 2011<br />
Louis Vuitton br<strong>and</strong> Gucci Group Burberry* Richemont Swatch Prada<br />
Western Europe 10% 14% 10% 10% 13% 14%<br />
East Europe 4% 3% 4% 4% 3% 2%<br />
Middle East 7% 5% 6% 10% 9% 3%<br />
Japan 19% 15% 24% 12% 4% 12%<br />
Asia ex Japan 43% 44% 35% 52% 63% 57%<br />
North America 14% 17% 18% 9% 4% 10%<br />
Latam 4% 3% 3% 4% 3% 2%<br />
Total 100% 100% 100% 100% 100% 100%<br />
*For Burberry, figures are based on sales at retail equivalent<br />
Source: Company data, HSBC<br />
13
Consumer Br<strong>and</strong>s & Retail<br />
Global luxury goods<br />
September 2012<br />
abc<br />
Supportive long-term social /<br />
cultural drivers<br />
“Buy<strong>in</strong>g social place <strong>and</strong> feel<strong>in</strong>g good about it may<br />
seem helplessly vulgar, but that is precisely what<br />
characterises the new luxury” writes advertis<strong>in</strong>g <strong>and</strong><br />
market<strong>in</strong>g expert James B Twitchell <strong>in</strong> his book<br />
Liv<strong>in</strong>g it up. <strong>Luxury</strong> consumption is <strong>of</strong>ten conside<strong>red</strong><br />
by <strong>in</strong>vestors as discretionary or good to have, but we<br />
believe that for Ch<strong>in</strong>ese consumers, this is not the<br />
case as social trends, “the urge to splurge’, br<strong>and</strong><br />
obsession, <strong>and</strong> the trad<strong>in</strong>g-up phenomenon make it<br />
compulsory.<br />
“New money” m<strong>in</strong>ority loves luxury<br />
While awareness levels are still low for some br<strong>and</strong>s<br />
<strong>and</strong> penetration <strong>in</strong> second-tier cities limited, the<br />
ultra-rich <strong>of</strong> Ch<strong>in</strong>a are already spend<strong>in</strong>g more on<br />
luxury items than their Western counterparts. The<br />
562,000 high net worth <strong>in</strong>dividuals (HNWIs, net<br />
f<strong>in</strong>ancial assets <strong>in</strong> excess <strong>of</strong> USD1m) <strong>of</strong> 2011<br />
(source: World Wealth reports) are not really<br />
representative <strong>of</strong> the masses <strong>of</strong> affluent or middle<br />
class Ch<strong>in</strong>ese who are will<strong>in</strong>g to <strong>in</strong>dulge themselves<br />
<strong>and</strong> display social status.<br />
Ch<strong>in</strong>a ranked No 4 <strong>in</strong> terms <strong>of</strong> number <strong>of</strong> HNWIs <strong>in</strong><br />
2011 (562,000), still far beh<strong>in</strong>d the US (3,068,000),<br />
Japan (1,822,000) <strong>and</strong> Germany (951,000) but now<br />
comfortably ahead <strong>of</strong> both the UK (441,000) <strong>and</strong><br />
France (404,000). While the Western world is<br />
dom<strong>in</strong>ated by “old money”, Ch<strong>in</strong>a’s super-rich are<br />
<strong>of</strong>ten first generation entrepreneurs. When Hurun<br />
published the country’s first rich list <strong>in</strong> 1999, it<br />
requi<strong>red</strong> a personal fortune <strong>of</strong> just USD6m to make<br />
it <strong>in</strong>to the top 50. Ten years later, it <strong>in</strong>cluded 1,000<br />
<strong>in</strong>dividuals <strong>and</strong> the m<strong>in</strong>imum requirement was<br />
USD150m.This is a reflection <strong>of</strong> the new category <strong>of</strong><br />
nouveau-riche that has been created. Less than 1%<br />
<strong>of</strong> the list made their money through <strong>in</strong>heritance (vs<br />
25% <strong>in</strong> the UK <strong>and</strong> 35% <strong>in</strong> the US).<br />
To a certa<strong>in</strong> extent, the HNWIs <strong>of</strong> Ch<strong>in</strong>a are also<br />
likely to be citizens <strong>of</strong> the world <strong>in</strong> their behaviours,<br />
<strong>in</strong>vestments, <strong>and</strong> spend<strong>in</strong>g patterns <strong>and</strong> <strong>in</strong> that regard<br />
more comparable to New Yorkers or Tokyoites than<br />
to many <strong>of</strong> their own countrymen.<br />
High net worth <strong>in</strong>dividuals (m)<br />
Number <strong>of</strong> HNWIs worldwide<br />
12<br />
10<br />
8<br />
6<br />
4<br />
2<br />
0<br />
0.6<br />
2.2<br />
0.6<br />
0.7<br />
2.5 2.7<br />
2.5 2.5 2.6<br />
0. 7<br />
2. 9<br />
2. 8<br />
0.8<br />
3.2<br />
0.9<br />
3.3<br />
2.9 3.1<br />
0.9<br />
2.7<br />
2.6<br />
1.9 2.1 2.2 2. 4 2.6 2.8 2.4<br />
1.0<br />
3.1<br />
3.0<br />
1.0 1.1<br />
3.4 3.4<br />
3.1 3.2<br />
3.0 3.3 3.4<br />
2002 2003 2004 2005 2006 2007 2008 2009 2010 2011<br />
Asia-Pacific<br />
North America<br />
Source: World Wealth reports, Cap Gem<strong>in</strong>i<br />
Europe<br />
Other (Latam, Middle East, Africa)<br />
On average, Asian HNWIs (<strong>in</strong>clud<strong>in</strong>g the Ch<strong>in</strong>ese)<br />
allocate more <strong>of</strong> their “passion dollars” to luxury<br />
products than the Western wealthy do.<br />
Look<strong>in</strong>g beyond the mega-rich, the 2009 Hurun<br />
report notes there are 825,000 <strong>in</strong>dividuals (1 <strong>in</strong> every<br />
1,700) with assets north <strong>of</strong> RMB10m (or USD1.5m)<br />
with c50% <strong>of</strong> them <strong>in</strong> Beij<strong>in</strong>g, Guangdong <strong>and</strong><br />
Shanghai. The average age <strong>of</strong> these <strong>in</strong>dividuals is 43.<br />
Economic growth should eventually lift millions <strong>of</strong><br />
households out <strong>of</strong> poverty. Accord<strong>in</strong>g to a<br />
McK<strong>in</strong>sey survey, the upper middle class will<br />
represent an estimated c60% <strong>of</strong> urban Ch<strong>in</strong>ese<br />
households (with annual <strong>in</strong>come between USD5,848<br />
<strong>and</strong> USD14,620) <strong>in</strong> 2025 vs 9% <strong>in</strong> 2005.<br />
Share <strong>of</strong> total urban disposable <strong>in</strong>come<br />
100%<br />
10.2<br />
2.6<br />
9.9<br />
80%<br />
50.5<br />
38.6<br />
60%<br />
78.4<br />
51.1<br />
95.2<br />
40%<br />
15.4<br />
27.6<br />
17.0<br />
20%<br />
24.2<br />
13.6<br />
16.7<br />
2.4<br />
19.4<br />
0%<br />
1.8<br />
7.4 6.9<br />
1985 1995 2005 2015 2025<br />
Global affluent (> RMB200,001)<br />
Mass affluent<br />
(RMB100,001 - 200,000)<br />
Upper middle class<br />
(RMB40,001 - 100,000)<br />
Poor (< RMB25,000)<br />
Lower middle class<br />
(RMB25,001 - 40,000)<br />
Source: The value <strong>of</strong> Ch<strong>in</strong>a’s emerg<strong>in</strong>g middle class, The McK<strong>in</strong>sey & Co Institute<br />
14
Consumer Br<strong>and</strong>s & Retail<br />
Global luxury goods<br />
September 2012<br />
abc<br />
Ch<strong>in</strong>a’s urge to splurge<br />
We have observed that the super-rich <strong>and</strong> middle<br />
class like to show <strong>of</strong>f their status. In communist<br />
Ch<strong>in</strong>a, <strong>in</strong>dividual property was not allowed <strong>and</strong><br />
private wealth was traditionally suspicious. With the<br />
liberalization <strong>of</strong> the economy, a new class system<br />
was created whereby your place on the ladder<br />
depended on how much money you earned, <strong>and</strong><br />
luxury goods are an easy way to display the level <strong>of</strong><br />
one’s wealth.<br />
In The Cult <strong>of</strong> the <strong>Luxury</strong> Br<strong>and</strong>, Inside Asia’s<br />
Love Affair with <strong>Luxury</strong>, authors Radha Chadha<br />
<strong>and</strong> Paul Husb<strong>and</strong> argue that the development <strong>of</strong><br />
the luxury market follows a five-stage process. The<br />
first is subjugation. Deprivation builds a hunger for<br />
luxury however distant its satisfaction might be.<br />
Asian countries have gone through some form <strong>of</strong><br />
this. Stage two co<strong>in</strong>cides with the advent <strong>of</strong><br />
disposable <strong>in</strong>come. The economy grows <strong>and</strong> people<br />
have cash to spend for the first time. The emerg<strong>in</strong>g<br />
middle class buys wash<strong>in</strong>g mach<strong>in</strong>es, TV sets,<br />
while a smaller number, with<strong>in</strong> the upper end, are<br />
already buy<strong>in</strong>g Hermès or Louis Vuitton bags.<br />
Stage three is when consumers start “tripp<strong>in</strong>g over<br />
each other try<strong>in</strong>g to acquire symbols <strong>of</strong> wealth <strong>and</strong><br />
display<strong>in</strong>g them <strong>in</strong> a conspicuous manner”. The<br />
bulk <strong>of</strong> the population carries status markers from<br />
so-called compulsory br<strong>and</strong>s. This leads to stage<br />
four, <strong>in</strong> which consumers conform to a new set <strong>of</strong><br />
rules: to fit <strong>in</strong>. In stage five, luxury br<strong>and</strong>s become<br />
a way <strong>of</strong> life. We argue that Japan may have even<br />
moved beyond that to a stage <strong>in</strong> which luxury has<br />
lost its relevance.<br />
Global trends may <strong>in</strong>fluence Ch<strong>in</strong>ese<br />
Look<strong>in</strong>g at the growth rates for luxury <strong>in</strong> Ch<strong>in</strong>a vs.<br />
GDP growth, bipolarisation <strong>of</strong> consumption is likely<br />
to expla<strong>in</strong> the bulk <strong>of</strong> the difference. This<br />
“disharmony” <strong>of</strong> consumption results <strong>in</strong> habits not<br />
always correspond<strong>in</strong>g to <strong>in</strong>come levels. Ch<strong>in</strong>ese<br />
luxury consumers may be <strong>in</strong>fluenced by social<br />
trends that are tak<strong>in</strong>g place on a global basis. People<br />
are marry<strong>in</strong>g later (there are more s<strong>in</strong>gle people with<br />
more money to spend on themselves). Divorce rates<br />
are ris<strong>in</strong>g, <strong>and</strong> new s<strong>in</strong>gles tend to spend more on<br />
themselves. Moreover, women’s f<strong>in</strong>ancial autonomy<br />
is <strong>in</strong>creas<strong>in</strong>g. Younger generations <strong>of</strong> women are<br />
more knowledgeable about br<strong>and</strong>s, <strong>and</strong> eager to<br />
reward themselves.<br />
Ch<strong>in</strong>a specifics: young population, only<br />
child<br />
An estimate by the UN suggests that Ch<strong>in</strong>a’s young<br />
adult population (age 20-34) is grow<strong>in</strong>g after a<br />
decade <strong>of</strong> contraction. Young adults born after the<br />
1970s <strong>and</strong> 1980s save less <strong>and</strong> consume more than<br />
older generations do. A media survey suggests that<br />
the average age <strong>of</strong> Ch<strong>in</strong>a’s automobile owners’ is 35,<br />
10 years younger than the world average <strong>of</strong> 45-47.<br />
S<strong>in</strong>gle child consumers have the benefit <strong>of</strong> be<strong>in</strong>g<br />
able to tap two generations <strong>of</strong> wealth (though the<br />
policy is be<strong>in</strong>g phased out gradually) <strong>and</strong> this <strong>in</strong> turn<br />
benefits luxury dem<strong>and</strong>. As we will see later on,<br />
corporate gift<strong>in</strong>g <strong>and</strong> mistresses have also been<br />
supportive to the luxury sector <strong>in</strong> Ch<strong>in</strong>a.<br />
Asian countries’ stages <strong>of</strong> luxe evolution: Ch<strong>in</strong>a’s show <strong>of</strong>f phase should evolve quickly as sophistication kicks <strong>in</strong><br />
Stage 1 Stage 2 Stage 3 Stage 4 Stage 5<br />
Subjugation<br />
Start <strong>of</strong><br />
money<br />
INDIA<br />
Source: The Cult <strong>of</strong> the <strong>Luxury</strong> Br<strong>and</strong>, Inside Asia’s Love Affair with <strong>Luxury</strong>, Radha Chadha <strong>and</strong> Paul Husb<strong>and</strong><br />
Show <strong>of</strong>f Fit <strong>in</strong> Way <strong>of</strong> life<br />
JAPAN<br />
HONG KONG / SINGAPORE<br />
TAIWAN / S. KOREA<br />
CHINA<br />
15
Consumer Br<strong>and</strong>s & Retail<br />
Global luxury goods<br />
September 2012<br />
abc<br />
Penetration rema<strong>in</strong>s limited<br />
Huge, young (but age<strong>in</strong>g) population<br />
Ch<strong>in</strong>a’s population was one-fifth <strong>of</strong> the global total<br />
<strong>in</strong> 2009. Although by 2050, India is expected to have<br />
outgrown Ch<strong>in</strong>a to become the world’s most<br />
populous country with about 1.8bn people, this is not<br />
negative for Ch<strong>in</strong>ese consumer dem<strong>and</strong>; it just<br />
means that Ch<strong>in</strong>a’s population will be grow<strong>in</strong>g at a<br />
slower pace as it ages. It would appear that not only<br />
are there more potential luxury consumers <strong>in</strong> Ch<strong>in</strong>a<br />
but the dem<strong>and</strong> is skewed towards a younger<br />
generation than <strong>in</strong> other regions.<br />
Top 10 most populous countries (m)<br />
1950 2012 2050 Pop by 2050 Increase<br />
2050/2012<br />
Ch<strong>in</strong>a Ch<strong>in</strong>a India 1657 37%<br />
India India Ch<strong>in</strong>a 1304 -3%<br />
USA USA USA 423 35%<br />
Russia Indonesia Nigeria 402 137%<br />
Japan Brazil Indonesia 300 21%<br />
Indonesia Pakistan Pakistan 291 53%<br />
Germany Nigeria Bangladesh 250 55%<br />
Brazil Bangladesh Brazil 232 17%<br />
UK Russia Ethiopia 228 150%<br />
Italy Japan Philipp<strong>in</strong>es 172 66%<br />
Less developed countries / More developed countries<br />
Source: US Census Bureau, International Programs Center<br />
Ch<strong>in</strong>ese “space <strong>in</strong>vaders”<br />
With the economic boom <strong>and</strong> liberalisation <strong>of</strong> the<br />
market, <strong>in</strong>ternational companies <strong>and</strong> local <strong>in</strong>dustries<br />
<strong>and</strong> services have developed <strong>in</strong> tier 2-3 cities. As a<br />
result, spend<strong>in</strong>g power has <strong>in</strong>creased <strong>and</strong> rural<br />
populations have <strong>in</strong>filtrated urban cities to benefit<br />
from better <strong>in</strong>comes <strong>and</strong> better st<strong>and</strong>ards <strong>of</strong> liv<strong>in</strong>g.<br />
Pockets <strong>of</strong> wealth are emerg<strong>in</strong>g across the country.<br />
In 2008, Louis Vuitton had only 300,000 customers<br />
(less than 0.03% <strong>of</strong> the population). However, when<br />
open<strong>in</strong>g a store, the br<strong>and</strong> on average <strong>in</strong>creases its<br />
sales tenfold to the city’s exist<strong>in</strong>g clientele.<br />
The move <strong>in</strong>to different tiers <strong>of</strong> distribution: world<br />
1st tier: w<strong>in</strong>dows to luxury<br />
2nd tier: tourist dest<strong>in</strong>ations<br />
3rd tier: extensions<br />
4th tier: “the unexpected”<br />
Key cities<br />
Paris, London, Milan, Tokyo, New York<br />
City, Los Angeles Moscow<br />
Cannes, Capri, Rome, Geneva, Dubai,<br />
Las Vegas<br />
Lyons, Bari, Osaka, Boston<br />
Aruba (Caribbean), Almaty<br />
(Kazakhstan), Scottsdale (Arizona)<br />
The move <strong>in</strong>to different tiers <strong>of</strong> distribution: Ch<strong>in</strong>a<br />
1st tier: w<strong>in</strong>dows to luxury<br />
2nd tier: tourist dest<strong>in</strong>ations<br />
3rd tier: extensions<br />
4th tier: “the unexpected”<br />
Source: HSBC<br />
Key cities<br />
Beij<strong>in</strong>g, Shanghai, Guangzhou<br />
Suzhou, Hangzhou<br />
Xian, Harb<strong>in</strong>, Chengdu<br />
Kunm<strong>in</strong>g, Urumqi, Taiyuan<br />
In 2010, Paris had the same population as Hefei, the<br />
40th largest city <strong>in</strong> Ch<strong>in</strong>a. Yet while Paris had five<br />
Louis Vuitton stores, Hefei had none. Judg<strong>in</strong>g by<br />
urbanisation trends <strong>in</strong> Ch<strong>in</strong>a, it is likely that the<br />
number <strong>of</strong> cities with over 1m <strong>in</strong>habitants will<br />
cont<strong>in</strong>ue to <strong>in</strong>crease.<br />
As has happened worldwide, br<strong>and</strong>s <strong>in</strong> Ch<strong>in</strong>a are<br />
exp<strong>and</strong><strong>in</strong>g their distribution footpr<strong>in</strong>t from first<br />
tier cities (w<strong>in</strong>dows to luxury) <strong>and</strong> second tier<br />
cities (tourist dest<strong>in</strong>ations) to cities conside<strong>red</strong> as<br />
extensions (regional hubs) <strong>and</strong> a few<br />
unexpected locations.<br />
16
Consumer Br<strong>and</strong>s & Retail<br />
Global luxury goods<br />
September 2012<br />
abc<br />
Number <strong>of</strong> stores by city <strong>in</strong> ma<strong>in</strong>l<strong>and</strong> Ch<strong>in</strong>a: end 1H12<br />
City Louis Vuitton Gucci Prada Hermes Ferragamo Burberry Coach Tod's Tiffany<br />
Anshan 0 0 0 0 0 0 1 0 0<br />
Baod<strong>in</strong>g 0 0 0 0 0 0 1 2 0<br />
Beij<strong>in</strong>g 3 7 3 4 7 9 11 0 2<br />
Changchun 1 1 0 0 1 1 0 0<br />
Changsha 1 1 0 0 1 2 1 1 0<br />
Changzhou 0 1 0 0 1 1 1 0 0<br />
Chengdu 1 1 1 1 1 4 6 1 0<br />
Chongq<strong>in</strong>g 1 2 0 0 1 1 1 1 1<br />
Dalian 1 1 1 1 1 2 1 1 0<br />
Fuzhou 1 1 0 0 0 1 1 1 0<br />
Guangzhou 2 2 1 2 2 2 2 0 1<br />
Guiyang 0 1 0 0 1 1 1 0 0<br />
Hangzhou 1 2 2 2 2 3 3 3 1<br />
Harb<strong>in</strong> 2 2 1 1 2 2 2 1 0<br />
Hefei 1 1 0 0 1 1 1 1 0<br />
Hohhot 1 1 0 0 1 1 1 0 0<br />
Jiangy<strong>in</strong> 0 0 0 0 0 0 0 0<br />
J<strong>in</strong>an 0 1 0 0 0 1 1 0 0<br />
J<strong>in</strong>hua Intime 0 0 0 0 0 0 0 0<br />
Kunm<strong>in</strong>g 1 2 0 1 2 2 2 1 1<br />
Lanzhou 0 0 0 0 0 1 1 0 0<br />
Nanchang 0 0 0 0 0 0 0 0<br />
Nanj<strong>in</strong>g 1 1 0 1 1 2 2 1 1<br />
Nann<strong>in</strong>g 1 0 0 0 1 1 1 1 0<br />
Nantong 0 0 0 0 0 0 0 0<br />
N<strong>in</strong>gbo 1 1 0 0 1 1 2 0 0<br />
Q<strong>in</strong>gdao 1 1 1 1 1 1 1 1 0<br />
Sanya 1 0 0 0 1 0 1 0<br />
Shanghai 3 8 3 3 6 6 8 2 5<br />
Shangyu 0 0 0 0 0 0 0 0<br />
Shenyang 3 3 2 1 1 3 3 3 1<br />
Shenzhen 1 1 1 1 1 2 3 2 2<br />
Shijiazhuang 0 1 0 0 1 1 2 0 0<br />
Suzhou 1 1 0 1 2 2 2 1 0<br />
Taiyuan 1 1 1 0 1 1 1 0 0<br />
Taizhou 0 0 0 0 0 0 0 0<br />
Tianj<strong>in</strong> 1 2 1 0 2 2 5 2 1<br />
Urumqi 1 0 0 0 1 1 0 0<br />
Wenzhou 1 1 1 0 1 2 2 0<br />
Wuhan 1 1 0 0 2 2 2 2 1<br />
Wuq<strong>in</strong>g 0 0 0 0 0 0 0 0<br />
Wuxi 1 1 0 1 1 1 2 1 0<br />
Xiamen 1 1 0 0 1 1 2 0 0<br />
Xian 1 2 1 0 0 1 2 1 0<br />
Xuzhou 0 0 0 0 0 0 1 0 0<br />
Yangzhou 1<br />
Zhangjiagang 0 0 0 0 0 0 0 0<br />
Zhengzhou 1 1 0 0 1 1 1 1 0<br />
Zhenjiang 0 0 0 0 0 0 0 0<br />
Others 0 0 0 0 0 0 0 0<br />
TOTAL 39 54 20 21 50 66 79 34 17<br />
Source: Company data, HSBC estimates<br />
17
Consumer Br<strong>and</strong>s & Retail<br />
Global luxury goods<br />
September 2012<br />
abc<br />
Sophistication, travel <strong>and</strong><br />
overdependence<br />
Path to growth for luxury br<strong>and</strong>s <strong>in</strong> ma<strong>in</strong>l<strong>and</strong> Ch<strong>in</strong>a is not<br />
straightforward, amid rapidly evolv<strong>in</strong>g patterns <strong>of</strong> consumer<br />
behaviour <strong>and</strong> social / political risks<br />
Overseas shopp<strong>in</strong>g trips by Ch<strong>in</strong>ese consumers are a structural<br />
trend, not just a function <strong>of</strong> currency movements<br />
Overdependence on the Ch<strong>in</strong>ese consumer threatens br<strong>and</strong><br />
equity <strong>and</strong> may affect valuation as <strong>in</strong>vestors end up with too many<br />
eggs <strong>in</strong> the Ch<strong>in</strong>a basket<br />
More dem<strong>and</strong><strong>in</strong>g consumers<br />
Less flash, more sophistication<br />
A few years ago, it was common for Ch<strong>in</strong>ese men to<br />
leave the label sown to the sleeve <strong>of</strong> their suits so<br />
that people knew what br<strong>and</strong>s they were wear<strong>in</strong>g.<br />
We’re not say<strong>in</strong>g this doesn’t happen anymore but it<br />
has become a rarer sight. Ch<strong>in</strong>ese consumers have<br />
become more sophisticated <strong>and</strong> are <strong>in</strong>creas<strong>in</strong>gly<br />
seek<strong>in</strong>g out more subtly designed luxury goods.<br />
In our view, luxury consumption <strong>in</strong> Ch<strong>in</strong>a is<br />
becom<strong>in</strong>g <strong>in</strong>creas<strong>in</strong>gly lifestyle-focused, with<br />
consumer preferences mov<strong>in</strong>g away from logodriven<br />
designs <strong>and</strong> beg<strong>in</strong>n<strong>in</strong>g to favour leather over<br />
canvas. Speak<strong>in</strong>g to the companies we cover last<br />
May <strong>in</strong> Paris (see our 4 June Global luxury update),<br />
most management teams confirmed this <strong>and</strong> judg<strong>in</strong>g<br />
by the success <strong>of</strong> Prada (which has more leather<br />
driven <strong>of</strong>fer<strong>in</strong>gs) <strong>and</strong> the chang<strong>in</strong>g focus <strong>of</strong> the<br />
companies (e.g. Coach’s Legacy launch), this is<br />
probably not just a Ch<strong>in</strong>ese phenomenon.<br />
We believe Ch<strong>in</strong>ese consumption is gradually<br />
enter<strong>in</strong>g what we call the “<strong>French</strong> Paradox”, i.e. how<br />
to create the illusion <strong>of</strong> scarcity to sell more <strong>of</strong> what<br />
is supposed to be exclusive, <strong>and</strong> appeal to consumers<br />
who want to move beyond ma<strong>in</strong>stream labels <strong>and</strong><br />
aspire to be “<strong>in</strong> the know”.<br />
Seek<strong>in</strong>g value for money<br />
Alongside becom<strong>in</strong>g more sophisticated, Ch<strong>in</strong>ese<br />
consumers have also become <strong>in</strong>creas<strong>in</strong>gly<br />
dem<strong>and</strong><strong>in</strong>g <strong>in</strong> terms <strong>of</strong> seek<strong>in</strong>g value for money.<br />
As a result, today’s younger, better <strong>in</strong>formed<br />
Ch<strong>in</strong>ese luxury consumers have less <strong>of</strong> an<br />
obsession with where products (except for<br />
watches) are made. Coach, for <strong>in</strong>stance, has had<br />
notable success with its Ch<strong>in</strong>ese-made product<br />
range; for it “made <strong>in</strong> Ch<strong>in</strong>a” has become a<br />
unique sell<strong>in</strong>g po<strong>in</strong>t rather than a h<strong>in</strong>drance. It is<br />
worth not<strong>in</strong>g that Sitoy (1023 HK, Not rated), a<br />
big producer for Coach, makes Prada items.<br />
18
Consumer Br<strong>and</strong>s & Retail<br />
Global luxury goods<br />
September 2012<br />
abc<br />
Whilst European consumers seem less open to<br />
luxury products that are made <strong>in</strong> Ch<strong>in</strong>a, European<br />
br<strong>and</strong>s that do not produce <strong>in</strong> Ch<strong>in</strong>a may also suffer<br />
from Ch<strong>in</strong>ese consumers th<strong>in</strong>k<strong>in</strong>g their products are<br />
too expensive.<br />
The “first-mover disadvantage”<br />
In h<strong>and</strong>bags <strong>and</strong> accessories, we c<strong>red</strong>it Louis<br />
Vuitton with effectively creat<strong>in</strong>g the market <strong>in</strong><br />
Ch<strong>in</strong>a. The br<strong>and</strong> helped develop the market to the<br />
po<strong>in</strong>t where up until recently the comb<strong>in</strong>ed share <strong>of</strong><br />
LV <strong>and</strong> Gucci <strong>in</strong> ma<strong>in</strong>l<strong>and</strong> Ch<strong>in</strong>a was above 50%. In<br />
our first Red bull report, we argued low awareness<br />
<strong>and</strong> footpr<strong>in</strong>t meant bigger br<strong>and</strong>s, notably LV,<br />
Gucci, <strong>and</strong> Omega would cont<strong>in</strong>ue to <strong>in</strong>crease sales<br />
at a very fast pace <strong>and</strong> for a long time. Yet more<br />
recent trends are lead<strong>in</strong>g us to change our view.<br />
In April 2007, we published a report called Never<br />
too much? How luxury goods companies manage<br />
exclusivity <strong>and</strong> mass distribution, <strong>in</strong> which we<br />
looked at the risk <strong>of</strong> market saturation <strong>and</strong> the<br />
consumer’s loss <strong>of</strong> <strong>in</strong>terest <strong>in</strong> some luxury br<strong>and</strong>s.<br />
Our view back then was that, although the risk<br />
existed <strong>in</strong> theory, megabr<strong>and</strong>s were <strong>in</strong> practice<br />
f<strong>in</strong>d<strong>in</strong>g ways to push back the ceil<strong>in</strong>g <strong>of</strong> growth. Our<br />
view has s<strong>in</strong>ce changed: their sales cont<strong>in</strong>ue to grow,<br />
but we now believe the br<strong>and</strong> is at risk <strong>of</strong> los<strong>in</strong>g<br />
share, as its scale <strong>and</strong> awareness have already<br />
reached extremely high levels.<br />
In Abraham Maslow’s hierarchy <strong>of</strong> needs described<br />
<strong>in</strong> his 1943 paper A Theory <strong>of</strong> Human Motivation,<br />
most luxury purchases would today correspond to<br />
“esteem needs” that <strong>in</strong>clude the search for selfesteem,<br />
confidence, achievement, <strong>and</strong> respect by<br />
others, <strong>in</strong> other words “social status”.<br />
In 2007, we def<strong>in</strong>ed a pyramid <strong>of</strong> “mass-lux” (see<br />
page 20) where luxury products are ranked by<br />
accessibility (price <strong>and</strong> distribution) <strong>and</strong> we argued<br />
consumers who become aware <strong>of</strong> the pr<strong>in</strong>ciple <strong>of</strong><br />
luxury have only one way to go: up.<br />
Maslow's hierarchy <strong>of</strong> needs<br />
Morality,<br />
creativity,<br />
spontaneity,<br />
problem solv<strong>in</strong>g,<br />
lack <strong>of</strong> prejudice,<br />
acceptance <strong>of</strong> facts<br />
Self-actualization<br />
Self esteem,<br />
Confidence, achievement,<br />
Esteem<br />
Respect <strong>of</strong> others, respect by others<br />
Friendship, family, sexual <strong>in</strong>timacy<br />
Love/Belong<strong>in</strong>g<br />
Security <strong>of</strong> body, <strong>of</strong> employment, <strong>of</strong> resources,<br />
Safety<br />
<strong>of</strong> morality, <strong>of</strong> the family, <strong>of</strong> health, <strong>of</strong> property<br />
Breath<strong>in</strong>g, food, water, sex, sleep, homeostasis, excretion<br />
Physiological<br />
Source: Maslow<br />
Michael Silverste<strong>in</strong> (BCG) has shown that there is a<br />
common element between Starbuck’s <strong>and</strong> luxury<br />
br<strong>and</strong>s: they all benefit from trad<strong>in</strong>g-up. Why buy a<br />
c<strong>of</strong>fee three times the normal price? Essentially,<br />
because consumers value the moment, the<br />
experience, the br<strong>and</strong> <strong>and</strong> the way it acts <strong>in</strong> terms <strong>of</strong><br />
social recognition. As luxury goods enable<br />
consumers to display social status, first comers will<br />
purchase the lower-priced items from the most<br />
established br<strong>and</strong>s that is, those that are immediately<br />
recognisable. Yet, as a consumer becomes more<br />
educated, he / she will want to purchase less “massappeal<strong>in</strong>g”<br />
products. There are then two<br />
opportunities: trad<strong>in</strong>g-up with<strong>in</strong> a br<strong>and</strong> or mov<strong>in</strong>g<br />
towards a more “selective” br<strong>and</strong>.<br />
Some <strong>in</strong>vestors may start perceiv<strong>in</strong>g the luxury<br />
goods market as mature with star br<strong>and</strong>s’ growth<br />
potential therefore limited. We argue this is not<br />
necessarily the case as there are ways to recruit <strong>and</strong><br />
reta<strong>in</strong> consumers, but we believe that more than any<br />
other br<strong>and</strong>, megabr<strong>and</strong>s may start to show signs <strong>of</strong><br />
suffer<strong>in</strong>g br<strong>and</strong> wear<strong>in</strong>ess ow<strong>in</strong>g to their early entry<br />
<strong>in</strong>to several markets – we term this the “first-mover<br />
disadvantage”.<br />
Similarly, we would argue Coach is a victim <strong>of</strong> a<br />
first-mover disadvantage <strong>in</strong> the US but a beneficiary<br />
<strong>in</strong> Ch<strong>in</strong>a. Omega is a victim <strong>in</strong> Ch<strong>in</strong>a <strong>and</strong> a<br />
beneficiary <strong>in</strong> the US. Prada, oddly, seems to be a<br />
beneficiary on a global basis, <strong>and</strong> that’s a strong<br />
reason for us recommend<strong>in</strong>g the stock.<br />
19
Consumer Br<strong>and</strong>s & Retail<br />
Global luxury goods<br />
September 2012<br />
abc<br />
Br<strong>and</strong> recognition level for middle-class Ch<strong>in</strong>ese (aided recall)<br />
Number <strong>of</strong> br<strong>and</strong>s <strong>in</strong><br />
list (2006)<br />
Average number<br />
recognized (2006)<br />
Number <strong>of</strong> br<strong>and</strong>s <strong>in</strong><br />
list (2011)<br />
Average number<br />
recognized (2011)<br />
Source: KPMG-TNS<br />
Clothes<br />
Bags &<br />
Shoes<br />
Watches Jewellery<br />
36 15 25 9<br />
9.3 4.7 7.6 2.5<br />
39 40 26 13<br />
13.5 15.9 8.8 5.6<br />
It is <strong>in</strong>terest<strong>in</strong>g to see <strong>in</strong> the above KPMG survey<br />
that <strong>in</strong> a period <strong>of</strong> five years, the number <strong>of</strong><br />
br<strong>and</strong>s recognised <strong>in</strong> “bags <strong>and</strong> shoes” by<br />
consumers tripled <strong>and</strong> <strong>in</strong> jewellery doubled.<br />
Wake up to Ch<strong>in</strong>a’s tech generation<br />
In our view, the pattern <strong>of</strong> luxury consumption <strong>in</strong><br />
Ch<strong>in</strong>a is unlikely to follow the typical progression<br />
up the luxury pyramid from affordable luxury<br />
br<strong>and</strong>s up to ultra-high end br<strong>and</strong>s. Instead, we<br />
expect to see a polarisation <strong>of</strong> dem<strong>and</strong>, <strong>in</strong> which<br />
some consumers would feed the entry-level<br />
luxury segment (e.g. Coach) <strong>and</strong> other consumers<br />
the very high-end premium segment (e.g. Bottega<br />
Venetta), while ma<strong>in</strong>stream br<strong>and</strong>s <strong>in</strong> the core<br />
mid-market (e.g. LV or Gucci) suffer from firstmover<br />
disadvantage as consumers seek substitutes<br />
(e.g. Prada).<br />
The luxury consumer <strong>in</strong> Ch<strong>in</strong>a is both young <strong>and</strong><br />
well <strong>in</strong>formed. A number <strong>of</strong> Ch<strong>in</strong>ese Web site<br />
operators are try<strong>in</strong>g to take advantage <strong>of</strong> this: <strong>in</strong><br />
August 2011, S<strong>in</strong>a, the largest <strong>in</strong>fota<strong>in</strong>ment Web<br />
portal <strong>in</strong> Ch<strong>in</strong>a, launched a designer br<strong>and</strong>oriented<br />
B2C site, S<strong>in</strong>a <strong>Luxury</strong>. 360 Buy, <strong>in</strong> the<br />
news recently for hav<strong>in</strong>g sparked a price war with<br />
Gome <strong>and</strong> Sun<strong>in</strong>g <strong>in</strong> the consumer electronics<br />
space, also launched a B2C platform (toplife.com)<br />
cater<strong>in</strong>g to the needs <strong>of</strong> the luxury segment.<br />
The mass-luxury pyramid: Ch<strong>in</strong>a may not see the natural progression <strong>and</strong> Louis Vuitton is not alone, Prada may be a substitute<br />
Bespoke<br />
Very few<br />
Price Po<strong>in</strong>ts<br />
<strong>in</strong> USD<br />
50,000 ><br />
Ultra High End<br />
Leviev<br />
Graff<br />
Harry W<strong>in</strong>ston<br />
Number <strong>of</strong><br />
po<strong>in</strong>ts <strong>of</strong> sale<br />
Patek Philippe<br />
Bréguet<br />
Superpremium<br />
Bottega Veneta<br />
Van Cleef & Arpels<br />
5,000 ><br />
Panerai<br />
Hermes<br />
Chopard<br />
Rolex<br />
Cartier<br />
Berluti<br />
Tiffany excl. silver<br />
1,000 ><br />
Louis Vuitton<br />
Designer accessories<br />
Gucci<br />
& apparel<br />
Tod’s<br />
300 ><br />
Montblanc<br />
IWC<br />
Bulgari<br />
Omega<br />
Premium core<br />
Tag Heuer<br />
David Yurman<br />
Accessible core<br />
Tissot<br />
Designer eyewear<br />
Coach<br />
Tiffany silver jewellery<br />
Affordable luxury<br />
Geox<br />
100 ><br />
Restaurant/Enterta<strong>in</strong>ment<br />
Spirits<br />
Everyday<br />
Designer fragrances<br />
Swatch<br />
Champagne<br />
luxury<br />
Starbucks<br />
Imported beer/w<strong>in</strong>e<br />
Many<br />
Source: HSBC<br />
20
Consumer Br<strong>and</strong>s & Retail<br />
Global luxury goods<br />
September 2012<br />
abc<br />
Whilst the market is geographically wide, br<strong>and</strong>s<br />
are discussed via blogs <strong>and</strong> forums. There were<br />
356m mobile phone <strong>in</strong>ternet users <strong>in</strong> Ch<strong>in</strong>a as <strong>of</strong><br />
late 2011 (more than the US population) <strong>and</strong> more<br />
than half a billion <strong>in</strong>ternet users: 10-19 year olds<br />
account for 26.7% <strong>of</strong> those, 20-29 year olds for<br />
29.8% <strong>and</strong> 30-39 year olds for another 25.7%.<br />
Ch<strong>in</strong>a is connected: what a difference four years make<br />
_______ 2007 ________ _______2011 ________<br />
Internet<br />
users (m)<br />
% <strong>of</strong> total Internet<br />
users (m)<br />
% <strong>of</strong> total<br />
National 210 15.9% 513 38.3%<br />
Beij<strong>in</strong>g 7.4 46.6% 13.8 70.3%<br />
Shanghai 8.3 45.8% 15.2 66.2%<br />
Guangdong 33.4 35.9% 63.0 60.4%<br />
Source: CNNIC 2011<br />
Socio-political risks<br />
Guangxi<br />
Follow<strong>in</strong>g Deng Xiaop<strong>in</strong>g’s creed that “gett<strong>in</strong>g<br />
rich is glorious”, Ch<strong>in</strong>ese consumers have<br />
embraced conspicuous consumption over the past<br />
two decades. However, socio-political risks may<br />
see this change at least <strong>in</strong> the near term. While we<br />
th<strong>in</strong>k there are strong deep-seated cultural factors<br />
driv<strong>in</strong>g long-term luxury consumption <strong>in</strong> Ch<strong>in</strong>a<br />
that go beyond purely discretionary motives,<br />
social <strong>and</strong> political risks have emerged <strong>in</strong> the<br />
short term – not least driven by the grow<strong>in</strong>g<br />
wealth divide – which could curb the Ch<strong>in</strong>ese<br />
consumer’s enthusiasm for ostentatious wealth.<br />
Traditionally, display<strong>in</strong>g wealth <strong>in</strong> Ch<strong>in</strong>a was<br />
driven by more than just status seek<strong>in</strong>g for the<br />
sake <strong>of</strong> it, but was regarded as an important tool<br />
for achiev<strong>in</strong>g f<strong>in</strong>ancial or career success.<br />
Accord<strong>in</strong>g to The Cult <strong>of</strong> the <strong>Luxury</strong> Br<strong>and</strong>:<br />
Inside Asia's Love Affair With <strong>Luxury</strong>, show<strong>in</strong>g<br />
<strong>of</strong>f wealth <strong>in</strong> Ch<strong>in</strong>a can trigger a virtuous circle <strong>in</strong><br />
which “if you are seen to be rich <strong>and</strong> successful,<br />
you can attract more bus<strong>in</strong>ess deals, <strong>and</strong> you w<strong>in</strong><br />
approvals faster from <strong>of</strong>ficials who know you<br />
have the means to make appropriate gifts <strong>and</strong><br />
donations”; the book estimates 50% <strong>of</strong> luxury<br />
sales (<strong>and</strong> as much as 75% <strong>of</strong> sales <strong>in</strong> the watch<br />
category) are driven by gift-giv<strong>in</strong>g, both corporate<br />
driven <strong>and</strong> otherwise.<br />
In Ch<strong>in</strong>ese society, guanxi or relationships are<br />
widely recognized as be<strong>in</strong>g the key determ<strong>in</strong>ant <strong>of</strong><br />
bus<strong>in</strong>ess performance <strong>and</strong> are <strong>of</strong>ten l<strong>in</strong>ked to<br />
giv<strong>in</strong>g gifts or favours. Hard cash was used <strong>in</strong> the<br />
early days; this has now been replaced by luxury<br />
br<strong>and</strong> gifts. Such corporate gift<strong>in</strong>g is accepted as<br />
necessary for build<strong>in</strong>g relationships.<br />
In the 1990s, the cognac market <strong>in</strong> Japan went<br />
from boom to bust, forc<strong>in</strong>g br<strong>and</strong>s like Hennessy<br />
to rapidly exp<strong>and</strong> <strong>in</strong> other markets to make up for<br />
the sudden slump. What happened was quite<br />
simple; cognac consumption was boosted by<br />
corporate expenses: companies would take their<br />
clients out to upscale restaurants <strong>and</strong> karaoke bars<br />
<strong>and</strong> treat them to the f<strong>in</strong>est. Years later, bus<strong>in</strong>ess<br />
rules tightened <strong>and</strong> the market for cognac fell <strong>of</strong>f<br />
a cliff.<br />
Could this happen to luxury consumption <strong>in</strong> Ch<strong>in</strong>a?<br />
In our view, it is unlikely, but if there is any truth <strong>in</strong><br />
the idea that the majority <strong>of</strong> transactions are<br />
bus<strong>in</strong>ess-led (reward<strong>in</strong>g a colleague, gift<strong>in</strong>g a<br />
bus<strong>in</strong>ess partner or a prospect) <strong>and</strong> if the<br />
government adopts tougher anti-corruption<br />
governance practices <strong>and</strong> policies, there is the<br />
potential for luxury dem<strong>and</strong> to lose steam.<br />
Slower GDP growth <strong>and</strong> recent corruption<br />
sc<strong>and</strong>als have also underm<strong>in</strong>ed the practice <strong>of</strong><br />
corporate curb gift<strong>in</strong>g. In a country which is still<br />
struggl<strong>in</strong>g with relatively low average GDP per<br />
capita, social tension is ris<strong>in</strong>g between the have<br />
<strong>and</strong> have-nots. Social unrest has become a<br />
possibility <strong>and</strong> people mak<strong>in</strong>g ostentatious<br />
displays <strong>of</strong> their wealth <strong>and</strong> social status risk<br />
anger<strong>in</strong>g those less well-<strong>of</strong>f.<br />
Similar to Russia’s government, which has passed<br />
a message <strong>of</strong> conta<strong>in</strong>ment to local authorities, the<br />
Ch<strong>in</strong>ese rul<strong>in</strong>g body seem<strong>in</strong>gly wants to prevent<br />
21
Consumer Br<strong>and</strong>s & Retail<br />
Global luxury goods<br />
September 2012<br />
abc<br />
the wealth gap from becom<strong>in</strong>g too visible. Over<br />
the past few months, anti-corruption messages<br />
have multiplied <strong>in</strong> the press, bans on <strong>of</strong>ficials<br />
accept<strong>in</strong>g gifts like alcohol <strong>and</strong> tobacco made<br />
public, <strong>and</strong> the general environment for gift<strong>in</strong>g<br />
seems to be “wait <strong>and</strong> see”.<br />
Ironically, whilst several <strong>in</strong>dustry operators<br />
(notably <strong>in</strong> watches where gift<strong>in</strong>g has historically<br />
been high versus other product categories) have<br />
been vocal that there would be a revival <strong>of</strong> gift<strong>in</strong>g<br />
dur<strong>in</strong>g the October leadership transition, it now<br />
appears that a rebound is not a given. Our view is<br />
that gift-giv<strong>in</strong>g is part <strong>of</strong> the way people do<br />
bus<strong>in</strong>ess <strong>and</strong> that it should resume eventually.<br />
The recent set <strong>of</strong> results from Hengdeli is quite<br />
tell<strong>in</strong>g <strong>in</strong> this respect, we th<strong>in</strong>k. Although there were<br />
no mentions <strong>of</strong> gift<strong>in</strong>g related issues, we f<strong>in</strong>d it<br />
strik<strong>in</strong>g that entry-level watches saw sales <strong>in</strong>creas<strong>in</strong>g<br />
24% <strong>in</strong> ma<strong>in</strong>l<strong>and</strong> Ch<strong>in</strong>a <strong>in</strong> 1H12 while sales <strong>of</strong><br />
products at higher price po<strong>in</strong>ts were down 8%. By<br />
contrast, Hong Kong sales (which are driven<br />
exclusively by Hengdeli’s high-end Elegant concept<br />
stores) were stable, thus outperform<strong>in</strong>g high-end<br />
watch sales on the ma<strong>in</strong>l<strong>and</strong>.<br />
The divergence <strong>in</strong> performance <strong>of</strong> high-end watch<br />
sales <strong>in</strong> the two markets may be a reflection <strong>of</strong> Hong<br />
Kong’s tax advantage, especially as Ch<strong>in</strong>ese<br />
consumers may be becom<strong>in</strong>g more cost-conscious<br />
amid s<strong>of</strong>ter economic conditions, but it may also<br />
<strong>in</strong>dicate that Ch<strong>in</strong>ese corporate gift<strong>in</strong>g is shift<strong>in</strong>g<br />
abroad because ostentatious wealth has become<br />
frowned upon at home.<br />
Exit the “junior wives”?<br />
Although the practice may be on the wane as cultural<br />
values <strong>in</strong> Ch<strong>in</strong>a change, it is not uncommon for<br />
married wealthy Ch<strong>in</strong>ese men to have second wives<br />
or girlfriends (xiao san – literally “little three”,<br />
mean<strong>in</strong>g the third person <strong>in</strong> a relationship). The<br />
<strong>in</strong>fluence <strong>of</strong> xiao san on luxury dem<strong>and</strong> <strong>in</strong> Ch<strong>in</strong>a is<br />
difficult to assess, but there are scores <strong>of</strong> anecdotal<br />
press articles report<strong>in</strong>g how wealthy Ch<strong>in</strong>ese men<br />
tend to purchase flashier, more logo-driven luxury<br />
goods for second wives or girlfriends.<br />
The threat <strong>of</strong> nationalism<br />
In Korea, which is a large market for luxury goods,<br />
consumers have fought a government prescription <strong>of</strong><br />
frugality (many consumers hav<strong>in</strong>g maxed-out their<br />
c<strong>red</strong>it cards) <strong>and</strong> cont<strong>in</strong>ued to purchase imported<br />
luxury products.<br />
In April 2008, some Ch<strong>in</strong>ese supported a symbolic<br />
boycott <strong>of</strong> <strong>French</strong> goods (cit<strong>in</strong>g LV as one to avoid)<br />
over the treatment <strong>of</strong> the Olympic torch <strong>in</strong> Paris.<br />
Although we believe the impact on sales was<br />
negligible, we cannot rule out other patriotic<br />
boycotts <strong>in</strong> the future.<br />
Threat <strong>of</strong> counterfeit<strong>in</strong>g still real<br />
Counterfeit<strong>in</strong>g cont<strong>in</strong>ues to plague the <strong>in</strong>dustry.<br />
The World Customs Organization estimates that<br />
the annual sales <strong>of</strong> counterfeit goods amount to<br />
cUSD600bn a year <strong>and</strong> luxury goods constitute<br />
5% <strong>of</strong> that. This means lost sales <strong>and</strong> jobs for<br />
the <strong>in</strong>dustry.<br />
Companies now ma<strong>in</strong>ta<strong>in</strong> large pr<strong>of</strong>essional teams<br />
<strong>of</strong> <strong>in</strong>vestigators to combat the grey market <strong>and</strong> track<br />
down ecommerce sites sell<strong>in</strong>g counterfeit goods.<br />
While many observers assume the target markets for<br />
fake <strong>and</strong> authentic luxury goods are different, given<br />
luxury goods consumers would not want to risk<br />
los<strong>in</strong>g social status as a result <strong>of</strong> be<strong>in</strong>g discove<strong>red</strong> to<br />
be us<strong>in</strong>g a counterfeit product, the reality is not so<br />
straightforward.<br />
When we dig a bit deeper, however, there is<br />
evidence that the frontiers between the genu<strong>in</strong>e<br />
luxury <strong>and</strong> counterfeit markets are more blur<strong>red</strong> than<br />
the br<strong>and</strong>s would hope for. Ch<strong>in</strong>ese consumers, as<br />
we have already noted, are very price conscious,<br />
particularly the younger generation. It is not<br />
uncommon for them to use a mix <strong>of</strong> fake <strong>and</strong><br />
genu<strong>in</strong>e products. Surpris<strong>in</strong>gly, there are signs that<br />
even Ch<strong>in</strong>ese consumers who can afford genu<strong>in</strong>e<br />
22
Consumer Br<strong>and</strong>s & Retail<br />
Global luxury goods<br />
September 2012<br />
abc<br />
luxury products, prefer buy<strong>in</strong>g counterfeit items<br />
ow<strong>in</strong>g to the price.<br />
This has been partly driven by the fact that<br />
counterfeiters have, over the years, found ways to<br />
develop <strong>in</strong> some cases near-perfect clones. Indeed,<br />
this why new products launched by br<strong>and</strong>s have<br />
become <strong>in</strong>creas<strong>in</strong>gly difficult to imitate pr<strong>in</strong>ts<br />
(leather goods) or complex movements (watches).<br />
In ma<strong>in</strong>l<strong>and</strong> Ch<strong>in</strong>a, counterfeit activities rema<strong>in</strong><br />
buoyant <strong>in</strong> dedicated shopp<strong>in</strong>g areas, such as<br />
Shenzhen’s Lowu Commercial Centre <strong>and</strong><br />
Shanghai’s Qipu Lu market.<br />
Why travel will be supportive<br />
<strong>and</strong> what the issues are<br />
Why you’ll be see<strong>in</strong>g more Ch<strong>in</strong>ese<br />
com<strong>in</strong>g to your town soon<br />
Fast-grow<strong>in</strong>g emerg<strong>in</strong>g economies are chang<strong>in</strong>g the<br />
global travel <strong>in</strong>dustry through an <strong>in</strong>creas<strong>in</strong>g number<br />
<strong>of</strong> outbound newly affluent travellers <strong>and</strong> by<br />
provid<strong>in</strong>g dest<strong>in</strong>ations for <strong>in</strong>bound travellers. Over<br />
the past 20 years, receipts from <strong>in</strong>ternational tourism<br />
have grown faster than volumes <strong>of</strong> tourists (at a<br />
6.5% CAGR vs. 3.9% for tourists’ flows). We see<br />
this trend cont<strong>in</strong>u<strong>in</strong>g as disposable <strong>in</strong>come grows <strong>in</strong><br />
emerg<strong>in</strong>g countries <strong>and</strong> leisure spend<strong>in</strong>g outpaces<br />
GDP growth. In this section, we detail some <strong>of</strong> the<br />
key reasons why we believe Ch<strong>in</strong>ese travel is<br />
soar<strong>in</strong>g <strong>in</strong> terms <strong>of</strong> the number <strong>of</strong> travellers,<br />
frequency <strong>of</strong> travel <strong>and</strong> spend<strong>in</strong>g.<br />
Ch<strong>in</strong>a loosens outbound controls…<br />
Before 1983, outbound tourism was extremely<br />
restricted <strong>in</strong> Ch<strong>in</strong>a. The authorities then made it<br />
easier travel to Hong Kong <strong>and</strong> Macau on a<br />
family or friend sponso<strong>red</strong> basis. In 1990, the<br />
Ch<strong>in</strong>ese National Tourism Adm<strong>in</strong>istration<br />
(CNTA) started authoris<strong>in</strong>g travel to a few Asian<br />
countries (<strong>in</strong>itially Thail<strong>and</strong>, S<strong>in</strong>gapore <strong>and</strong><br />
Malaysia) still on a family or friend sponso<strong>red</strong><br />
basis before open<strong>in</strong>g up to more Asian<br />
dest<strong>in</strong>ations <strong>and</strong> Russia.<br />
Later <strong>in</strong> the 1990s, non-Asian countries started to<br />
get the Approved Dest<strong>in</strong>ation Status (ADS) <strong>and</strong><br />
whilst there are many restrictions still, that is<br />
when outbound travel started boom<strong>in</strong>g. In 1994,<br />
there were 3.7m outbound trips. In 2000, that<br />
figure had tripled to 10.4m. For 2012, the Ch<strong>in</strong>a<br />
Tourism Academy p<strong>red</strong>icts close to 78m trips will<br />
made abroad by Ch<strong>in</strong>ese nationals.<br />
<strong>Luxury</strong> counterfeit market <strong>and</strong> luxury consumer market<br />
Counterfeit Buyers<br />
<strong>Luxury</strong> Consumers<br />
Rebel<br />
Rational<br />
Imitator<br />
Show-<strong>of</strong>f<br />
Conformist<br />
Hedonist<br />
Tourist<br />
Fooled<br />
Lovers<br />
Intellectuals<br />
Followers<br />
Laggards<br />
Non <strong>Luxury</strong><br />
Consumers<br />
Potential<br />
<strong>Luxury</strong> Consumers<br />
Potential Counterfeit<br />
Consumers<br />
<strong>Luxury</strong><br />
Consumers<br />
Source: Pierre Xiao Lu <strong>in</strong> Elite Ch<strong>in</strong>a<br />
23
Consumer Br<strong>and</strong>s & Retail<br />
Global luxury goods<br />
September 2012<br />
abc<br />
…<strong>and</strong> the rest <strong>of</strong> the world opens its doors<br />
Relatively s<strong>of</strong>ter regulations <strong>in</strong> Ch<strong>in</strong>a have gone h<strong>and</strong><br />
<strong>in</strong> h<strong>and</strong> with numerous bilateral agreements on visas<br />
that have contributed to lift<strong>in</strong>g some <strong>of</strong> the barriers that<br />
weigh on travel. The US is one <strong>of</strong> many examples <strong>and</strong><br />
is f<strong>in</strong>ally on the map for Ch<strong>in</strong>ese tourists.<br />
A memor<strong>and</strong>um <strong>of</strong> underst<strong>and</strong><strong>in</strong>g (MOU) was<br />
signed <strong>in</strong> 2008 between Ch<strong>in</strong>a <strong>and</strong> the US to<br />
facilitate group leisure travel. Leisure arrivals<br />
quadrupled from 2007 to 2011 to reach 587,000. The<br />
total number <strong>of</strong> Ch<strong>in</strong>ese arrivals last year reached<br />
1.1m, double the figure for 2009 (Euromonitor). In<br />
January 2012, US President Obama passed an<br />
executive order to <strong>in</strong>crease visa process<strong>in</strong>g capacity,<br />
make sure <strong>in</strong>terviews with non immigrant applicants<br />
would be dealt with with<strong>in</strong> 3 weeks <strong>of</strong> the application<br />
<strong>and</strong> launch a pilot programme to obta<strong>in</strong> or renew<br />
visas without <strong>in</strong>terviews for low-risk applicants.<br />
Speak<strong>in</strong>g at Disney World <strong>in</strong> February 2012,<br />
President Obama announced his vision to exp<strong>and</strong><br />
<strong>in</strong>ternational tourism as a means <strong>of</strong> spurr<strong>in</strong>g a US<br />
economic recovery. “Every year, tens <strong>of</strong> millions <strong>of</strong><br />
tourists from all over the world come <strong>and</strong> visit<br />
America,” Obama said. “And the more folks who<br />
visit America, the more Americans we get back to<br />
work.” Obviously, there is a huge economic <strong>in</strong>centive<br />
<strong>in</strong> mak<strong>in</strong>g the Ch<strong>in</strong>ese traveller welcome. For that<br />
traveller, there is also a huge economic <strong>in</strong>centive<br />
to travel.<br />
Why it’s a “no bra<strong>in</strong>er” to buy abroad<br />
Motivations for travel have changed. Mass<br />
tourism <strong>in</strong> the 1960s was driven by <strong>in</strong>creas<strong>in</strong>g<br />
disposable <strong>in</strong>come, a thirst for novelty <strong>and</strong> the<br />
emergence <strong>of</strong> commercial airl<strong>in</strong>es. Today, as well<br />
as cultural / enterta<strong>in</strong>ment considerations, tourists<br />
also take economics <strong>in</strong>to account. Buy<strong>in</strong>g an iPad<br />
<strong>in</strong> the US to benefit from a weaker USD, or<br />
buy<strong>in</strong>g a Swiss-made watch <strong>in</strong> Hong Kong rather<br />
than <strong>in</strong> ma<strong>in</strong>l<strong>and</strong> Ch<strong>in</strong>a to benefit from lower<br />
VAT <strong>and</strong> to avoid consumption <strong>and</strong> import tax, is<br />
more common than before.<br />
We estimate that more than 50% <strong>of</strong> h<strong>and</strong>bags <strong>and</strong><br />
75% <strong>of</strong> watches sold <strong>in</strong> Hong Kong are purchased<br />
by ma<strong>in</strong>l<strong>and</strong> Ch<strong>in</strong>ese. Indeed, the price for a return<br />
flight to Hong Kong from the ma<strong>in</strong>l<strong>and</strong> is more than<br />
<strong>of</strong>fset by more favourable tax <strong>and</strong> duties on highend<br />
watches.<br />
Outgo<strong>in</strong>g Ch<strong>in</strong>ese tourists expenditure, 2009<br />
Accomodation<br />
Other outgo<strong>in</strong>g<br />
11%<br />
tourist expenditure<br />
Enterta<strong>in</strong>ment <strong>and</strong><br />
30%<br />
excursion<br />
11%<br />
Food<br />
Travel with<strong>in</strong><br />
12%<br />
country<br />
4%<br />
Shopp<strong>in</strong>g<br />
32%<br />
Source: Euromonitor International, July 2010<br />
International tourists arrivals <strong>and</strong> the world population, 1995-2011<br />
1100<br />
1000<br />
900<br />
800<br />
700<br />
600<br />
500<br />
400<br />
5.7 5.8 5.9 5.9 6.0 6.1 6.2 6.2 6.3 6.4 6.5 6.5 6.6 6.7 6. 8 6.9 7.0<br />
982<br />
913<br />
935<br />
839 894<br />
877<br />
795<br />
755<br />
675<br />
695 684<br />
626<br />
675<br />
586 602<br />
528<br />
561<br />
1995 1996 1997 1998 1999 2000 2001 2002 2003 2004 2005 2006 2007 2008 2009 2010 2011<br />
8.0<br />
7.0<br />
6.0<br />
5.0<br />
4.0<br />
3.0<br />
2.0<br />
1.0<br />
0.0<br />
International tourists arriv als (m, left scale)<br />
World population (bn, right scale)<br />
Source: US Census Bureau, World Tourism Organization<br />
24
Consumer Br<strong>and</strong>s & Retail<br />
Global luxury goods<br />
September 2012<br />
abc<br />
Accord<strong>in</strong>g to the CEIC, 67% <strong>of</strong> total visitors <strong>in</strong><br />
Hong Kong came from ma<strong>in</strong>l<strong>and</strong> Ch<strong>in</strong>a <strong>in</strong> 2011,<br />
compa<strong>red</strong> to 21% <strong>in</strong> 1997 at the time <strong>of</strong> the Hong<br />
Kong h<strong>and</strong>over to Ch<strong>in</strong>a with the faster <strong>in</strong>crease<br />
com<strong>in</strong>g from day travellers to Hong Kong.<br />
In 2011, a survey conducted by the M<strong>in</strong>istry <strong>of</strong><br />
<strong>Commerce</strong> (MOFCOM) also revealed that the<br />
prices <strong>of</strong> 20 luxury br<strong>and</strong>s over five categories,<br />
(watches, leather goods, apparel, liquor <strong>and</strong><br />
electronic products) were found to be about 45%,<br />
51% <strong>and</strong> 72% higher than those sold <strong>in</strong> Hong<br />
Kong, the US <strong>and</strong> France, respectively. With the<br />
recent weaken<strong>in</strong>g <strong>in</strong> the EUR <strong>and</strong> the possibility<br />
to claim back tax (with the likes <strong>of</strong> Global Blue or<br />
others), purchas<strong>in</strong>g goods <strong>in</strong> Europe when you are<br />
a Ch<strong>in</strong>ese national makes sense.<br />
Ch<strong>in</strong>ese consumers do not even need to travel as<br />
far as Europe for a good deal, given Hong Kong’s<br />
tax-free prices. Should a consumer choose to buy<br />
a watch or jewellery item <strong>in</strong> Ch<strong>in</strong>a versus Hong<br />
Kong, the price will be marked up by three layers<br />
<strong>of</strong> taxes: 1) import taxes: 20-35% for jewellery<br />
<strong>and</strong> 11% for watches; 2) consumption taxes: 5%<br />
for gold, silver, plat<strong>in</strong>um <strong>and</strong> diamond jewellery,<br />
10% on gem-sets <strong>and</strong> 20% for high end watches;<br />
<strong>and</strong> 3) value-added tax (VAT): 17.5%.<br />
In accordance with Ch<strong>in</strong>a’s commitments to the<br />
World Trade Organization, tariffs on imported<br />
luxury goods have been <strong>red</strong>uced s<strong>in</strong>ce 2005 but<br />
they still exist. For <strong>in</strong>stance, the 28-40% tariff that<br />
was levied on imported watches until the end <strong>of</strong><br />
2004 was cut to 12.5% <strong>and</strong> then further <strong>red</strong>uced to<br />
11% as <strong>of</strong> end 2006.<br />
However, all th<strong>in</strong>gs be<strong>in</strong>g equal, a Cartier watch<br />
is still 11% more expensive <strong>in</strong> Beij<strong>in</strong>g than <strong>in</strong><br />
Hong Kong. Although eventually import tariffs<br />
should theoretically disappear <strong>and</strong> should thus<br />
constitute a positive risk for the sector, for the<br />
time be<strong>in</strong>g, ma<strong>in</strong>l<strong>and</strong> Ch<strong>in</strong>a is still a tougher place<br />
to do bus<strong>in</strong>ess than some others.<br />
Retail price breakdown <strong>of</strong> an imported luxury watch (HKD)<br />
150<br />
100<br />
50<br />
0<br />
M a<strong>in</strong>l<strong>and</strong> Ch<strong>in</strong>a<br />
Wholesale<br />
price<br />
Hong Kong<br />
Import price VAT (17.5%*)<br />
Consump. tax (20%)* Import duty (11%)*<br />
Wholes ale price<br />
Distributor's gross marg<strong>in</strong><br />
Source: HSBC estimates- *: calculated on import price<br />
Ch<strong>in</strong>a outbound tourism<br />
160<br />
140<br />
120<br />
100<br />
80<br />
60<br />
40<br />
20<br />
0<br />
3 3 5 7 7 9 10 11<br />
15 17<br />
22<br />
28 31<br />
35<br />
41<br />
46 48<br />
57<br />
70<br />
80<br />
88<br />
97<br />
105<br />
113<br />
122 130 140<br />
148 155<br />
1993<br />
1994<br />
1995<br />
1996<br />
1997<br />
1998<br />
1999<br />
2000<br />
2001<br />
2002<br />
2003<br />
2004<br />
2005<br />
2006<br />
2007<br />
2008<br />
2009<br />
2010<br />
2011<br />
2012<br />
2013<br />
2013<br />
2014<br />
2015<br />
2016<br />
2017<br />
2018<br />
2019<br />
2020<br />
Source: Ch<strong>in</strong>a National Tourism Adm<strong>in</strong>istration, WTO projected tourism figures<br />
25
Consumer Br<strong>and</strong>s & Retail<br />
Global luxury goods<br />
September 2012<br />
abc<br />
Other reasons why the Ch<strong>in</strong>ese prefer<br />
shopp<strong>in</strong>g abroad<br />
Holiday <strong>in</strong>dulgence: Most people will be<br />
keener to spend dur<strong>in</strong>g holidays, whether on a<br />
restaurant meal or a h<strong>and</strong>bag, all the more as<br />
low cost airl<strong>in</strong>es <strong>in</strong>creas<strong>in</strong>gly allow sav<strong>in</strong>gs<br />
on travel costs.<br />
Gift-giv<strong>in</strong>g: Gift-giv<strong>in</strong>g is an important<br />
tradition <strong>in</strong> some Asian countries, like Japan<br />
<strong>and</strong> Ch<strong>in</strong>a. In Ch<strong>in</strong>a, reciprocity underlies<br />
gift-giv<strong>in</strong>g, <strong>and</strong> holidays are one <strong>of</strong> the many<br />
occasions that trigger the <strong>of</strong>fer<strong>in</strong>g <strong>of</strong> gifts.<br />
Better shopp<strong>in</strong>g experience: The product<br />
range can be different from one region to<br />
another: it is not uncommon to f<strong>in</strong>d <strong>in</strong> Hong<br />
Kong the rarer designs <strong>of</strong> Swiss watches or<br />
LV h<strong>and</strong>bags that cannot necessarily be found<br />
on the ma<strong>in</strong>l<strong>and</strong>. Product collections can be<br />
wider abroad. The product assortment <strong>and</strong> the<br />
service that goes with it (i.e. knowledgeable<br />
staff) are other reasons to shop <strong>in</strong> Europe or<br />
Hong Kong versus the ma<strong>in</strong>l<strong>and</strong>.<br />
Snobbery: Overseas purchases re<strong>in</strong>force<br />
status. Beyond the shopp<strong>in</strong>g experience,<br />
purchas<strong>in</strong>g luxury goods abroad can enhance<br />
a traveller’s apparent status. It also shows that<br />
one does not buy counterfeit items. This gives<br />
the Ch<strong>in</strong>ese customer a sense <strong>of</strong> belong<strong>in</strong>g to<br />
an <strong>in</strong>ternational, yet more exclusive <strong>and</strong><br />
sophisticated group <strong>of</strong> customers. There is an<br />
extra feel-good factor to purchas<strong>in</strong>g a Chanel<br />
bag at the historic Chanel store on rue<br />
Cambon <strong>in</strong> Paris rather than at home <strong>in</strong>, say,<br />
Shanghai.<br />
Quality assurance: Another reason ma<strong>in</strong>l<strong>and</strong><br />
tourists prefer to shop abroad is for the<br />
assurance that they are buy<strong>in</strong>g authentic, high<br />
quality products. With the prevalence <strong>of</strong><br />
counterfeit goods <strong>in</strong> Ch<strong>in</strong>a, we believe<br />
Ch<strong>in</strong>ese consumers can feel more assu<strong>red</strong> that<br />
the products they purchase are what they<br />
claim to be when they purchase those items<br />
<strong>in</strong>, say, Hong Kong. For jewellery <strong>in</strong><br />
particular, measures can be taken to provide<br />
quality assurance to customers.<br />
26
Consumer Br<strong>and</strong>s & Retail<br />
Global luxury goods<br />
September 2012<br />
abc<br />
Ch<strong>in</strong>ese tourist figures: many more<br />
big spenders<br />
The ease <strong>of</strong> travel, wealth expansion <strong>and</strong> other<br />
factors supportive <strong>of</strong> travel described above are<br />
expected to drive c12% growth pa <strong>in</strong> outbound travel<br />
over the next five years. The Boston Consult<strong>in</strong>g<br />
Group estimates that “fewer than 200m urban<br />
Ch<strong>in</strong>ese consumers have taken an overnight leisure<br />
trip. With an average <strong>of</strong> 25m people tak<strong>in</strong>g their<br />
first-ever such trip every year, however, that number<br />
will more than double by 2020”. Eight out <strong>of</strong> the top<br />
10 dest<strong>in</strong>ations for Ch<strong>in</strong>ese travellers are <strong>in</strong> Asia,<br />
with France now <strong>in</strong> the top 10 <strong>and</strong> the US ris<strong>in</strong>g up<br />
the rank<strong>in</strong>gs.<br />
Accord<strong>in</strong>g to figures released by the M<strong>in</strong>istry <strong>of</strong><br />
Public Security, 38.6m ma<strong>in</strong>l<strong>and</strong> Ch<strong>in</strong>ese citizens<br />
ventu<strong>red</strong> outside the country’s borders <strong>in</strong> 1H12, a<br />
nearly 20% rise over the same period last year.<br />
With this year’s surge, Ch<strong>in</strong>ese tourists are on track<br />
to take almost 80m overseas trips over the course<br />
<strong>of</strong> 2012. In an article published two years ago <strong>in</strong><br />
the F<strong>in</strong>ancial Times, Shao Qiwei, Chairman <strong>of</strong> the<br />
Ch<strong>in</strong>a National Tourism Association p<strong>red</strong>icted<br />
Ch<strong>in</strong>ese tourists would make 100m overseas trips<br />
pa by 2015; given current growth rates, this number<br />
could come sooner than he thought.<br />
Top 10 dest<strong>in</strong>ations for Ch<strong>in</strong>ese <strong>and</strong> expected growth<br />
Dest<strong>in</strong>ation<br />
Trips <strong>in</strong> 2011 (<strong>in</strong><br />
thous<strong>and</strong>s)<br />
Absolute<br />
growth by 2016<br />
Expected<br />
growth (%)<br />
Hong Kong 13,055 5,731 44%<br />
Macau 7,672 1,888 25%<br />
South Korea 2,183 2,113 x 2<br />
Taiwan 2,150 1,424 66%<br />
Thail<strong>and</strong> 1,680 1,458 87%<br />
S<strong>in</strong>gapore 1,640 1,627 x 2<br />
Malaysia 1,225 477 39%<br />
USA 1,098 1,899 x 2.7<br />
Vietnam 1,027 830 81%<br />
France 984 648 66%<br />
Source: Euromonitor, 8 March 2012<br />
In terms <strong>of</strong> spend<strong>in</strong>g, the BCG expects Ch<strong>in</strong>a to<br />
surpass Japan as the second largest travel <strong>and</strong><br />
tourism market <strong>in</strong> the world by 2013, represent<strong>in</strong>g<br />
8% <strong>of</strong> global tourism revenue <strong>in</strong> that year <strong>and</strong><br />
grow<strong>in</strong>g to 14% by 2020. The US is expected to<br />
rema<strong>in</strong> No 1, represent<strong>in</strong>g 27% <strong>of</strong> the global<br />
travel market <strong>in</strong> 2013 <strong>and</strong> 25% <strong>in</strong> 2020.<br />
Ch<strong>in</strong>ese travellers, as a group, are now ranked the<br />
third biggest spenders <strong>in</strong> the world, followed by<br />
German <strong>and</strong> American travellers, climb<strong>in</strong>g from<br />
No 4 position <strong>in</strong> 2009 <strong>and</strong> No 5 <strong>in</strong> 2007,<br />
accord<strong>in</strong>g to UNWTO. However, look<strong>in</strong>g at per<br />
capita data, Ch<strong>in</strong>ese travellers are spend<strong>in</strong>g about<br />
only one-fifth <strong>of</strong> what the average Russian spends<br />
on holiday. There is therefore room for Ch<strong>in</strong>ese<br />
travellers to both travel more <strong>of</strong>ten, <strong>and</strong> to spend<br />
more on their holidays.<br />
Ch<strong>in</strong>a's travel <strong>and</strong> leisure market value (RMBbn) 2010-20e Ch<strong>in</strong>a's travel <strong>and</strong> leisure market, number <strong>of</strong> trips (m), 2010-20e<br />
6,000<br />
5,000<br />
3,911<br />
3,000<br />
2,500<br />
2,380<br />
4,000<br />
2,000<br />
3,000<br />
2,000<br />
1,000<br />
0<br />
1,163<br />
321<br />
1,544<br />
1,500<br />
1,000<br />
500<br />
0<br />
1 ,021<br />
37 101<br />
2010 2020e<br />
2010 2020e<br />
Outbound trips<br />
Domestic trips<br />
Outbound trips<br />
Do mestic trips<br />
Source: BCG<br />
Source: BCG<br />
27
Consumer Br<strong>and</strong>s & Retail<br />
Global luxury goods<br />
September 2012<br />
abc<br />
Ma<strong>in</strong>l<strong>and</strong> tourist spend<strong>in</strong>g, 2000-10 Breakdown <strong>of</strong> ma<strong>in</strong>l<strong>and</strong> visitor spend<strong>in</strong>g <strong>in</strong> Hong Kong, 2010<br />
HKD mn<br />
100,000<br />
80,000<br />
60,000<br />
40,000<br />
20,000<br />
0<br />
100%<br />
80%<br />
60%<br />
40%<br />
20%<br />
0%<br />
2000 2002 2004 2006 2008 2010<br />
Same day visitor spend<br />
Overnight visitor spend<br />
yoy growth (same day)<br />
yoy growth (overnight)<br />
Me als<br />
Outside Hotel<br />
9%<br />
Others<br />
Shopp<strong>in</strong>g<br />
7%<br />
73%<br />
Hotel Bills<br />
11%<br />
Source: HK Tourism Board, HSBC<br />
Source: CEIC, HSBC: edit<br />
Ch<strong>in</strong>ese tourists <strong>in</strong> Australia already spend an<br />
average <strong>of</strong> USD3,000 per trip versus USD1,000<br />
for an American or European visitor.<br />
On average, Ch<strong>in</strong>ese travellers spend more than onethird<br />
<strong>of</strong> their travel budget on shopp<strong>in</strong>g versus 11%<br />
on accommodation or food. This differs from<br />
Americans or Germans, who are likely to spend<br />
more on accommodation. Given the current low<br />
level <strong>of</strong> per capita spend<strong>in</strong>g on travel, the potential<br />
for shopp<strong>in</strong>g spend<strong>in</strong>g by Ch<strong>in</strong>ese travellers to<br />
<strong>in</strong>crease further is substantial, <strong>in</strong> our view. When<br />
travell<strong>in</strong>g to Hong Kong (see chart top right), this<br />
pattern <strong>of</strong> spend<strong>in</strong>g by Ch<strong>in</strong>ese consumers is even<br />
more extreme, with the purpose <strong>of</strong> the visit clearly<br />
be<strong>in</strong>g to shop.<br />
In France, we estimate Ch<strong>in</strong>ese consumers’ spend<strong>in</strong>g<br />
represented close to 30% <strong>of</strong> total luxury goods sales<br />
<strong>in</strong> the country last year. Accord<strong>in</strong>g to the Paris<br />
Tourism Board, 60% <strong>of</strong> Ch<strong>in</strong>ese travellers’ budget <strong>in</strong><br />
Paris is dedicated to shopp<strong>in</strong>g.<br />
The issues <strong>of</strong> travel<br />
Hong Kong issues <strong>and</strong> why we believe <strong>in</strong> Taipei<br />
Look<strong>in</strong>g at the table on page 12, it is strik<strong>in</strong>g to see<br />
that rents <strong>in</strong> Hong Kong can be six times higher than<br />
<strong>in</strong> Beij<strong>in</strong>g per square foot. For now, sales density is<br />
also much higher so most br<strong>and</strong>s are still mak<strong>in</strong>g<br />
good four-wall pr<strong>of</strong>its but there are some limits:<br />
Quality <strong>of</strong> service: Ch<strong>in</strong>ese shoppers don’t<br />
seem to m<strong>in</strong>d queu<strong>in</strong>g outside Cartier on Canton<br />
Road, Tsim Sha Tsui (a major shopp<strong>in</strong>g district<br />
<strong>in</strong> Hong Kong). But as consumers become more<br />
sophisticated, they embrace the fact that the real<br />
luxury <strong>of</strong> shopp<strong>in</strong>g for high end items is time,<br />
space <strong>and</strong> dedicated sales staff.<br />
Breakdown <strong>of</strong> ma<strong>in</strong>l<strong>and</strong> overnight visitor spend<strong>in</strong>g <strong>in</strong> Hong Kong, 2008-10<br />
% <strong>of</strong> total M ai nl<strong>and</strong> overnig ht visitor<br />
spen d<strong>in</strong> g<br />
35%<br />
30%<br />
25%<br />
20%<br />
15%<br />
10%<br />
5%<br />
0%<br />
Jew ellery <strong>and</strong><br />
watch<br />
Garment/ Fabrics<br />
Leather/ Cosmetics & sk<strong>in</strong><br />
Sy nthetic Goods care/ Perfume<br />
2008 2009 2010<br />
Electrical/<br />
Photographic<br />
Goods<br />
Foodstuff, alcohol<br />
<strong>and</strong> tobacco<br />
Personal care<br />
(sham poo,<br />
diapers etc)<br />
Other items<br />
Source: HK Tourism Board, HSBC<br />
28
Consumer Br<strong>and</strong>s & Retail<br />
Global luxury goods<br />
September 2012<br />
abc<br />
Where do rents stop: Abercrombie & Fitch<br />
just opened its first flagship this summer on<br />
Pedder Street <strong>in</strong> Hong Kong (where<br />
Richemont’s Shanghai Tang br<strong>and</strong> used to be)<br />
<strong>and</strong> is pay<strong>in</strong>g rent north <strong>of</strong> USD1m a month.<br />
Shopp<strong>in</strong>g malls are <strong>red</strong>uc<strong>in</strong>g space for food<br />
courts <strong>and</strong> exp<strong>and</strong><strong>in</strong>g luxury stores. Some<br />
streets on Hong Kong Isl<strong>and</strong> (Russell Street<br />
for <strong>in</strong>stance) have a huge number <strong>of</strong> watch<br />
stores. Out <strong>of</strong> 71 stores that were rented for<br />
more than HKD1m <strong>in</strong> Hong Kong dur<strong>in</strong>g<br />
2011, 16 were rented by watch retailers. To<br />
counter the issue <strong>of</strong> a lack <strong>of</strong> space, some<br />
shopp<strong>in</strong>g mall operators are now us<strong>in</strong>g popup<br />
store concepts (e.g, Tiffany pop-up store <strong>in</strong><br />
the L<strong>and</strong>mark).<br />
Tension between Hong Kong locals <strong>and</strong><br />
ma<strong>in</strong>l<strong>and</strong> Ch<strong>in</strong>ese: with different dialects<br />
<strong>and</strong> social norms, there is grow<strong>in</strong>g tension<br />
between Hong Kong locals <strong>and</strong> ma<strong>in</strong>l<strong>and</strong><br />
Ch<strong>in</strong>ese visitors (e.g., the Dolce & Gabbana<br />
<strong>in</strong>cident <strong>in</strong> early January 2012).<br />
Hotel capacity <strong>in</strong> Hong Kong is now close to<br />
100% (89% <strong>in</strong> June 2012), car traffic (with<br />
<strong>in</strong>com<strong>in</strong>g ma<strong>in</strong>l<strong>and</strong>ers) is becom<strong>in</strong>g more<br />
severe <strong>and</strong> the lack <strong>of</strong> commercial space is<br />
becom<strong>in</strong>g an issue.<br />
On a recent trip to Taiwan, we met br<strong>and</strong><br />
operators at the newly refurbished Taipei 101<br />
luxury mall, tell<strong>in</strong>g us that Taipei is Hong<br />
Kong’s biggest rival for luxury. We th<strong>in</strong>k this<br />
makes a lot <strong>of</strong> sense given:<br />
Ch<strong>in</strong>a <strong>and</strong> Taiwan have lifted restrictions on<br />
visits from ma<strong>in</strong>l<strong>and</strong> Ch<strong>in</strong>ese to Taiwan.<br />
Direct flights have multiplied. The ban on<br />
solo Ch<strong>in</strong>ese travellers was lifted <strong>in</strong> June<br />
2011. Effective 28 April 2012, Taiwan<br />
doubled its quota <strong>of</strong> <strong>in</strong>dependent Ch<strong>in</strong>ese<br />
tourists to allow up to 1,000 visitors a day.<br />
While only people from Beij<strong>in</strong>g, Shanghai<br />
<strong>and</strong> Xiamen were allowed to visit, under the<br />
new measures <strong>in</strong>dependent travellers from six<br />
more cities have been admitted, with another<br />
four cities to be added later <strong>in</strong> the year. In<br />
2011, more than 1.78m Ch<strong>in</strong>ese visited<br />
Taiwan (versus 28m <strong>in</strong> Hong Kong), mak<strong>in</strong>g<br />
Ch<strong>in</strong>a the biggest source <strong>of</strong> visitors to the<br />
isl<strong>and</strong> (ahead <strong>of</strong> Japan), accord<strong>in</strong>g to the<br />
Tourism Bureau.<br />
Taiwanese speak Putonghua (M<strong>and</strong>ar<strong>in</strong>), the<br />
flight time from Shanghai is just over an hour<br />
<strong>and</strong> there is no congestion <strong>in</strong> the shops. We<br />
estimate Ch<strong>in</strong>ese nationals represent 25% <strong>of</strong><br />
sales <strong>in</strong> Taipei 101 Mall, <strong>and</strong> the stores are<br />
br<strong>and</strong> new <strong>and</strong> amongst the most impressive<br />
<strong>in</strong> the world (notably the Christian Dior<br />
flagship). Malls are also a st<strong>and</strong>ard stop for<br />
tour groups (which we regard as a captive<br />
audience).<br />
With Matsu residents vot<strong>in</strong>g to allow<br />
Taiwan’s first cas<strong>in</strong>o to be built open on their<br />
isl<strong>and</strong>, Taiwan could become the next Macau.<br />
Ironically, the cas<strong>in</strong>o bus<strong>in</strong>ess could help fill<br />
the void left <strong>in</strong> the economy by the decl<strong>in</strong>e <strong>in</strong><br />
military personnel numbers <strong>in</strong> Taiwan (from<br />
50,000 dur<strong>in</strong>g the Cold War to 3,000 today),<br />
which was re<strong>in</strong>forced by the détente between<br />
Beij<strong>in</strong>g <strong>and</strong> Taipei <strong>in</strong> 2008.<br />
Ch<strong>in</strong>ese visitors spent about 60% <strong>of</strong> their<br />
budget <strong>in</strong> Taiwan on shopp<strong>in</strong>g <strong>and</strong> 98% were<br />
satisfied with their trip <strong>and</strong> said they would<br />
consider return<strong>in</strong>g. A survey found that the<br />
three most popular tourist attractions <strong>in</strong><br />
Taiwan are night markets, the Taipei 101<br />
skyscraper <strong>and</strong> the National Palace Museum.<br />
Tourists also said they were most impressed<br />
by the hospitality <strong>of</strong> Taiwanese, the country's<br />
gourmet food <strong>and</strong> the unique ambiance <strong>of</strong> the<br />
night markets. (Taiwan Tourism Association).<br />
29
Consumer Br<strong>and</strong>s & Retail<br />
Global luxury goods<br />
September 2012<br />
abc<br />
Runn<strong>in</strong>g empty showrooms<br />
Many <strong>in</strong>vestors travell<strong>in</strong>g to ma<strong>in</strong>l<strong>and</strong> Ch<strong>in</strong>a f<strong>in</strong>d<br />
that the luxury shopp<strong>in</strong>g malls look half empty.<br />
Indeed, while the average ticket is similar to the<br />
global average, traffic is much lower.<br />
With the acceleration <strong>in</strong> the transfer <strong>of</strong> Ch<strong>in</strong>ese<br />
luxury consumption to overseas markets (notably to<br />
Europe), these stores may cont<strong>in</strong>ue to look half<br />
empty for a while. As we expla<strong>in</strong>ed previously, there<br />
are good reasons for the retail operations <strong>of</strong> br<strong>and</strong>s <strong>in</strong><br />
Ch<strong>in</strong>a to be more pr<strong>of</strong>itable than the average for<br />
their other stores around the world. However, as<br />
rents <strong>and</strong> wages cont<strong>in</strong>ue to <strong>in</strong>crease, marg<strong>in</strong>s may<br />
come under pressure <strong>in</strong> local operations, especially if<br />
an <strong>in</strong>creas<strong>in</strong>g number <strong>of</strong> Ch<strong>in</strong>ese consumers treat<br />
local stores as showrooms for products that they can<br />
go <strong>and</strong> buy more cheaply elsewhere<br />
Runn<strong>in</strong>g stores for some br<strong>and</strong>s is ak<strong>in</strong> to<br />
advertis<strong>in</strong>g. Chanel has very few stores <strong>in</strong> ma<strong>in</strong>l<strong>and</strong><br />
Ch<strong>in</strong>a; they are there to facilitate product discovery.<br />
The larger br<strong>and</strong>s, which carry goods at more<br />
accessible price po<strong>in</strong>ts <strong>and</strong> have greater retail<br />
footpr<strong>in</strong>ts, cannot afford to run unpr<strong>of</strong>itable stores<br />
<strong>and</strong> would have to resize or relocate some stores.<br />
Alienat<strong>in</strong>g local Western consumers<br />
Wealthy Ch<strong>in</strong>ese tourists, who are hungry for<br />
br<strong>and</strong>s, can get a good deal <strong>in</strong> Europe, especially<br />
after they claim back the VAT. The issue is that<br />
price po<strong>in</strong>ts will have to converge at some stage. As<br />
it is unlikely that the br<strong>and</strong>s will lower prices <strong>in</strong><br />
Ch<strong>in</strong>a (for br<strong>and</strong> equity reasons), we th<strong>in</strong>k it is<br />
<strong>in</strong>creas<strong>in</strong>gly likely that br<strong>and</strong>s will <strong>in</strong>crease prices <strong>in</strong><br />
Europe to try to m<strong>in</strong>imise the gap.<br />
Los<strong>in</strong>g out on gross marg<strong>in</strong><br />
Some management teams have said it is pretty much<br />
irrelevant to the P&L structure whether the sales<br />
were <strong>in</strong> Asia or Europe.<br />
We disagree. We believe that Asian sales, given the<br />
price po<strong>in</strong>ts <strong>and</strong> despite the shipp<strong>in</strong>g costs, ensure<br />
much higher gross marg<strong>in</strong>s for the br<strong>and</strong>s than if<br />
they were sell<strong>in</strong>g the same products <strong>in</strong> Europe.<br />
Whilst the proportion <strong>of</strong> fixed costs is greater <strong>in</strong><br />
Europe (rents, staff costs), imply<strong>in</strong>g that Ch<strong>in</strong>ese<br />
tourists feed <strong>in</strong>to the operat<strong>in</strong>g leverage <strong>of</strong> European<br />
operations, we are not conv<strong>in</strong>ced the EBIT<br />
contribution <strong>of</strong> European sales is as positive as if the<br />
br<strong>and</strong>s were sell<strong>in</strong>g locally <strong>in</strong> Asia.<br />
The CO-J-A-C theory <strong>of</strong> br<strong>and</strong> evolution<br />
We believe that the global expansion <strong>of</strong> luxury<br />
players should follow certa<strong>in</strong> steps, as some<br />
consumers may be early adopters (typically the<br />
Japanese) <strong>and</strong> others laggards (typically the<br />
Westerners <strong>and</strong> Ch<strong>in</strong>ese). This is l<strong>in</strong>ked to various<br />
cultural, social <strong>and</strong> economic factors. Look<strong>in</strong>g at<br />
both br<strong>and</strong>s that have successfully <strong>and</strong> not so<br />
successfully exp<strong>and</strong>ed, we have come to the<br />
conclusion that there is a logical path <strong>of</strong> expansion.<br />
CO-J-A-C: diffusion <strong>of</strong> a luxury br<strong>and</strong> globally<br />
Cont<strong>in</strong>ent <strong>of</strong> Orig<strong>in</strong><br />
(up to now, Europe or America)<br />
Japan<br />
Prada <strong>in</strong>creased prices by 4-5% <strong>in</strong> Europe <strong>in</strong> July<br />
2012 across the board. We believe this is a logical<br />
move from a f<strong>in</strong>ancial po<strong>in</strong>t <strong>of</strong> view. The risk though<br />
is that br<strong>and</strong>s will alienate local European consumers<br />
who might take the view that the prices <strong>of</strong> luxury<br />
products have become too expensive.<br />
Source: HSBC<br />
Atlantic alternative<br />
(America or Europe)<br />
Ch<strong>in</strong>a<br />
30
Consumer Br<strong>and</strong>s & Retail<br />
Global luxury goods<br />
September 2012<br />
abc<br />
CO: it is logical that first adopters <strong>of</strong> a product<br />
should be situated <strong>in</strong> the Cont<strong>in</strong>ent <strong>of</strong> Orig<strong>in</strong> <strong>of</strong><br />
the br<strong>and</strong> that produces it. The <strong>French</strong> <strong>and</strong> British<br />
used to dr<strong>in</strong>k cognac. The Italians were the ones<br />
who made Gucci’s <strong>and</strong> Prada’s success <strong>and</strong> are<br />
still the ma<strong>in</strong> driver beh<strong>in</strong>d Tod’s. Coach was<br />
virtually unknown outside the US dur<strong>in</strong>g the<br />
br<strong>and</strong>’s first 50 years.<br />
J: we do not know if it is fasc<strong>in</strong>ation with the<br />
Western lifestyle, eagerness to adopt new trends<br />
or wealth but Japan has <strong>of</strong>ten been a trendsetter <strong>in</strong><br />
the premium consumer sector. Louis Vuitton <strong>and</strong><br />
Hennessy cognac boomed <strong>in</strong> Japan <strong>in</strong> the early<br />
1990s, Hermès’ <strong>and</strong> Bulgari’s presence is still<br />
massive there because <strong>of</strong> early <strong>in</strong>vestments,<br />
Coach <strong>and</strong> Tiffany’s largest expansion after the<br />
US was there <strong>and</strong> Burberry’s Japanese license was<br />
signed decades ago mak<strong>in</strong>g Japan its largest<br />
market still today (at retail). It is not surpris<strong>in</strong>g<br />
either that some <strong>of</strong> Louis Vuitton’s successes have<br />
been thought up <strong>in</strong> Japan, <strong>in</strong>clud<strong>in</strong>g the Takashi<br />
Murakami collaboration start<strong>in</strong>g <strong>in</strong> 2003 <strong>and</strong> now<br />
the collaboration with artist Yasoi Kusama.<br />
A: when a br<strong>and</strong> succeeds at home <strong>and</strong> <strong>in</strong> Japan,<br />
the next logical step becomes to attack the<br />
“Atlantic alternative” (the US if the br<strong>and</strong> is<br />
European, <strong>and</strong> Western Europe if it is a US<br />
br<strong>and</strong>). Cartier <strong>and</strong> Louis Vuitton made it big <strong>in</strong><br />
the US long after Japan while Tiffany for <strong>in</strong>stance<br />
is still under-penetrated <strong>in</strong> Europe (c50% <strong>of</strong><br />
European sales are still <strong>in</strong> London) <strong>and</strong> Coach is<br />
virtually nowhere.<br />
C: this is when the br<strong>and</strong> f<strong>in</strong>ally makes it to<br />
Ch<strong>in</strong>a. Of course there may be other markets, but<br />
sizeable markets other than Ch<strong>in</strong>a are difficult to<br />
forecast at this stage. All major luxury br<strong>and</strong>s<br />
have started <strong>in</strong>vest<strong>in</strong>g heavily <strong>in</strong> Ch<strong>in</strong>a.<br />
So what could go wrong? Here are a few<br />
examples <strong>of</strong> br<strong>and</strong>s not hav<strong>in</strong>g followed the path<br />
<strong>and</strong> thus, <strong>in</strong> our view, now fac<strong>in</strong>g some risks.<br />
Lancel: this <strong>French</strong> br<strong>and</strong> (part <strong>of</strong> Richemont)<br />
started <strong>of</strong>f develop<strong>in</strong>g <strong>in</strong> Japan <strong>and</strong> made an<br />
unsuccessful attempt <strong>in</strong> the US before enter<strong>in</strong>g<br />
Ch<strong>in</strong>a with high ambitions <strong>and</strong> a local partner.<br />
Coach: for a number <strong>of</strong> reasons <strong>in</strong>clud<strong>in</strong>g limited<br />
awareness, strong local competitors, less<br />
pr<strong>of</strong>itable retail operations (key money), Coach<br />
has not made it <strong>in</strong> Europe <strong>and</strong> we are cautious on<br />
its prospects for expansion there. Still, Coach<br />
opened a first store <strong>in</strong> Le Pr<strong>in</strong>temps, <strong>in</strong> Paris,<br />
which we believe might be more a case <strong>of</strong> try<strong>in</strong>g<br />
to <strong>in</strong>crease br<strong>and</strong> visibility to tourists, particularly<br />
the Ch<strong>in</strong>ese <strong>and</strong> Americans, than an attempt to<br />
capture the locals.<br />
The biggest danger <strong>in</strong> not tak<strong>in</strong>g the “CO-J-A-C”<br />
path <strong>in</strong> our m<strong>in</strong>d is that by skipp<strong>in</strong>g countries or<br />
regions, br<strong>and</strong>s can become too dependent on a<br />
s<strong>in</strong>gle region. Logically, if 50% or more <strong>of</strong> sales<br />
take place <strong>in</strong> one region, the risk is that<br />
management adjusts the nature <strong>of</strong> the br<strong>and</strong> to try<br />
to adapt to local tastes. Ch<strong>in</strong>ese luxury consumers<br />
purchase Western goods for what they are. We are<br />
conv<strong>in</strong>ced that some br<strong>and</strong>s have become too<br />
Asia-dependent <strong>in</strong> their design <strong>and</strong><br />
communication; hence los<strong>in</strong>g some <strong>of</strong> their<br />
<strong>in</strong>herent dist<strong>in</strong>ctive attributes.<br />
Beyond this geographic evolution <strong>of</strong> br<strong>and</strong>s, we<br />
also very much believe that Ch<strong>in</strong>ese luxury<br />
consumption is <strong>in</strong>fluenced by Japanese trends, i.e.<br />
lead<strong>in</strong>g br<strong>and</strong>s <strong>in</strong> Japan have a better chance <strong>of</strong><br />
be<strong>in</strong>g successful <strong>in</strong> Ch<strong>in</strong>a as consumers look East<br />
for the latest trends (travell<strong>in</strong>g more <strong>and</strong> more to<br />
Tokyo), <strong>and</strong> closer to home. Shanghai-based<br />
consumers also go to Japan more.<br />
While br<strong>and</strong>s must be aware <strong>of</strong> regional<br />
differences, it is important that they do not overly<br />
adapt their designs to the Ch<strong>in</strong>ese market as a<br />
more Ch<strong>in</strong>ese-look<strong>in</strong>g br<strong>and</strong> could lose its appeal.<br />
31
Consumer Br<strong>and</strong>s & Retail<br />
Global luxury goods<br />
September 2012<br />
abc<br />
The threat <strong>of</strong> overdependence<br />
Ten years ago, the concern was that luxury sales<br />
were European-based with a strong Japanese<br />
follow<strong>in</strong>g, <strong>and</strong> that Japanese consumers had started<br />
to represent such a huge chunk <strong>of</strong> sales that their<br />
attitudes could make or break a br<strong>and</strong>’s commercial<br />
success.<br />
Three years ago, the luxury sector became more<br />
global. It had a decent proportion <strong>of</strong> revenues from<br />
the US (although less than the US percentage <strong>of</strong><br />
global GDP), a strong presence <strong>in</strong> Asia ex-Japan<br />
(Korea, Greater Ch<strong>in</strong>a) <strong>and</strong> pockets <strong>of</strong> growth<br />
elsewhere (Eastern Europe, Middle East).<br />
Now, the Ch<strong>in</strong>ese have become the dom<strong>in</strong>ant group<br />
<strong>of</strong> consumers, which aga<strong>in</strong> poses the risk <strong>of</strong> the<br />
luxury br<strong>and</strong>s hav<strong>in</strong>g too many eggs <strong>in</strong> the<br />
same basket.<br />
Our analysis <strong>of</strong> sales by nationality for Louis Vuitton<br />
(to a certa<strong>in</strong> extent a proxy for the sector), shows that<br />
Ch<strong>in</strong>ese nationals could represent 31% <strong>of</strong> sales <strong>in</strong><br />
just three years.<br />
In recent months, many br<strong>and</strong>s have been open<strong>in</strong>g<br />
new flagship stores. The high levels <strong>of</strong> capex posted<br />
on these store launches suggest the br<strong>and</strong>s are go<strong>in</strong>g<br />
beyond try<strong>in</strong>g to catch up with pre-crisis levels <strong>and</strong><br />
are exp<strong>and</strong><strong>in</strong>g aggressively. In addition, many <strong>of</strong><br />
these new flagships are be<strong>in</strong>g built <strong>in</strong> Europe,<br />
mak<strong>in</strong>g them particularly risky <strong>in</strong>vestments should<br />
Ch<strong>in</strong>ese consumption <strong>in</strong> Europe dry up ow<strong>in</strong>g to a<br />
reversal <strong>in</strong> currency trends (i.e. the EUR strengthens)<br />
or regulations change <strong>in</strong> Ch<strong>in</strong>a.<br />
Capital is less <strong>of</strong> an issue for big groups that<br />
deleveraged <strong>in</strong> 2008-09. However, the wisdom <strong>of</strong><br />
global expansion right now could be called <strong>in</strong>to<br />
question for smaller players.<br />
Overdependence also poses the issue <strong>of</strong> what<br />
valuation <strong>in</strong>vestors should be prepa<strong>red</strong> to pay<br />
given growth is still strong for the sector but much<br />
<strong>of</strong> it is l<strong>in</strong>ked to a s<strong>in</strong>gle consumer base: the<br />
Ch<strong>in</strong>ese.<br />
The emerg<strong>in</strong>g market theme is one that goes way<br />
beyond the realm <strong>of</strong> luxury stocks. What is<br />
<strong>in</strong>terest<strong>in</strong>g though is that for luxury, Ch<strong>in</strong>ese<br />
consumers are by far the most important driver.<br />
Unlike fast mov<strong>in</strong>g consumer goods companies<br />
(say, beverages), luxury goods have a limited<br />
footpr<strong>in</strong>t <strong>in</strong> Russia, India, Latam <strong>and</strong> Africa for<br />
reasons that are either economic (affordability),<br />
cultural or l<strong>in</strong>ked to poor retail <strong>in</strong>frastructure, <strong>in</strong><br />
our view.<br />
We get the sense that <strong>in</strong>vestors are discount<strong>in</strong>g<br />
emerg<strong>in</strong>g market growth as a given. However, we<br />
believe a strong dependence on a s<strong>in</strong>gle market<br />
may be a double-edged sword <strong>and</strong> the market may<br />
have fully priced <strong>in</strong> the positives for now.<br />
Louis Vuitton br<strong>and</strong> sales by nationality <strong>of</strong> customer<br />
% 2003 2007 2010 2015e<br />
European 22 19 17 13<br />
American 13 15 15 14<br />
Japanese 51 36 21 15<br />
Ch<strong>in</strong>ese ma<strong>in</strong>l<strong>and</strong> & travel 4 12 21 31<br />
Other Asian 6 11 17 18<br />
Other 4 7 9 10<br />
Total 100 100 100 100<br />
Source: HSBC estimates, Company data<br />
32
Consumer Br<strong>and</strong>s & Retail<br />
Global luxury goods<br />
September 2012<br />
abc<br />
Company pr<strong>of</strong>iles<br />
33
Consumer Br<strong>and</strong>s & Retail<br />
Global luxury goods<br />
September 2012<br />
abc<br />
Burberry<br />
Lack <strong>of</strong> operat<strong>in</strong>g leverage (at least <strong>in</strong> the short term) despite strong<br />
sales growth may now become an issue, especially s<strong>in</strong>ce Prada <strong>and</strong><br />
Ferragamo have been listed <strong>and</strong> both display strong growth <strong>and</strong><br />
leverage<br />
We see uncerta<strong>in</strong>ties <strong>in</strong> perfumes <strong>and</strong> cosmetics operations <strong>and</strong><br />
regard<strong>in</strong>g the future <strong>of</strong> the Japanese license<br />
Rema<strong>in</strong> Neutral (add<strong>in</strong>g V-flag); decrease target price to 1,500p<br />
(from 1,550p); valuation not supportive (trad<strong>in</strong>g at 16.9x FY13e PE,<br />
an 11% premium to peers)<br />
11% PE premium not justified<br />
Still a top-l<strong>in</strong>e growth story<br />
Burberry has been repositioned from a UK<br />
outerwear manufacturer to a successful global br<strong>and</strong>,<br />
embrac<strong>in</strong>g a strong retail roll-out <strong>and</strong> <strong>in</strong>vest<strong>in</strong>g<br />
heavily <strong>in</strong> digital market<strong>in</strong>g (more than 10m<br />
Facebook fans, art<strong>of</strong>thetrench website etc.) to<br />
capture a younger <strong>and</strong> more connected generation.<br />
Over the last few years, the British icon has<br />
consistently outperformed the <strong>in</strong>dustry <strong>in</strong> terms <strong>of</strong><br />
sales growth <strong>and</strong> has taken advantage <strong>of</strong> this to clean<br />
its distribution network (tak<strong>in</strong>g back licenses, clos<strong>in</strong>g<br />
its country-specific bus<strong>in</strong>ess <strong>in</strong> Spa<strong>in</strong>, cutt<strong>in</strong>g the<br />
number <strong>of</strong> wholesale doors etc.). In terms <strong>of</strong><br />
sentiment, we believe management has successfully<br />
conv<strong>in</strong>ced even the most sceptical <strong>in</strong>vestors about<br />
the strength <strong>of</strong> the Burberry br<strong>and</strong>.<br />
Need some clarification on two<br />
bus<strong>in</strong>esses<br />
The perfumes <strong>and</strong> cosmetics license: on 27 July,<br />
Burberry announced that discussions with<br />
InterParfums regard<strong>in</strong>g the renewal for the Burberry<br />
fragrance <strong>and</strong> beauty bus<strong>in</strong>ess had been term<strong>in</strong>ated<br />
(note that this bus<strong>in</strong>ess represented 2% <strong>of</strong> Burberry<br />
sales but generated EUR211m sales <strong>in</strong> 2011 at<br />
wholesale value). At the end <strong>of</strong> December 2012, the<br />
contract will be term<strong>in</strong>ated <strong>and</strong> Burberry will have to<br />
pay a GBP181m <strong>in</strong>demnity <strong>in</strong> cash to compensate<br />
for the time left <strong>in</strong> the contract (which was to expire<br />
end-2017). Burberry has not yet announced how it<br />
will h<strong>and</strong>le this bus<strong>in</strong>ess go<strong>in</strong>g forward (the group<br />
can operate <strong>in</strong>ternally or f<strong>in</strong>d another partner, <strong>in</strong> our<br />
view). Whatever the outcome, we believe Burberry<br />
is now under pressure to generate enough<br />
<strong>in</strong>cremental bus<strong>in</strong>ess to justify the hefty price paid.<br />
34
Consumer Br<strong>and</strong>s & Retail<br />
Global luxury goods<br />
September 2012<br />
abc<br />
The Japanese license: Burberry’s Japanese<br />
bus<strong>in</strong>ess, still under license for apparel, needs to be<br />
taken back <strong>and</strong> this should happen only when the<br />
contract expires <strong>in</strong> 2015 (note that annual br<strong>and</strong> sales<br />
at retail equivalent represented cGBP1bn <strong>in</strong> FY<br />
March 2012). We acknowledge that term<strong>in</strong>at<strong>in</strong>g the<br />
license will be a good th<strong>in</strong>g <strong>in</strong> terms <strong>of</strong> br<strong>and</strong> image,<br />
but the market needs to have some clarity on how<br />
this bus<strong>in</strong>ess will be operated <strong>and</strong> at what cost. In the<br />
past, the takeover <strong>of</strong> their licences by Dior <strong>and</strong> YSL<br />
demonstrated that it can take a while before a br<strong>and</strong><br />
can generate more pr<strong>of</strong>its by operat<strong>in</strong>g directly<br />
rather than through a licence.<br />
Lack <strong>of</strong> operat<strong>in</strong>g leverage <strong>in</strong> the short<br />
term<br />
On top <strong>of</strong> the two significant uncerta<strong>in</strong>ties<br />
mentioned above, the market expectations <strong>of</strong> f<strong>in</strong>ally<br />
see<strong>in</strong>g operat<strong>in</strong>g leverage come through have once<br />
aga<strong>in</strong> been postponed, when Burberry gave its <strong>in</strong>itial<br />
FY March 13 EBIT marg<strong>in</strong> guidance for<br />
Wholesale/Retail, call<strong>in</strong>g for a “modest<br />
improvement over the full year, but a decl<strong>in</strong>e <strong>in</strong><br />
1H12 due to the phas<strong>in</strong>g <strong>of</strong> <strong>in</strong>vestment”. This is<br />
exactly the same guidance given a year before for<br />
FY March 12; however, we believe Burberry will<br />
cont<strong>in</strong>ue to be a top-l<strong>in</strong>e story rather than a marg<strong>in</strong><br />
story for at least one more year.<br />
From an <strong>in</strong>dustry st<strong>and</strong>po<strong>in</strong>t, this may not be an<br />
issue per se: we underst<strong>and</strong> the rationale for<br />
<strong>in</strong>vest<strong>in</strong>g beh<strong>in</strong>d new avenues for growth, <strong>and</strong> it<br />
makes sense to <strong>in</strong>vest <strong>in</strong> the development <strong>of</strong> a<br />
second-to-none digital market<strong>in</strong>g platform. This<br />
would ensure great visibility on the recruitment <strong>of</strong><br />
new consumers, as well as creat<strong>in</strong>g a potential buzz<br />
on the br<strong>and</strong> with a younger consumer pr<strong>of</strong>ile.<br />
From a stock market st<strong>and</strong>po<strong>in</strong>t, this may be an<br />
issue, given Prada <strong>and</strong> Ferragamo have been listed <strong>in</strong><br />
2011 <strong>and</strong> they both display strong sales potential<br />
with significant operat<strong>in</strong>g leverage.<br />
Earn<strong>in</strong>gs, valuation <strong>and</strong> risks<br />
Company guidance for FY March 2013 <strong>in</strong>cludes:<br />
Retail space (average) <strong>in</strong>crease <strong>of</strong> 12-14%,<br />
which should translate <strong>in</strong>to +8-9% sales growth.<br />
We factor <strong>in</strong> 16% retail sales growth at constant<br />
FX with 7% comps<br />
Wholesale revenue to be up mid-s<strong>in</strong>gle digits at<br />
constant FX <strong>in</strong> H1, <strong>in</strong>clud<strong>in</strong>g the rationalisation <strong>in</strong><br />
the US <strong>and</strong> <strong>in</strong> Europe. We factor <strong>in</strong> 6% growth at<br />
constant FX<br />
Licence revenues over the full year should be flat<br />
at constant FX <strong>and</strong> <strong>in</strong> reported terms. We factor <strong>in</strong><br />
0% growth at constant FX<br />
We have kept our FY March 2013-15 EBIT estimates<br />
unchanged. For 2013e, 2014e <strong>and</strong> 2015e, we forecast<br />
organic sales growth <strong>of</strong> 13%, 12% <strong>and</strong> 11%,<br />
respectively. In terms <strong>of</strong> EBIT marg<strong>in</strong>, we expect<br />
20.6% (vs 20.8% previously), 21.0% (vs 21.2%<br />
previously) <strong>and</strong> 21.2%, respectively, for FY March<br />
2013-15e. Note that Burberry, which reports <strong>in</strong> GBP,<br />
does not benefit as much from the recent FX moves as<br />
other companies report<strong>in</strong>g <strong>in</strong> EUR <strong>and</strong> CHF.<br />
We decrease our DCF-based target price to 1,500p<br />
from 1,550p on the back <strong>of</strong> lower medium-term<br />
assumptions beyond March 2015 to reflect the<br />
uncerta<strong>in</strong>ties on the Japanese license. The assumptions<br />
used to generate our target price are detailed on page<br />
37. Under our research model, the Neutral b<strong>and</strong> for<br />
volatile UK stocks is 10 percentage po<strong>in</strong>ts above <strong>and</strong><br />
below the hurdle rate <strong>of</strong> 7.5%. Our 1,500p target price<br />
provides a 10.3% potential return, which is with<strong>in</strong> the<br />
Neutral range; therefore we reiterate our Neutral (V)<br />
rat<strong>in</strong>g. We add the volatility flag <strong>in</strong> recognition <strong>of</strong> the<br />
stock’s historical volatility hav<strong>in</strong>g <strong>in</strong>creased. Potential<br />
return equals the percentage difference between the<br />
current share price <strong>and</strong> the target price, <strong>in</strong>clud<strong>in</strong>g the<br />
forecast dividend yield when <strong>in</strong>dicated.<br />
35
Consumer Br<strong>and</strong>s & Retail<br />
Global luxury goods<br />
September 2012<br />
abc<br />
We feel the valuation is not supportive <strong>in</strong> the light<br />
<strong>of</strong> the above-mentioned uncerta<strong>in</strong>ties. Burberry<br />
shares are up 15% year-to-date, compa<strong>red</strong> to 26%<br />
for our European luxury coverage. But the stock is<br />
still trad<strong>in</strong>g at an 11% premium (16.9x FY13e PE)<br />
to its peers. The ma<strong>in</strong> downside risks to our rat<strong>in</strong>g<br />
<strong>in</strong>clude a failure to address the issue <strong>of</strong> expiration <strong>of</strong><br />
the Japanese license <strong>in</strong> 2015 (the local l<strong>in</strong>e is a<br />
significant source <strong>of</strong> pr<strong>of</strong>it, even though it is below<br />
the position<strong>in</strong>g <strong>of</strong> the <strong>in</strong>ternational l<strong>in</strong>es).<br />
In addition, as the br<strong>and</strong> has attracted outside talent<br />
<strong>in</strong> recent years, there is a risk that this talent may<br />
prove difficult to reta<strong>in</strong>. Risks to the upside <strong>in</strong>clude<br />
a potential takeover bid (Burberry rema<strong>in</strong>s a 100%<br />
free float company), <strong>and</strong> the possibility that market<br />
share ga<strong>in</strong>s translate <strong>in</strong>to much greater sales growth<br />
than we have facto<strong>red</strong> <strong>in</strong>to our model.<br />
Burberry P&L Full Year end<strong>in</strong>g March<br />
GBPm 2008a % 2009a % 2010a % 2011a % 2012a % 2013e % 2014e % 2015e %<br />
Sales 995 17 1,202 21 1,280 7 1,501 17 1,857 24 2,110 14 2,366 12 2,623 11<br />
Gross pr<strong>of</strong>it 618 18 666 8 804 21 1010 26 1299 29 1511 16 1713 13 1909 11<br />
Gross pr<strong>of</strong>it marg<strong>in</strong> 62.1% 55.4% 62.8% 67.3% 69.9% 71.6% 72.4% 72.8%<br />
Operat<strong>in</strong>g expenses 416 14 485 17 584 20 709 21 922 30 1,076 17 1,217 13 1,353 11<br />
As a % <strong>of</strong> sales 41.8% 40.4% 45.6% 47.2% 49.6% 51.0% 51.4% 51.6%<br />
Adjusted EBIT 206 11 181 -12 220 22 301 37 377 25 435 15 496 14 556 12<br />
EBIT marg<strong>in</strong> 20.7% 15.0% 17.2% 20.1% 20.3% 20.6% 21.0% 21.2%<br />
Reported EBIT 202 28 -10 -105 171 -1,828 302 77 367 21 435 19 496 14 556 12<br />
EBIT marg<strong>in</strong> 20.3% -0.8% 13.4% 20.1% 19.7% 20.6% 21.0% 21.2%<br />
Pre-tax pr<strong>of</strong>it 196 25 -16 -108 166 -1,131 296 78 366 24 440 20 506 15 571 13<br />
Reported net pr<strong>of</strong>it 135 23 -6 -104 81 -1,456 208 156 263 26 321 22 369 15 417 13<br />
Clean net pr<strong>of</strong>it 140 27 132 -6 155 17 217 40 263 21 321 22 369 15 417 13<br />
EPS (clean diluted) 31.6 28 30.2 -5 35.1 16 48.8 39 61.6 26 72.3 17 83.1 15 93.8 13<br />
Source: Company data, HSBC estimates<br />
Burberry Sales <strong>and</strong> EBIT by network – Full Year end<strong>in</strong>g March<br />
GBPm 2008a YOY<br />
% chg<br />
2009a<br />
YOY<br />
% chg<br />
2010a<br />
YOY<br />
% chg<br />
Retail sales 484 18 630 30 749 19 962 29 1270 32 1489 17 1707 15 1929 13<br />
Wholesale sales 426 20 489 15 434 -11 441 2 478 9 513 7 550 7 583 6<br />
License Sales 85 -2 83 -3 97 18 98 1 109 10 108 -1 109 2 111 1<br />
Total sales 995 17 1202 21 1280 7 1501 17 1857 24 2110 14 2366 12 2623 11<br />
Retail & Wholesale EBIT 136 21 110 -19 138 25 220 59 287 31 346 21 405 17 464 14<br />
Retail & Wholesale EBIT marg<strong>in</strong> 14.9% 9.8% 11.6% 15.6% 16.4% 17.3% 18.0% 18.5%<br />
License EBIT 71 -4 71 0 82 16 82 -1 90 10 89 -1 91 2 92 1<br />
License EBIT marg<strong>in</strong> 83.3% 85.6% 84.3% 82.9% 82.9% 82.9% 82.9% 82.9%<br />
Source: Company data, HSBC estimates<br />
2011a<br />
YOY<br />
% chg<br />
2012a<br />
YOY<br />
% chg<br />
2013e<br />
YOY<br />
% chg<br />
2014e<br />
YOY<br />
% chg<br />
2014e<br />
YOY<br />
% chg<br />
Burberry Sales by geography – Full Year end<strong>in</strong>g March<br />
GBPm 2008a YOY<br />
% chg<br />
2009a<br />
YOY<br />
% chg<br />
2010a<br />
YOY<br />
% chg<br />
Europe 453 19 524.3 16 515.0 -2 474.6 7 552.6 16 619.6 12 678.6 10 732.9 8<br />
North America 235 19 304.7 30 321.0 5 386.5 35 434.5 12 468.0 8 511.5 9 549.5 7<br />
Asia Pacific 189 13 240.0 27 282.6 18 457.1 131 652.5 43 784.0 20 911.5 16 1,048.3 15<br />
Rest <strong>of</strong> the world 33 79 49.9 50 63.9 28 84.7 71 109.0 29 130.8 20 155.0 19 181.3 17<br />
Licens<strong>in</strong>g 85 -2 82.6 -3 97.5 18 98.4 11 108.6 10 107.6 -1 109.4 2 111.0 1<br />
Total sales 995 17 1,201.5 21 1,279.9 7 1,501.3 45 1,857.7 24 2,110.0 14 2,366.0 12 2,623.0 11<br />
Source: company, HSBC estimates<br />
2011a<br />
YOY<br />
% chg<br />
2012e<br />
YOY<br />
% chg<br />
2013e<br />
YOY<br />
% chg<br />
2014e<br />
YOY<br />
% chg<br />
2014e<br />
YOY<br />
% chg<br />
36
1<br />
0<br />
.<br />
3<br />
Consumer Br<strong>and</strong>s & Retail<br />
Global luxury goods<br />
September 2012<br />
abc<br />
F<strong>in</strong>ancials & valuation: Burberry Group<br />
F<strong>in</strong>ancial statements<br />
Year to 03/2012a 03/2013e 03/2014e 03/2015e<br />
Pr<strong>of</strong>it & loss summary (GBPm)<br />
Revenue 1,857 2,110 2,366 2,623<br />
EBITDA 454 533 604 675<br />
Depreciation & amortisation -88 -98 -108 -119<br />
Operat<strong>in</strong>g pr<strong>of</strong>it/EBIT 377 435 496 556<br />
Net <strong>in</strong>terest -1 5 10 15<br />
PBT 366 440 506 571<br />
HSBC PBT 366 440 506 571<br />
Taxation -101 -119 -137 -154<br />
Net pr<strong>of</strong>it 264 321 369 417<br />
HSBC net pr<strong>of</strong>it 274 321 369 417<br />
Cash flow summary (GBPm)<br />
Cash flow from operations 358 406 466 523<br />
Capex -153 -190 -190 -190<br />
Cash flow from <strong>in</strong>vestment -161 -190 -190 -190<br />
Dividends -99 -109 -126 -145<br />
Change <strong>in</strong> net debt -40 -107 -150 -188<br />
FCF equity 181 216 276 333<br />
Balance sheet summary (GBPm)<br />
Intangible fixed assets 133 133 133 133<br />
Tangible fixed assets 329 421 503 574<br />
Current assets 1,003 1,156 1,346 1,577<br />
Cash & others 547 654 804 992<br />
Total assets 1,611 1,855 2,127 2,430<br />
Operat<strong>in</strong>g liabilities 493 526 554 585<br />
Gross debt 209 209 209 209<br />
Net debt -338 -445 -595 -783<br />
Shareholders funds 867 1,080 1,323 1,595<br />
Invested capital 425 530 624 708<br />
Ratio, growth <strong>and</strong> per share analysis<br />
Year to 03/2012a 03/2013e 03/2014e 03/2015e<br />
Y-o-y % change<br />
Revenue 23.7 13.6 12.1 10.9<br />
EBITDA 24.6 17.4 13.3 11.7<br />
Operat<strong>in</strong>g pr<strong>of</strong>it 25.2 15.4 14.0 12.1<br />
PBT 23.8 20.2 15.0 12.8<br />
HSBC EPS 26.2 17.3 15.0 12.8<br />
Ratios (%)<br />
Revenue/IC (x) 4.9 4.4 4.1 3.9<br />
ROIC 70.8 66.5 62.8 61.0<br />
ROE 34.6 33.0 30.8 28.6<br />
ROA 17.8 18.5 18.6 18.3<br />
EBITDA marg<strong>in</strong> 24.5 25.3 25.5 25.7<br />
Operat<strong>in</strong>g pr<strong>of</strong>it marg<strong>in</strong> 20.3 20.6 21.0 21.2<br />
EBITDA/net <strong>in</strong>terest (x) 649.0<br />
Net debt/equity -38.0 -40.4 -44.2 -48.4<br />
Net debt/EBITDA (x) -0.7 -0.8 -1.0 -1.2<br />
CF from operations/net debt<br />
Per share data (GBPp)<br />
EPS Rep (fully diluted) 59.33 72.30 83.14 93.82<br />
HSBC EPS (fully diluted) 61.63 72.30 83.14 93.82<br />
DPS 25.00 28.92 33.26 37.53<br />
Book value 199.20 247.95 303.84 366.28<br />
DCF analysis<br />
HSBC assumptions<br />
DCF, compris<strong>in</strong>g<br />
Neutral (V)<br />
Risk-free rate (%) 3.00 EBIT growth 2011-21e CAGR (%) 8.4<br />
Equity premium (%) 4.50 EBIT growth 2021-41e CAGR (%) 3.2<br />
Sector beta 1.20 Fade period 2041-47e<br />
Specific beta 1.00 WACC (%) 8.40<br />
Sensitivity <strong>and</strong> valuation range (GBP/share)<br />
Cost <strong>of</strong> capital vs fade period 4 years 8 years 12 years<br />
7.4% 16.77 17.21 17.54<br />
7.9% 15.67 16.04 16.35<br />
8.4% 14.69 15.00 15.29<br />
8.9% 13.81 14.08 14.33<br />
9.4% 13.02 13.24 13.47<br />
Valuation data<br />
Year to 03/2012a 03/2013e 03/2014e 03/2015e<br />
EV/sales 3.0 2.6 2.2 1.9<br />
EV/EBITDA 12.2 10.2 8.8 7.6<br />
EV/IC 13.0 10.3 8.5 7.2<br />
PE* 22.1 18.8 16.4 14.5<br />
P/Book value 6.8 5.5 4.5 3.7<br />
FCF yield (%) 3.1 3.7 4.7 5.7<br />
Dividend yield (%) 1.8 2.1 2.4 2.8<br />
Note: * = Based on HSBC EPS (fully diluted)<br />
Issuer <strong>in</strong>formation<br />
Share price (GBPp)1,360 Target price (GBPp)1,500<br />
Reuters (Equity) BRBY.L Bloomberg (Equity) BRBY LN<br />
Market cap (USDm) 9,487 Market cap (GBPm) 6,004<br />
Free float (%) 100 Enterprise value (GBPm) 5435<br />
Country United K<strong>in</strong>gdom Sector Textiles, Apparel & <strong>Luxury</strong><br />
Goods<br />
Analysts Sophie Dargnies Contact 331 5652 4348<br />
Anto<strong>in</strong>e Belge Contact 331 5652 4347<br />
Erwan Rambourg Contact 852 2996 6572<br />
Price relative<br />
1633<br />
1533<br />
1433<br />
1333<br />
1233<br />
1133<br />
1033<br />
933<br />
833<br />
733<br />
Source: HSBC<br />
Aug-10 Feb-11 Aug-11 Feb-12 Aug-12<br />
Burberry Group Rel to FTSE ALL-SHARE<br />
Note: price at close <strong>of</strong> 27 Aug 2012<br />
1633<br />
1533<br />
1433<br />
1333<br />
1233<br />
1133<br />
1033<br />
933<br />
833<br />
733<br />
37
Consumer Br<strong>and</strong>s & Retail<br />
Global luxury goods<br />
September 2012<br />
abc<br />
Christian Dior<br />
A cheaper way to access LVMH’s robust fundamentals<br />
Increas<strong>in</strong>g target price to EUR140 from EUR139 on higher<br />
assumptions for the Dior Couture bus<strong>in</strong>ess<br />
We reiterate Overweight with TP <strong>of</strong> EUR140 (from EUR139); if<br />
liquidity is not a major issue for <strong>in</strong>vest<strong>in</strong>g, we favour Dior over<br />
LVMH (downgraded to Neutral with a TP <strong>of</strong> EUR145)<br />
Reiterate OW on Dior <strong>in</strong> spite<br />
<strong>of</strong> our downgrade to Neutral for<br />
LVMH<br />
28% discount to RNAV<br />
Christian Dior is the ma<strong>in</strong> hold<strong>in</strong>g company for<br />
LVMH, controll<strong>in</strong>g 40.9% <strong>of</strong> the shares <strong>and</strong> c57%<br />
<strong>of</strong> the vot<strong>in</strong>g rights. Besides its stake <strong>in</strong> LVMH<br />
(contribut<strong>in</strong>g 90% <strong>of</strong> RNAV), Dior’s only<br />
operational entity is the Dior Couture br<strong>and</strong> (8% <strong>of</strong><br />
RNAV). Christian Dior’s hold<strong>in</strong>g <strong>in</strong> LVMH has<br />
changed slightly s<strong>in</strong>ce the dilution from the Bulgari<br />
deal <strong>in</strong> 2011. Christian Dior now holds a 40.9%<br />
stake (vs 42.4% before the deal) <strong>and</strong> c57% <strong>of</strong> vot<strong>in</strong>g<br />
rights (c58% previously).<br />
S<strong>in</strong>ce the beg<strong>in</strong>n<strong>in</strong>g <strong>of</strong> 2012, Dior shares have ga<strong>in</strong>ed<br />
28% vs 22% for LVMH shares. Dior’s discount to<br />
our estimated restated net asset value (RNAV) is now<br />
28% (vs 30% on 2 January 2012). There is noth<strong>in</strong>g<br />
surpris<strong>in</strong>g here as conglomerate/hold<strong>in</strong>g discount to<br />
RNAV tends to fall dur<strong>in</strong>g bull market phases <strong>and</strong><br />
vice versa. As evidenced by the chart on the next<br />
page, the discount to RNAV has moved with<strong>in</strong> a 6%-<br />
34% range (average 20%) s<strong>in</strong>ce 2005. Note that<br />
higher levels <strong>of</strong> discounts were witnessed <strong>in</strong> the<br />
1995-2005 period, but we would discard them from<br />
the analysis s<strong>in</strong>ce the LVMH control structure was<br />
much more complicated <strong>and</strong> the <strong>French</strong> tax regime<br />
back then (taxation on capital ga<strong>in</strong>s) implied a higher<br />
discount for most <strong>French</strong> conglomerates.<br />
We downgrade LVMH to Neutral (from Overweight)<br />
but ma<strong>in</strong>ta<strong>in</strong> our target price <strong>of</strong> EUR145 – see our<br />
detailed LVMH <strong>in</strong>vestment case on page 66. We<br />
value Dior on sum-<strong>of</strong>-the-parts, based on LVMH’s<br />
target price <strong>of</strong> EUR145 <strong>and</strong> a targeted discount to<br />
RNAV <strong>of</strong> 20% for Dior (the average s<strong>in</strong>ce 2005). We<br />
<strong>in</strong>crease our Dior target price to EUR140 (vs<br />
EUR139 previously) on the back <strong>of</strong> higher<br />
assumptions for the Dior Couture bus<strong>in</strong>ess follow<strong>in</strong>g<br />
a strong H1 2012 – see our detailed assumptions on<br />
page 41.<br />
Under our research model, for stocks without a<br />
volatility <strong>in</strong>dicator, the Neutral b<strong>and</strong> is 5 percentage<br />
po<strong>in</strong>ts above <strong>and</strong> below the hurdle rate for Europe<br />
ex-UK stocks <strong>of</strong> 9%. Our target price <strong>of</strong> EUR140<br />
implies a potential return <strong>of</strong> 19.7%, above the Neutral<br />
b<strong>and</strong> <strong>of</strong> our model; therefore, we reiterate our<br />
Overweight rat<strong>in</strong>g on Christian Dior. Potential return<br />
equals the percentage difference between the current<br />
share price <strong>and</strong> the target price, <strong>in</strong>clud<strong>in</strong>g the forecast<br />
dividend yield when <strong>in</strong>dicated.<br />
38
Consumer Br<strong>and</strong>s & Retail<br />
Global luxury goods<br />
September 2012<br />
abc<br />
Strong performance for Dior Couture<br />
Dior Couture registe<strong>red</strong> stellar growth (organic sales<br />
growth +22% <strong>in</strong> H1 2012) with retail (c85% <strong>of</strong><br />
sales) up 30%. Wholesale cont<strong>in</strong>ued to<br />
underperform but Dior’s target is to <strong>red</strong>uce its<br />
wholesale footpr<strong>in</strong>t (represent<strong>in</strong>g 12% <strong>of</strong> sales <strong>in</strong><br />
2011 compa<strong>red</strong> to 19% <strong>in</strong> 2009).<br />
H1 2012 EBIT marg<strong>in</strong> strongly improved <strong>and</strong><br />
ga<strong>in</strong>ed 500bp to 8.6% thanks to: (i) a higher<br />
operat<strong>in</strong>g leverage; (ii) a better mix; <strong>and</strong> (iii) a<br />
higher share <strong>of</strong> products be<strong>in</strong>g sold at full price.<br />
Dior Couture's own stores sales by region, 2011<br />
Europe <strong>and</strong><br />
Middle East<br />
47%<br />
Asia<br />
44% Americas<br />
9%<br />
Source: Company data<br />
For 2012, we forecast 16% organic sales growth<br />
<strong>and</strong> a 250bp EBIT marg<strong>in</strong> improvement to 11%<br />
on the back <strong>of</strong> a higher proportion <strong>of</strong> its own<br />
stores sales, higher gross marg<strong>in</strong> <strong>and</strong> better<br />
SG&A leverage (<strong>in</strong>clud<strong>in</strong>g improved store<br />
productivity). For 2013e <strong>and</strong> 2014e, we forecast<br />
11% <strong>and</strong> 9% organic sales growth, respectively,<br />
<strong>and</strong> a 150bp EBIT marg<strong>in</strong> improvement to 12.5%<br />
<strong>in</strong> 2013e <strong>and</strong> a 100bp improvement to 13.5%<br />
<strong>in</strong> 2014e.<br />
We consider the value <strong>of</strong> the Dior Couture br<strong>and</strong><br />
to be a limited driver, as it is too marg<strong>in</strong>al (only<br />
8% <strong>of</strong> Dior’s current RNAV) relative to Dior’s<br />
40.9% stake <strong>in</strong> LVMH (90% <strong>of</strong> RNAV).<br />
Risks<br />
The ma<strong>in</strong> downside/(upside) risks to our rat<strong>in</strong>g on<br />
Dior would be a negative/(positive) development<br />
<strong>in</strong> LVMH’s share price. Another risk would be a<br />
change <strong>in</strong> the market’s view <strong>of</strong> the discount to<br />
apply to hold<strong>in</strong>g companies (positive or negative).<br />
S<strong>in</strong>ce Dior’s IPO <strong>in</strong> 1995, there has been press<br />
speculation about a potential streaml<strong>in</strong><strong>in</strong>g <strong>of</strong> the<br />
current LVMH control structure. In theory, any<br />
expectations or announcements about such a<br />
simplification (eg. an LVMH/Dior merger or a<br />
Dior m<strong>in</strong>ority buy-out) – provided it benefited<br />
Dior’s m<strong>in</strong>ority shareholders – could trigger a<br />
sharp narrow<strong>in</strong>g <strong>in</strong> the company’s discount to<br />
RNAV. We th<strong>in</strong>k this could be a potential upside<br />
catalyst for Dior.<br />
Dior discount to our estimated net asset value<br />
0%<br />
Jan-98 Jan-99 Jan-00 Jan-01 Jan-02 Jan-03 Jan-04 Jan-05 Jan-06 Jan-07 Jan-08 Jan-09 Jan-10 Jan-11 Jan-12<br />
-10%<br />
-20%<br />
-30%<br />
-40%<br />
-50%<br />
-60%<br />
Source: Thomson Reuters Datastream, us<strong>in</strong>g share price close at 27 August 2012<br />
39
Consumer Br<strong>and</strong>s & Retail<br />
Global luxury goods<br />
September 2012<br />
abc<br />
Dior Couture sales & EBIT evolution<br />
EURm<br />
1993a 1994a 1995a 1996a 1997a 1998a 1999a 2000a 2001a 2002a 2003a 2004a 2005a 2006a 2007a 2008a 2009a 2010a 2011a 2012e 2013e 2014e<br />
Sales 124 137 157 187 200 200 220 296 350 492 523 595 663 731 787 765 717 826 1,000 1,233 1,394 1,521<br />
EBIT 19 22 24 24 11 -1 9 14 -5 33 40 50 53 56 74 9 13 35 85 136 174 205<br />
EBIT marg<strong>in</strong> 15.3 16.1 15.1 13.1 5.6 -0.3 3.9 4.7 -1.5 6.7 7.7 8.4 8.0 7.7 9.4 1.2 1.8 4.2 8.5 11.0 12.5 13.5<br />
y-o-y change (%)<br />
Sales 10 15 19 7 0 10 35 18 41 6 14 11 10 8 -3 -6 15 21 23 13 9<br />
EBIT 16 8 3 -54 nm nm 64 nm nm 21 25 6 6 32 -88 44 nm 143 60 28 18<br />
Source: Company data, HSBC estimates<br />
Dior restated net asset value<br />
EURm % stake Restated NAV Method % <strong>of</strong> RNAV<br />
LVMH 40.89% 27,744 Share price EUR133.5 90.5%<br />
Dior Couture 100.00% 2,467 2x 2012e sales 8.0%<br />
Property 100.00% 108 90,000m2 at EUR12,000/m2 0.4%<br />
Treasury stocks 1.43% 328 Share price EUR117.0 1.1%<br />
Restated NAV 30,647 100%<br />
Parent company debt -1,168<br />
RNAV (EURm) 29,479<br />
RNAV per share (EUR) 162.22<br />
Share price (EUR) 117.00<br />
Discount (%) -28%<br />
Source: HSBC estimates<br />
Dior target price calculation based on HSBC's LVMH target price<br />
EURm % stake Restated NAV Method % <strong>of</strong> RNAV<br />
LVMH 40.89% 30,134 HSBC target price EUR145 91%<br />
Dior Couture 100.00% 2,467 2x 2012e sales 7%<br />
Property 100.00% 108 90,000m2 at EUR12,000/m2 0%<br />
Treasury stocks 1.43% 328 Share price 1%<br />
Restated NAV 33,037 100%<br />
Parent co.debt -1,168<br />
RNAV (EURm) 31,869<br />
Targeted discount to RNAV (%) -20%<br />
HSBC Dior target price (EUR per share) 140<br />
Source: HSBC estimates<br />
40
1<br />
9<br />
.<br />
7<br />
Consumer Br<strong>and</strong>s & Retail<br />
Global luxury goods<br />
September 2012<br />
abc<br />
F<strong>in</strong>ancials & valuation: Christian Dior<br />
F<strong>in</strong>ancial statements<br />
Year to 12/2011a 12/2012e 12/2013e 12/2014e<br />
Pr<strong>of</strong>it & loss summary (EURm)<br />
Revenue 24,659 29,604 32,604 35,181<br />
EBITDA 6,270 7,196 8,165 8,952<br />
Depreciation & amortisation -922 -815 -864 -916<br />
Operat<strong>in</strong>g pr<strong>of</strong>it/EBIT 5,348 6,381 7,301 8,037<br />
Net <strong>in</strong>terest -283 -105 -125 -34<br />
PBT 4,962 6,162 7,086 7,915<br />
HSBC PBT 4,962 6,162 7,086 7,915<br />
Taxation -1,466 -1,816 -2,192 -2,448<br />
Net pr<strong>of</strong>it 1,356 1,710 1,931 2,167<br />
HSBC net pr<strong>of</strong>it 1,356 1,710 1,931 2,167<br />
Cash flow summary (EURm)<br />
Cash flow from operations 3,987 4,374 5,304 6,002<br />
Capex -1,749 -1,400 -1,500 -1,600<br />
Cash flow from <strong>in</strong>vestment -6,309 -1,400 -1,500 -1,600<br />
Dividends -448 -560 -644 -740<br />
Change <strong>in</strong> net debt 1,988 -1,273 -1,935 -2,360<br />
FCF equity 2,238 2,974 3,804 4,402<br />
Balance sheet summary (EURm)<br />
Intangible fixed assets 21,740 21,740 21,740 21,740<br />
Tangible fixed assets 8,344 8,927 9,560 10,242<br />
Current assets 13,626 15,785 17,087 18,209<br />
Cash & others 2,426 2,426 2,426 2,426<br />
Total assets 51,109 54,048 56,182 58,187<br />
Operat<strong>in</strong>g liabilities 6,648 7,906 8,665 9,320<br />
Gross debt 8,852 7,579 5,644 3,284<br />
Net debt 6,426 5,153 3,218 858<br />
Shareholders funds 12,956 15,427 18,178 21,269<br />
Invested capital 34,636 36,119 37,296 38,445<br />
Ratio, growth <strong>and</strong> per share analysis<br />
Year to 12/2011a 12/2012e 12/2013e 12/2014e<br />
Y-o-y % change<br />
Revenue 16.7 20.1 10.1 7.9<br />
EBITDA 21.2 14.8 13.5 9.6<br />
Operat<strong>in</strong>g pr<strong>of</strong>it 23.3 19.3 14.4 10.1<br />
PBT 4.6 24.2 15.0 11.7<br />
HSBC EPS 7.5 26.1 12.9 12.2<br />
Ratios (%)<br />
Revenue/IC (x) 0.8 0.8 0.9 0.9<br />
ROIC 12.0 12.7 13.7 14.7<br />
ROE 13.1 12.1 11.5 11.0<br />
ROA 8.0 8.4 9.0 9.6<br />
EBITDA marg<strong>in</strong> 25.4 24.3 25.0 25.4<br />
Operat<strong>in</strong>g pr<strong>of</strong>it marg<strong>in</strong> 21.7 21.6 22.4 22.8<br />
EBITDA/net <strong>in</strong>terest (x) 22.2 68.8 65.1 261.9<br />
Net debt/equity 25.8 18.5 10.3 2.5<br />
Net debt/EBITDA (x) 1.0 0.7 0.4 0.1<br />
CF from operations/net debt 62.0 84.9 164.8 699.2<br />
Per share data (EUR)<br />
EPS Rep (fully diluted) 7.60 9.58 10.82 12.14<br />
HSBC EPS (fully diluted) 7.60 9.58 10.82 12.14<br />
DPS 2.61 3.26 3.75 4.31<br />
Book value 72.57 86.41 101.82 119.14<br />
Dior restated net asset value (target price)<br />
EURm<br />
Overweight<br />
RNAV<br />
LVMH (40.89% stake) @ EUR145 per share 30,134<br />
Dior Couture (2x 2012e sales) 2,467<br />
Property (90,000m2 at EUR12,000/m2) 108<br />
Treasury stocks 328<br />
Restated NAV 33,037<br />
Parent company debt -1,168<br />
RNAV (EURm) 31,869<br />
Target discount (%) -20%<br />
Target price Dior (EUR per share) 140<br />
Valuation data<br />
Year to 12/2011a 12/2012e 12/2013e 12/2014e<br />
EV/sales 2.3 1.9 1.7 1.5<br />
EV/EBITDA 9.2 7.8 6.6 5.8<br />
EV/IC 1.7 1.6 1.5 1.3<br />
PE* 15.4 12.2 10.8 9.6<br />
P/Book value 1.6 1.4 1.1 1.0<br />
FCF yield (%) 4.3 5.8 7.4 8.7<br />
Dividend yield (%) 2.2 2.8 3.2 3.7<br />
Note: * = Based on HSBC EPS (fully diluted)<br />
Issuer <strong>in</strong>formation<br />
Share price (EUR)117.00 Target price (EUR)140.00<br />
Reuters (Equity) DIOR.PA Bloomberg (Equity) CDI FP<br />
Market cap (USDm) 26,611 Market cap (EURm) 21,262<br />
Free float (%) 29 Enterprise value (EURm) 56428<br />
Country France Sector Textiles, Apparel & <strong>Luxury</strong><br />
Goods<br />
Analysts Sophie Dargnies Contact 331 5652 4348<br />
Anto<strong>in</strong>e Belge Contact 331 5652 4347<br />
Erwan Rambourg Contact 852 2996 6572<br />
Price relative<br />
124<br />
114<br />
104<br />
94<br />
84<br />
74<br />
74<br />
Aug-10 Feb-11 Aug-11 Feb-12 Aug-12<br />
Christian Dior Rel to SBF-120<br />
Source: HSBC<br />
Note: price at close <strong>of</strong> 27 Aug 2012<br />
124<br />
114<br />
104<br />
94<br />
84<br />
41
Consumer Br<strong>and</strong>s & Retail<br />
Global luxury goods<br />
September 2012<br />
abc<br />
Coach<br />
Most <strong>of</strong> the Q4 damage was self-<strong>in</strong>flicted, <strong>in</strong> our view<br />
Valuation (10% discount to European peers <strong>and</strong> 6% discount to<br />
Tiffany) discounts a dramatic change <strong>in</strong> the bus<strong>in</strong>ess model which<br />
we do not foresee<br />
Rema<strong>in</strong> Overweight (add<strong>in</strong>g V-flag) but lower target price to USD79<br />
(from USD88) on <strong>red</strong>uced estimates<br />
The bus<strong>in</strong>ess model is not<br />
broken<br />
Q4 publication (31 July) a ‘shocker’<br />
On 31 July, when Coach reported Q4 results, its<br />
shares closed down 20% to USD49.33 after hav<strong>in</strong>g<br />
already lost 22% s<strong>in</strong>ce their 27 March peak <strong>of</strong><br />
USD79.46. This was the worst daily share price<br />
decl<strong>in</strong>e s<strong>in</strong>ce 11 September 2001. Even if the shares<br />
have recove<strong>red</strong> a bit s<strong>in</strong>ce then (+13% <strong>in</strong> August to<br />
date), we believe Coach’s share price is pric<strong>in</strong>g <strong>in</strong> a<br />
significant change <strong>in</strong> the company's bus<strong>in</strong>ess model<br />
which we do not foresee.<br />
Before analys<strong>in</strong>g what caused this sell-<strong>of</strong>f, it is worth<br />
not<strong>in</strong>g that Q4 EPS (USD0.86) rose 27% <strong>and</strong><br />
actually beat consensus estimates (USD0.85). But<br />
we believe <strong>in</strong>vestors focused on the slowdown <strong>in</strong><br />
North America (NA) same store sales growth<br />
(SSSG) from 6.7% <strong>in</strong> Q3 to 1.7% <strong>in</strong> Q4 <strong>and</strong> did not<br />
c<strong>red</strong>it the company for the follow<strong>in</strong>g positive<br />
elements:<br />
The 16% sales <strong>in</strong>crease (<strong>in</strong> yen) <strong>in</strong> Japan (with<br />
18% <strong>of</strong> sales from Japan <strong>in</strong> FY11/12, Coach<br />
rema<strong>in</strong>s one <strong>of</strong> companies most exposed to<br />
Japan <strong>in</strong> our coverage universe).<br />
The above-60% sales growth <strong>in</strong> Greater Ch<strong>in</strong>a<br />
(with double-digit SSSG).<br />
The 180bp <strong>in</strong>crease <strong>in</strong> ‘clean’ EBIT marg<strong>in</strong>.<br />
Most <strong>of</strong> the damage was self-<strong>in</strong>flicted, <strong>in</strong> our<br />
view, <strong>and</strong> as such should be temporary<br />
Even if Coach said that sales trends <strong>in</strong> its NA fullprice<br />
stores (c40% <strong>of</strong> total NA retail sales accord<strong>in</strong>g<br />
to our estimates) did not slow sequentially from Q3<br />
to Q4, we doubt that the US affluent consumer was<br />
as buoyant <strong>in</strong> Q4 as <strong>in</strong> the previous quarters. In<br />
addition, Coach, which for many years had been<br />
operat<strong>in</strong>g on a sweet spot (ie. <strong>in</strong> the USD200-400<br />
h<strong>and</strong>bag segment where it faced limited<br />
competition), has seen the emergence <strong>of</strong> Michael<br />
Kors (which now holds a c8% market share <strong>of</strong> the<br />
US h<strong>and</strong>bag <strong>and</strong> accessories market).<br />
Hav<strong>in</strong>g said that, we believe most <strong>of</strong> the Q4 damage<br />
was self-<strong>in</strong>flicted. In Q3 end<strong>in</strong>g March-12, Coach<br />
took the decision to elim<strong>in</strong>ate <strong>in</strong>-store coupon<strong>in</strong>g <strong>in</strong><br />
its factory outlet stores, only to re-<strong>in</strong>state it <strong>in</strong> a cross<br />
section <strong>of</strong> stores <strong>in</strong> June <strong>and</strong> <strong>in</strong> the whole factory<br />
store network by 4 June, the big holiday outlet<br />
shopp<strong>in</strong>g weekend.<br />
42
Consumer Br<strong>and</strong>s & Retail<br />
Global luxury goods<br />
September 2012<br />
abc<br />
European luxury br<strong>and</strong>s – which operate mostly <strong>in</strong><br />
the USD1,000 <strong>and</strong> above price segment – def<strong>in</strong>itely<br />
have pric<strong>in</strong>g power, <strong>and</strong> even Coach <strong>in</strong> its full-price<br />
channel can afford a no-discount policy (its average<br />
consumer is a 20-30 year old s<strong>in</strong>gle woman driven by<br />
‘newness’. But Coach’s average factory outlet store<br />
consumer is a 40-year old mother driven by ‘value<br />
for money’). We believe Coach overestimated its<br />
pric<strong>in</strong>g power <strong>in</strong> the US (especially <strong>in</strong> the current<br />
environment.<br />
Even if the factory outlet store consumer may be<br />
confused for one or two quarters, we are confident<br />
that Coach will f<strong>in</strong>d smarter ways to restore the<br />
br<strong>and</strong>’s appeal <strong>in</strong> that channel through market<strong>in</strong>g <strong>and</strong><br />
merch<strong>and</strong>is<strong>in</strong>g <strong>in</strong>itiatives.<br />
Significant growth drivers still <strong>in</strong> place<br />
The growth drivers which are specific to Coach are<br />
still <strong>in</strong> place <strong>in</strong> our view:<br />
The men’s opportunity, which <strong>in</strong> our view <strong>of</strong>fsets<br />
the traditional bear issue regard<strong>in</strong>g Coach’s maturity<br />
<strong>in</strong> North America (Coach already has 354 full-price<br />
<strong>and</strong> 169 factory stores there), with the prospect <strong>of</strong><br />
open<strong>in</strong>g stores dedicated to men, shop-<strong>in</strong>-shops <strong>and</strong><br />
dual-gender locations, <strong>and</strong> allows productivity ga<strong>in</strong>s<br />
<strong>in</strong> exist<strong>in</strong>g stores via exp<strong>and</strong>ed assortments (concept<br />
store with<strong>in</strong> exist<strong>in</strong>g stores). The company <strong>in</strong>tends to<br />
<strong>in</strong>crease its North American square footage by at<br />
least 10% <strong>in</strong> FY13, driven by men’s opportunity.<br />
The Asia opportunity: the br<strong>and</strong>’s “New York”<br />
position<strong>in</strong>g is unique <strong>in</strong> Ch<strong>in</strong>a, <strong>and</strong> the br<strong>and</strong> plans to<br />
add c35% space <strong>in</strong> FY13. Short-term, the entry-level<br />
position<strong>in</strong>g <strong>of</strong> Coach makes it less vulnerable than<br />
the European luxury br<strong>and</strong>s to the slowdown <strong>in</strong><br />
corporate gift giv<strong>in</strong>g. In addition, even if the buyback<br />
<strong>of</strong> key Asian bus<strong>in</strong>esses will have a negative impact<br />
on EBIT marg<strong>in</strong> <strong>in</strong>itially, we expect it to have a<br />
positive payback <strong>in</strong> the next three years.<br />
Earn<strong>in</strong>gs, valuation <strong>and</strong> risks<br />
The company’s FY13 guidance is call<strong>in</strong>g for doubledigit<br />
sales growth (<strong>in</strong>clud<strong>in</strong>g low-to-mid s<strong>in</strong>gle digit<br />
SSSG <strong>in</strong> NA) <strong>and</strong> a modest gross marg<strong>in</strong> ga<strong>in</strong> be<strong>in</strong>g<br />
more than <strong>of</strong>fset by negative SG&A leverage com<strong>in</strong>g<br />
from the <strong>in</strong>tegration <strong>of</strong> <strong>in</strong>ternational acquisitions<br />
(result<strong>in</strong>g <strong>in</strong> a compression <strong>in</strong> EBIT marg<strong>in</strong> to c31%<br />
from the ‘clean’ FY12 level <strong>of</strong> 32.1%). We have cut<br />
our FY2013e <strong>and</strong> 2014e EPS estimates by 12% <strong>and</strong><br />
13%, respectively; on the back <strong>of</strong> lower North<br />
American SSSG (we now forecast 2% <strong>in</strong> FY13e <strong>and</strong><br />
5% <strong>in</strong> FY13e).<br />
We lower our DCF-based target price to USD79 (from<br />
USD88) on the back <strong>of</strong> our above-mentioned earn<strong>in</strong>gs<br />
estimate downward revision. The assumptions used to<br />
generate our DCF-derived target price are detailed on<br />
page 45. Under our research model, for US stocks with<br />
a volatility <strong>in</strong>dicator, the Neutral b<strong>and</strong> is 10 percentage<br />
po<strong>in</strong>ts above <strong>and</strong> below the hurdle rate for US stocks<br />
<strong>of</strong> 7.0%. Our new target price implies a 41.3%<br />
potential return, which is above the Neutral b<strong>and</strong>;<br />
therefore we reiterate our Overweight (V) rat<strong>in</strong>g. We<br />
add the volatility flag <strong>in</strong> recognition <strong>of</strong> the stock’s<br />
historical volatility hav<strong>in</strong>g <strong>in</strong>creased. Potential return<br />
equals the percentage difference between the current<br />
share price <strong>and</strong> the target price, <strong>in</strong>clud<strong>in</strong>g the forecast<br />
dividend yield when <strong>in</strong>dicated.<br />
On our updated figures, the stock is trad<strong>in</strong>g at a 15.3x<br />
calendar 2012e <strong>and</strong> 13.7x 2013e PE, a 10% discount<br />
to European luxury stocks, <strong>and</strong> a 6% discount to<br />
Tiffany. Downside risks <strong>in</strong> the long term <strong>in</strong>clude the<br />
br<strong>and</strong>’s different position<strong>in</strong>g <strong>in</strong> its two channels (fullprice<br />
retail <strong>and</strong> factory outlets), which could pose a<br />
threat to its image, <strong>and</strong> a lack <strong>of</strong> success <strong>in</strong> enter<strong>in</strong>g the<br />
European market. In the short term, US consumer<br />
confidence may weaken <strong>and</strong> impact traffic/conversion.<br />
International distribution (% <strong>of</strong> FY June 12 sales)<br />
North<br />
American<br />
Stores<br />
62%<br />
Source: Company data<br />
Japan<br />
18%<br />
Ch<strong>in</strong>a<br />
6%<br />
Other Intl<br />
4%<br />
NA Internet<br />
4%<br />
US<br />
Department<br />
stores<br />
6%<br />
43
Consumer Br<strong>and</strong>s & Retail<br />
Global luxury goods<br />
September 2012<br />
abc<br />
Coach simplified P&L<br />
USDm FY07/08e FY08/09 FY09/10a 1Q11a 2Q11a 3Q11a 4Q11a FY10/11a 1Q12a 2Q12a 3Q12a 4Q12e FY11/12a FY12/13e FY13/14e FY14/15e<br />
Net sales 3,181 3,230 3,608 912 1,264 951 1,032 4,159 1,050 1,449 1,109 1,155 4,763 5,215 5,829 6,560<br />
Cost <strong>of</strong> sales 774 908 974 236 349 259 291 1,135 286 403 291 317 1,297 1,398 1,539 1,706<br />
Gross Pr<strong>of</strong>it 2,407 2,323 2,634 676 915 692 740 3,024 765 1,045 818 838 3,466 3,818 4,290 4,854<br />
Gross marg<strong>in</strong> 75.7% 71.9% 73.0% 74.2% 72.4% 72.8% 71.8% 72.7% 72.8% 72.2% 73.8% 72.6% 72.8% 73.2% 73.6% 74.0%<br />
Sell<strong>in</strong>g, G&A 1,228 1,322 1,484 391 462 438 428 1,719 443 544 481 487 1,954 2,184 2,425 2,691<br />
SG&A as % <strong>of</strong> sales 38.6% 40.9% 41.1% 42.8% 36.5% 46.1% 41.5% 41.3% 42.1% 37.6% 43.3% 42.1% 41.0% 41.9% 41.6% 41.0%<br />
Operat<strong>in</strong>g Income 1,179 1,000 1,150 286 453 254 312 1,305 322 501 337 352 1,512 1,633 1,865 2,163<br />
Operat<strong>in</strong>g marg<strong>in</strong> 37.1% 31.0% 31.9% 31.3% 35.9% 26.7% 30.2% 31.4% 30.7% 34.6% 30.4% 30.4% 31.7% 31.3% 32.0% 33.0%<br />
Interest <strong>in</strong>come 37.1 3.2 1.8 -0.6 -0.9 -0.8 -1.4 -3.7 -1.4 -1.8 -1.7 -1.5 -6.3 15.0 35.0 50.0<br />
PBT 1,216 1,003 1,152 285 452 253 311 1,301 321 499 336 350 1,506 1,648 1,900 2,213<br />
Income taxes 474 381 417 96 149 67 108 420 106 152 111 99 467 544 627 730<br />
Tax rate 39.0% 38.0% 36.2% 33.7% 32.9% 26.5% 34.8% 32.3% 32.9% 30.4% 33.0% 28.2% 31.0% 33.0% 33.0% 33.0%<br />
M<strong>in</strong>ority <strong>in</strong>terest<br />
Net <strong>in</strong>come 742 622 735 189 303 186 202 881 215 347 225 251 1,039 1,104 1,273 1,483<br />
Net EPS common<br />
(Diluted)<br />
Weighted avg com share<br />
outst. (D)<br />
2.06 1.91 2.33 0.63 1.00 0.62 0.68 2.92 0.73 1.18 0.77 0.86 3.53 3.78 4.36 5.08<br />
360.3 325.6 315.8 301.3 304.7 301.6 298.7 301.6 296.1 295.5 293.5 291.8 294.1 291.8 291.8 291.8<br />
Net sales 22% 2% 12% 20% 19% 14% 9% 15% 15% 15% 17% 12% 15% 9% 12% 13%<br />
Cost <strong>of</strong> sales 31% 17% 7% 11% 19% 20% 15% 17% 21% 15% 12% 9% 14% 8% 10% 11%<br />
Gross pr<strong>of</strong>it 19% -4% 13% 23% 19% 12% 6% 15% 13% 14% 18% 13% 15% 10% 12% 13%<br />
Operat<strong>in</strong>g expenses 19% 8% 12% 19% 18% 19% 7% 16% 13% 18% 10% 14% 14% 12% 11% 11%<br />
Income before tax & 19% -15% 15% 28% 19% 2% 5% 13% 13% 10% 33% 13% 16% 8% 14% 16%<br />
m<strong>in</strong>ority <strong>in</strong>terest<br />
Diluted EPS 22% -7% 22% 43% 33% 23% 9% 25% 16% 18% 24% 27% 21% 7% 15% 16%<br />
North America retail<br />
comps<br />
10% -7% 4% 9% 13% 10% 10% 11% 9% 9% 7% 2% 7% 2% 5% 5%<br />
Direct-to-consumer 2,544 2,727 3,156 776 1,096 832 919 3,622 910 1,283 984 1,047 4,232 4,684 5,298 6,029<br />
Indirect 637 504 452 136 168 119 113 537 140 166 125 108 531 531 531 531<br />
Total sales 3,181 3,231 3,608 912 1,264 951 1,032 4,159 1,050 1,449 1,109 1,155 4,763 5,215 5,829 6,560<br />
Source: Company data, HSBC estimates<br />
44
4<br />
1<br />
.<br />
3<br />
Consumer Br<strong>and</strong>s & Retail<br />
Global luxury goods<br />
September 2012<br />
abc<br />
F<strong>in</strong>ancials & valuation: Coach<br />
F<strong>in</strong>ancial statements<br />
Year to 06/2012a 06/2013e 06/2014e 06/2015e<br />
Pr<strong>of</strong>it & loss summary (USDm)<br />
Revenue 4,763 5,215 5,829 6,560<br />
EBITDA 1,650 1,787 2,035 2,349<br />
Depreciation & amortisation -138 -154 -170 -186<br />
Operat<strong>in</strong>g pr<strong>of</strong>it/EBIT 1,512 1,633 1,865 2,163<br />
Net <strong>in</strong>terest -6 15 35 50<br />
PBT 1,506 1,648 1,900 2,213<br />
HSBC PBT 1,506 1,648 1,900 2,213<br />
Taxation -467 -544 -627 -730<br />
Net pr<strong>of</strong>it 1,039 1,104 1,273 1,483<br />
HSBC net pr<strong>of</strong>it 1,039 1,104 1,273 1,483<br />
Cash flow summary (USDm)<br />
Cash flow from operations 1,262 1,291 1,480 1,700<br />
Capex -200 -224 -246 -271<br />
Cash flow from <strong>in</strong>vestment -200 -224 -246 -271<br />
Dividends -283 -392 -450 -518<br />
Change <strong>in</strong> net debt -216 -676 -783 -912<br />
FCF equity 966 972 1,138 1,334<br />
Balance sheet summary (USDm)<br />
Intangible fixed assets 445 445 445 445<br />
Tangible fixed assets 855 925 1,002 1,087<br />
Current assets 1,596 2,354 3,213 4,208<br />
Cash & others 917 1,593 2,376 3,288<br />
Total assets 3,104 3,932 4,868 5,947<br />
Operat<strong>in</strong>g liabilities 1,088 1,107 1,124 1,143<br />
Gross debt 23 23 23 23<br />
Net debt -894 -1,570 -2,353 -3,265<br />
Shareholders funds 1,993 2,802 3,720 4,781<br />
Invested capital 891 1,023 1,159 1,308<br />
Ratio, growth <strong>and</strong> per share analysis<br />
Year to 06/2012a 06/2013e 06/2014e 06/2015e<br />
Y-o-y % change<br />
Revenue 14.5 9.5 11.8 12.5<br />
EBITDA 15.4 8.4 13.9 15.4<br />
Operat<strong>in</strong>g pr<strong>of</strong>it 15.9 8.0 14.2 15.9<br />
PBT 15.7 9.5 15.3 16.4<br />
HSBC EPS 20.9 7.2 15.3 16.4<br />
Ratios (%)<br />
Revenue/IC (x) 5.8 5.4 5.3 5.3<br />
ROIC 127.2 114.3 114.5 117.5<br />
ROE 57.6 46.1 39.0 34.9<br />
ROA 36.2 31.4 28.9 27.4<br />
EBITDA marg<strong>in</strong> 34.6 34.3 34.9 35.8<br />
Operat<strong>in</strong>g pr<strong>of</strong>it marg<strong>in</strong> 31.7 31.3 32.0 33.0<br />
EBITDA/net <strong>in</strong>terest (x) 260.8<br />
Net debt/equity -44.9 -56.0 -63.2 -68.3<br />
Net debt/EBITDA (x) -0.5 -0.9 -1.2 -1.4<br />
CF from operations/net debt<br />
Per share data (USD)<br />
EPS Rep (fully diluted) 3.53 3.78 4.36 5.08<br />
HSBC EPS (fully diluted) 3.53 3.78 4.36 5.08<br />
DPS 1.20 1.38 1.59 1.83<br />
Book value 6.97 9.87 13.11 16.85<br />
DCF analysis<br />
HSBC assumptions<br />
DCF, compris<strong>in</strong>g<br />
Overweight (V)<br />
Risk-free rate (%) 3.00 EBIT growth 2011-21e CAGR (%) 7.5<br />
Equity premium (%) 4.50 EBIT growth 2021-41e CAGR (%) 3.1<br />
Sector beta 1.20 Fade period 2041-46e<br />
Specific beta 1.15 WACC (%) 8.52<br />
Sensitivity <strong>and</strong> valuation range (USD/share)<br />
Cost <strong>of</strong> capital vs fade period 4 years 8 years 12 years<br />
7.5% 87.5 89.8 91.6<br />
8.0% 82.2 84.1 85.7<br />
8.5% 77.4 79.0 80.4<br />
9.0% 73.0 74.4 75.6<br />
9.5% 69.0 70.2 71.3<br />
Valuation data<br />
Year to 06/2012a 06/2013e 06/2014e 06/2015e<br />
EV/sales 3.2 2.8 2.3 1.9<br />
EV/EBITDA 9.1 8.0 6.7 5.4<br />
EV/IC 16.9 14.0 11.7 9.7<br />
PE* 15.8 14.8 12.8 11.0<br />
P/Book value 8.0 5.7 4.3 3.3<br />
FCF yield (%) 6.1 6.1 7.1 8.4<br />
Dividend yield (%) 2.1 2.5 2.8 3.3<br />
Note: * = Based on HSBC EPS (fully diluted)<br />
Issuer <strong>in</strong>formation<br />
Share price (USD)55.92 Target price (USD)79.00<br />
Reuters (Equity) COH.N Bloomberg (Equity) COH US<br />
Market cap (USDm) 15,948 Market cap (USDm) 15,948<br />
Free float (%) 100 Enterprise value (USDm) 14378<br />
Country United States Sector Textiles, Apparel & <strong>Luxury</strong><br />
Goods<br />
Analyst Erwan Rambourg Contact 852 2996 6572<br />
Anto<strong>in</strong>e Belge Contact 331 5652 4347<br />
Sophie Dargnies Contact 331 5652 4348<br />
Price relative<br />
90<br />
80<br />
70<br />
60<br />
50<br />
40<br />
30<br />
30<br />
Aug-10 Feb-11 Aug-11 Feb-12 Aug-12<br />
Coach Rel to S&P 500<br />
Source: HSBC<br />
Note: price at close <strong>of</strong> 27 Aug 2012<br />
90<br />
80<br />
70<br />
60<br />
50<br />
40<br />
45
Consumer Br<strong>and</strong>s & Retail<br />
Global luxury goods<br />
September 2012<br />
abc<br />
Ferragamo<br />
The strongest earn<strong>in</strong>gs growth pr<strong>of</strong>ile <strong>in</strong> our universe after Prada,<br />
driven by improved execution<br />
Valuation (17.6x 2013e PE), a 16% premium to peers, is<br />
warranted by higher earn<strong>in</strong>gs growth prospects <strong>in</strong> 2014e <strong>and</strong><br />
beyond, <strong>in</strong> our view<br />
Reiterate Overweight (V); <strong>in</strong>crease TP to EUR21 from EUR18 on<br />
higher estimates<br />
Strongest earn<strong>in</strong>gs growth pr<strong>of</strong>ile after Prada<br />
The Ferragamo <strong>in</strong>vestment case is relatively<br />
simple: this is a story <strong>of</strong> improved execution for a<br />
medium-sized mono br<strong>and</strong> (EUR1bn <strong>in</strong> sales <strong>in</strong><br />
2011), which should <strong>in</strong> our view lead to the<br />
strongest earn<strong>in</strong>gs growth pr<strong>of</strong>ile <strong>in</strong> our universe<br />
after Prada (driven by a comb<strong>in</strong>ation <strong>of</strong> aboveaverage<br />
top-l<strong>in</strong>e <strong>and</strong> marg<strong>in</strong> expansion).<br />
Indeed, <strong>in</strong> spite <strong>of</strong> attractive products <strong>and</strong><br />
geographic <strong>and</strong> distribution mixes (<strong>in</strong> 2011, Asia<br />
<strong>and</strong> retail already accounted for 36% <strong>and</strong> 67% <strong>of</strong><br />
sales, respectively), Ferragamo's EBIT marg<strong>in</strong> lag<br />
those <strong>of</strong> 's<strong>of</strong>t' luxury peers (companies primarily<br />
<strong>in</strong>volved <strong>in</strong> leather goods, apparel <strong>and</strong> shoes).<br />
Even if Ferragamo’s EBIT marg<strong>in</strong> improved<br />
480bps <strong>in</strong> 2011 demonstrat<strong>in</strong>g the ongo<strong>in</strong>g<br />
changes at the company, this level <strong>of</strong> marg<strong>in</strong><br />
rema<strong>in</strong>ed well below peers (29% on average). We<br />
are confident that Ferragamo can narrow the gap<br />
with peers <strong>and</strong> register a 330bp EBIT marg<strong>in</strong><br />
enhancement over 2011-14e (vs c200bp for the<br />
luxury peers) to reach 19% <strong>in</strong> 2014e.<br />
Execution, execution, execution<br />
S<strong>in</strong>ce its 2011 list<strong>in</strong>g, Ferragamo has moved to a<br />
more aggressive/pragmatic management<br />
approach, lead<strong>in</strong>g to better execution.<br />
In terms <strong>of</strong> top-l<strong>in</strong>e growth, Ferragamo should<br />
benefit from the drivers common to the overall<br />
<strong>in</strong>dustry. The ma<strong>in</strong> specific growth opportunity<br />
lies <strong>in</strong> Western Europe ex-Italy, where the br<strong>and</strong><br />
awareness is high but the br<strong>and</strong> image is<br />
somewhat dusty (Ferragamo customers are on<br />
average much older <strong>in</strong> Western Europe than <strong>in</strong><br />
Asia ex-Japan <strong>and</strong> the Americas).<br />
Ferragamo’s issues <strong>of</strong> lower pr<strong>of</strong>itability by<br />
product l<strong>in</strong>e <strong>and</strong> lower pr<strong>of</strong>itability <strong>in</strong> its retail<br />
store network are l<strong>in</strong>ked. In the luxury <strong>in</strong>dustry,<br />
EBIT marg<strong>in</strong>s <strong>in</strong> retail are usually 15-20<br />
percentage po<strong>in</strong>ts higher than EBIT marg<strong>in</strong>s <strong>in</strong><br />
wholesale, but Ferragamo – which already<br />
generates 67% <strong>of</strong> its sales <strong>in</strong> retail – does not<br />
seem to benefit from that yet.<br />
In our view, the key way to improve store<br />
productivity will be to <strong>red</strong>uce the average level <strong>of</strong><br />
markdowns, which rema<strong>in</strong>s high compa<strong>red</strong> to<br />
46
Consumer Br<strong>and</strong>s & Retail<br />
Global luxury goods<br />
September 2012<br />
abc<br />
peers – even after two years <strong>of</strong> improvement <strong>in</strong><br />
2010 <strong>and</strong> 2011.<br />
We believe achiev<strong>in</strong>g a higher share <strong>of</strong> sales at<br />
full price will require:<br />
A higher share <strong>of</strong> permanent (‘evergreen’)<br />
products, notably <strong>in</strong> h<strong>and</strong>bags <strong>and</strong> shoes, or at<br />
least iconic styles that can be adapted from<br />
one season to another<br />
More high marg<strong>in</strong> entry-level products<br />
(notably more small leather goods)<br />
Increased cross-sell<strong>in</strong>g opportunities through<br />
greater coherence between collections guided<br />
by a s<strong>in</strong>gle design direction s<strong>in</strong>ce June 2010<br />
Increased product cont<strong>in</strong>uity <strong>and</strong> availability<br />
<strong>in</strong> stores via a stock replenishment<br />
programme aimed at automatically manag<strong>in</strong>g<br />
the procurement <strong>and</strong> distribution <strong>of</strong> products<br />
Better <strong>in</strong>-store merch<strong>and</strong>is<strong>in</strong>g<br />
Increas<strong>in</strong>g the average size <strong>of</strong> stores – which<br />
is well below that <strong>of</strong> peers – <strong>in</strong> order to better<br />
display the br<strong>and</strong>’s full range <strong>of</strong> products<br />
Some <strong>of</strong> these requirements will be implemented<br />
through the roll-out <strong>of</strong> the next phases <strong>of</strong> project<br />
‘Marl<strong>in</strong>” <strong>in</strong>itiated three years ago, which also<br />
aims to <strong>in</strong>crease supply-cha<strong>in</strong> efficiencies.<br />
Earn<strong>in</strong>gs, valuation <strong>and</strong> risks<br />
H1 organic sales growth was 18% <strong>in</strong> H1 with Q2<br />
(+17%) show<strong>in</strong>g a limited slowdown compa<strong>red</strong> to<br />
Q1 (+19%). H1 EBITDA rose 25%, imply<strong>in</strong>g a<br />
30bp EBITDA marg<strong>in</strong> improvement. The gross<br />
marg<strong>in</strong> was flat as lower markdowns <strong>and</strong> positive<br />
product mix (outperformance <strong>of</strong> leather goods)<br />
were <strong>of</strong>fset by negative FX hedg<strong>in</strong>g impacts <strong>and</strong><br />
negative distribution mix (outperformance <strong>of</strong><br />
wholesale). The communication-to-sales ratio rose<br />
140bp to 7% whilst the ratio <strong>of</strong> other SG&A<br />
decl<strong>in</strong>ed 170bp. Ferragamo characterises itself by<br />
a different account<strong>in</strong>g <strong>of</strong> hedg<strong>in</strong>g, which is<br />
booked at the sales level. As a consequence <strong>of</strong><br />
this, the group should benefit from the EUR<br />
weakness as from Q2 2013, i.e. with roughly a<br />
one year delay compa<strong>red</strong> to peers. Ferragamo’s<br />
long-term strategy is to develop retail more than<br />
wholesale. But s<strong>in</strong>ce 2011, the br<strong>and</strong> is enjoy<strong>in</strong>g<br />
stronger growth <strong>in</strong> wholesale due to stellar growth<br />
<strong>in</strong> EM markets <strong>and</strong> strong travel retail<br />
developments. Dur<strong>in</strong>g the Q2 conference call<br />
management stated it was comfortable with<br />
consensus expectations <strong>of</strong> a c100bp EBITDA<br />
marg<strong>in</strong> <strong>in</strong>crease over FY12.<br />
Our 2012-14 forecasts call for organic sales growth<br />
<strong>of</strong> 16%, 13% <strong>and</strong> 11%, respectively, <strong>and</strong> 330bp<br />
EBIT marg<strong>in</strong> ga<strong>in</strong>s over the period (with the EBIT<br />
marg<strong>in</strong> reach<strong>in</strong>g 19% <strong>in</strong> 2014e). The improvement<br />
<strong>in</strong> store pr<strong>of</strong>itability should, <strong>in</strong> our view, translate<br />
<strong>in</strong>to a 150bp gross marg<strong>in</strong> enhancement <strong>and</strong> 180bp<br />
SG&A leverage over the period. We have raised our<br />
2012-14 EBIT estimates by 4%, 11% <strong>and</strong> 13%,<br />
respectively, on the back <strong>of</strong> higher sales forecasts<br />
(mostly for Europe <strong>and</strong> the US) lead<strong>in</strong>g to stronger<br />
SG&A leverage.<br />
We <strong>in</strong>crease our DCF-based target price to EUR21<br />
from EUR18 on the back <strong>of</strong> the above-mentioned<br />
earn<strong>in</strong>gs upgrade. The assumptions used to generate<br />
our target price are detailed on page 49. Under our<br />
research model, for stocks with a volatility <strong>in</strong>dicator,<br />
the Neutral b<strong>and</strong> is 10 percentage po<strong>in</strong>ts above <strong>and</strong><br />
below the hurdle rate for Europe ex-UK stocks <strong>of</strong><br />
9%. Our target price provides a potential return <strong>of</strong><br />
20.8%, above the Neutral b<strong>and</strong> <strong>of</strong> our model;<br />
therefore, we reiterate our Overweight (V) rat<strong>in</strong>g on<br />
Ferragamo. Potential return equals the percentage<br />
difference between the current share price <strong>and</strong> the<br />
target price, <strong>in</strong>clud<strong>in</strong>g the forecast dividend yield<br />
when <strong>in</strong>dicated. Company-specific downside risks<br />
<strong>in</strong>clude failure to execute <strong>in</strong>itiatives aim<strong>in</strong>g at<br />
<strong>in</strong>creas<strong>in</strong>g store sales productivity <strong>and</strong> a placement<br />
<strong>of</strong> shares from Ferragamo family members.<br />
47
Consumer Br<strong>and</strong>s & Retail<br />
Global luxury goods<br />
September 2012<br />
abc<br />
In 2012 y-t-d, the stock is up 71%. Based on our<br />
2013 estimates, which are 9% above consensus at<br />
the EBIT level <strong>and</strong> 17% at the EPS level,<br />
Ferragamo is trad<strong>in</strong>g at 17.6x 2013e PE, a 16%<br />
premium to peers, warranted <strong>in</strong> our view by the<br />
superior earn<strong>in</strong>gs growth prospects <strong>in</strong> 2014e (EPS<br />
up 17%) <strong>and</strong> beyond.<br />
We believe that consensus notably underestimates<br />
the impact <strong>of</strong> the company’s strategy to<br />
buy back m<strong>in</strong>orities (we forecast the share <strong>of</strong><br />
m<strong>in</strong>orities <strong>of</strong> total net pr<strong>of</strong>it to drop from 20% <strong>in</strong><br />
2012 to 5% <strong>in</strong> 2013 <strong>and</strong> beyond). These buybacks<br />
expla<strong>in</strong> why we forecast EPS will grow<br />
much faster than EBIT <strong>in</strong> 2013e (40% vs 17%).<br />
Salvatore Ferragamo – Pr<strong>of</strong>it & Loss<br />
(EURm) FY 07a FY 08a FY 09a FY 10a FY 11a Q1 12a Q2 12a FY 12e FY 13e FY 14e<br />
Revenues 687.4 690.8 619.6 781.6 986.3 259.6 305.5 1,200.0 1,380.0 1,530.0<br />
COGS 260.6 271.9 256.1 289.4 352.9 96.5 109.0 422.4 474.7 514.1<br />
% <strong>of</strong> sales 37.9% 39.4% 41.3% 37.0% 35.8% 37.2% 35.7% 35.2% 34.4% 33.6%<br />
Gross pr<strong>of</strong>it 426.8 419.0 363.5 492.2 633.4 163.1 196.5 777.6 905.3 1,015.9<br />
Gross marg<strong>in</strong> 62.1% 60.6% 58.7% 63.0% 64.2% 62.8% 64.3% 64.8% 65.6% 66.4%<br />
Operat<strong>in</strong>g expenses -349.4 -355.2 -327.1 -405.8 -476.8 -133.0 -138.2 -570.2 -645.4 -707.2<br />
% <strong>of</strong> sales -50.8% -51.4% -52.8% -51.9% -48.3% -51.2% -45.2% -47.5% -46.8% -46.2%<br />
Operat<strong>in</strong>g pr<strong>of</strong>it (EBIT) 77.4 63.8 36.5 86.4 156.6 30.1 58.3 207.4 259.8 308.8<br />
EBIT marg<strong>in</strong> 11.3% 9.2% 5.9% 11.1% 15.9% 11.6% 19.1% 17.3% 18.8% 20.2%<br />
EBITDA 100.0 86.0 61.9 113.1 183.6 38.2 66.6 236.9 292.2 344.4<br />
EBITDA marg<strong>in</strong> 14.5% 12.4% 10.0% 14.5% 18.6% 14.7% 21.8% 19.7% 21.2% 22.5%<br />
Net f<strong>in</strong>ancial result -9.7 -0.4 -2.1 2.4 -3.0 -1.5 0.8 0.0 1.0 2.0<br />
Associates 0.3 0.8 0.4 0.5 0.7 0.2 0.3<br />
Pr<strong>of</strong>it before tax 67.9 64.2 34.8 89.3 154.3 28.9 59.4 207.4 260.8 310.8<br />
Income tax expense 20.8 25.3 49.5 28.5 51.1 11.9 20.5 68.5 86.1 102.5<br />
Effective tax rate 30.6% 39.5% 142.1% 31.9% 33.1% 41.2% 34.5% 33.0% 33.0% 33.0%<br />
Net pr<strong>of</strong>it for the period 47.1 38.9 -14.7 60.8 103.2 17.0 38.9 139.0 174.8 208.2<br />
o/w group 38.5 29.8 -20.9 48.9 81.3 12.0 32.8 111.2 166.0 197.8<br />
o/w m<strong>in</strong>ority <strong>in</strong>terests 8.7 9.1 6.2 11.9 22.0 5.0 6.1 27.8 8.7 10.4<br />
Diluted EPS 0.22 0.22 -0.12 0.29 0.48 0.07 0.19 0.66 0.99 1.17<br />
YoY Variation<br />
Net sales na 1% -10% 26% 26% 23% 23% 22% 15% 11%<br />
Operat<strong>in</strong>g expenses na 2% -8% 24% 17% 22% 23% 20% 13% 10%<br />
EBIT na -18% -43% 137% 81% 43% 17% 32% 25% 19%<br />
PBT na -5% -46% 157% 73% 78% 24% 34% 26% 19%<br />
Net pr<strong>of</strong>it (group share) na -23% -170% -334% 66% -1% 37% 37% 49% 19%<br />
Source: Company data, HSBC estimates<br />
48
2<br />
0<br />
.<br />
8<br />
Consumer Br<strong>and</strong>s & Retail<br />
Global luxury goods<br />
September 2012<br />
abc<br />
F<strong>in</strong>ancials & valuation: Ferragamo<br />
F<strong>in</strong>ancial statements<br />
Year to 12/2011a 12/2012e 12/2013e 12/2014e<br />
Pr<strong>of</strong>it & loss summary (EURm)<br />
Revenue 986 1,200 1,380 1,530<br />
EBITDA 184 237 292 344<br />
Depreciation & amortisation -27 -29 -32 -36<br />
Operat<strong>in</strong>g pr<strong>of</strong>it/EBIT 157 207 260 309<br />
Net <strong>in</strong>terest -3 0 1 2<br />
PBT 154 207 261 311<br />
HSBC PBT 154 207 261 311<br />
Taxation -51 -68 -86 -103<br />
Net pr<strong>of</strong>it 81 111 166 198<br />
HSBC net pr<strong>of</strong>it 81 111 166 198<br />
Cash flow summary (EURm)<br />
Cash flow from operations 112 126 171 214<br />
Capex -42 -39 -43 -47<br />
Cash flow from <strong>in</strong>vestment -42 -69 -43 -47<br />
Dividends -45 -71 -80 -111<br />
Change <strong>in</strong> net debt -32 58 -47 -56<br />
FCF equity 61 86 128 167<br />
Balance sheet summary (EURm)<br />
Intangible fixed assets 102 102 102 102<br />
Tangible fixed assets 128 168 179 190<br />
Current assets 443 498 603 709<br />
Cash & others 73 59 106 162<br />
Total assets 676 770 886 1,004<br />
Operat<strong>in</strong>g liabilities 342 369 390 410<br />
Gross debt 58 58 58 58<br />
Net debt -14 44 -3 -60<br />
Shareholders funds 256 324 419 516<br />
Invested capital 258 340 387 429<br />
Ratio, growth <strong>and</strong> per share analysis<br />
Year to 12/2011a 12/2012e 12/2013e 12/2014e<br />
Y-o-y % change<br />
Revenue 26.2 21.7 15.0 10.9<br />
EBITDA 62.3 29.0 23.4 17.8<br />
Operat<strong>in</strong>g pr<strong>of</strong>it 81.2 32.4 25.3 18.8<br />
PBT 72.8 34.4 25.7 19.1<br />
HSBC EPS 67.6 36.8 49.3 19.1<br />
Ratios (%)<br />
Revenue/IC (x) 3.8 4.0 3.8 3.8<br />
ROIC 39.9 46.5 47.9 50.7<br />
ROE 36.2 38.3 44.7 42.3<br />
ROA 18.0 19.2 21.1 22.0<br />
EBITDA marg<strong>in</strong> 18.6 19.7 21.2 22.5<br />
Operat<strong>in</strong>g pr<strong>of</strong>it marg<strong>in</strong> 15.9 17.3 18.8 20.2<br />
EBITDA/net <strong>in</strong>terest (x) 61.0<br />
Net debt/equity -4.8 13.6 -0.8 -11.5<br />
Net debt/EBITDA (x) -0.1 0.2 0.0 -0.2<br />
CF from operations/net debt 285.6<br />
Per share data (EUR)<br />
EPS Rep (fully diluted) 0.48 0.66 0.99 1.17<br />
HSBC EPS (fully diluted) 0.48 0.66 0.99 1.17<br />
DPS 0.28 0.32 0.47 0.56<br />
Book value 1.52 1.93 2.49 3.06<br />
DCF analysis<br />
HSBC assumptions<br />
DCF, compris<strong>in</strong>g<br />
Overweight (V)<br />
Risk-free rate (%) 3.00 EBIT growth 2011-21e CAGR (%) 14.8<br />
Equity premium (%) 6.00 EBIT growth 2021-41e CAGR (%) 4.5<br />
Sector beta 1.20 Fade period 2041-47e<br />
Specific beta 1.00 WACC (%) 10.09<br />
Sensitivity <strong>and</strong> valuation range (GBP/share)<br />
Cost <strong>of</strong> capital vs fade period 4 years 8 years 12 years<br />
9.1% 23.6 24.2 24.7<br />
9.6% 22.0 22.5 22.9<br />
10.1% 20.6 21.0 21.4<br />
10.6% 19.3 19.6 20.0<br />
11.1% 18.1 18.4 18.7<br />
Valuation data<br />
Year to 12/2011a 12/2012e 12/2013e 12/2014e<br />
EV/sales 3.0 2.5 2.1 1.9<br />
EV/EBITDA 16.1 12.5 10.0 8.3<br />
EV/IC 11.5 8.7 7.5 6.7<br />
PE* 36.0 26.3 17.6 14.8<br />
P/Book value 11.4 9.0 7.0 5.7<br />
FCF yield (%) 2.0 2.9 4.4 5.7<br />
Dividend yield (%) 1.6 1.8 2.7 3.2<br />
Note: * = Based on HSBC EPS (fully diluted)<br />
Issuer <strong>in</strong>formation<br />
Share price (EUR)17.38 Target price (EUR)21.00<br />
Reuters (Equity) SFER.MI Bloomberg (Equity) SFER IM<br />
Market cap (USDm) 3,663 Market cap (EURm) 2,927<br />
Free float (%) 25 Enterprise value (EURm) 2971<br />
Country Italy Sector Textiles, Apparel & <strong>Luxury</strong><br />
Goods<br />
Analysts Sophie Dargnies Contact 331 5652 4348<br />
Anto<strong>in</strong>e Belge Contact 331 5652 4347<br />
Erwan Rambourg Contact 852 2996 6572<br />
Price relative<br />
21<br />
21<br />
19<br />
19<br />
17<br />
17<br />
15<br />
15<br />
13<br />
13<br />
11<br />
11<br />
9<br />
9<br />
7<br />
7<br />
Aug-11 Feb-12 Aug-12<br />
Sa lvatore Fe rragam Rel to BCI AL L-SHARE INDEX<br />
Source: HSBC<br />
Note: price at close <strong>of</strong> 27 Aug 2012<br />
49
Consumer Br<strong>and</strong>s & Retail<br />
Global luxury goods<br />
September 2012<br />
abc<br />
Hengdeli Hold<strong>in</strong>gs<br />
Potentially the biggest victim <strong>of</strong> Ch<strong>in</strong>ese purchas<strong>in</strong>g abroad;<br />
without regulation changes, Hengdeli’s structural growth would<br />
trend lower<br />
Unlike European partners, momentum should not deteriorate<br />
much from here though, which makes it an <strong>in</strong>terest<strong>in</strong>g stock<br />
Reiterate OW(V) but cut estimates <strong>in</strong> the short <strong>and</strong> long term; cut<br />
target price to HKD3.20 (from HKD4.10)<br />
Structurally lower growth<br />
unless…<br />
H1 results showed disappo<strong>in</strong>t<strong>in</strong>g sales,<br />
solid marg<strong>in</strong>s but a dull outlook<br />
Sales disappo<strong>in</strong>t<strong>in</strong>g: H1 reported retail sales growth<br />
<strong>of</strong> just 4.6%, with ma<strong>in</strong>l<strong>and</strong> Ch<strong>in</strong>a do<strong>in</strong>g f<strong>in</strong>e<br />
(+8.8%) but Hong Kong down 2.4% (up only 1.0%<br />
at constant FX) <strong>and</strong> wholesale outperform<strong>in</strong>g<br />
(+11%). The results were driven by a number <strong>of</strong><br />
factors, <strong>in</strong>clud<strong>in</strong>g: products at entry price po<strong>in</strong>ts; its<br />
dom<strong>in</strong>ance <strong>in</strong> wholesale <strong>and</strong> to a lesser degree <strong>in</strong><br />
ma<strong>in</strong>l<strong>and</strong>, which are see<strong>in</strong>g more resilient dem<strong>and</strong><br />
than <strong>in</strong> high-end watches; <strong>and</strong> its dom<strong>in</strong>ance <strong>in</strong> HK<br />
which appears to be affected by the dry<strong>in</strong>g up <strong>of</strong><br />
corporate gift<strong>in</strong>g. Look<strong>in</strong>g at ma<strong>in</strong>l<strong>and</strong> Ch<strong>in</strong>a, the<br />
"mid-end" – basically the entry price po<strong>in</strong>t sold at<br />
"With Time" <strong>and</strong> "Prime Time" concepts – was up<br />
24% while the high-end (“Elegant” concept)<br />
decl<strong>in</strong>ed 8%. The high-end segment <strong>in</strong> HK was<br />
slightly up as we believe consumers look more<br />
closely at prices <strong>in</strong> uncerta<strong>in</strong> times <strong>and</strong> corporate<br />
gift<strong>in</strong>g has shifted to overseas markets. In ma<strong>in</strong>l<strong>and</strong><br />
Ch<strong>in</strong>a, same store sales growth was flat all <strong>in</strong> (-<br />
0.2%) but up 10.4% for the mid-end.<br />
Marg<strong>in</strong> decent: gross marg<strong>in</strong> was nonetheless up<br />
100bps (to 26.7%) as Hengdeli is: a) gett<strong>in</strong>g better<br />
terms with its partners, b) not discount<strong>in</strong>g as much<br />
(despite <strong>in</strong>ventory build-up) as last year, <strong>and</strong> c)<br />
benefitt<strong>in</strong>g from a better mix (gross marg<strong>in</strong> is greater<br />
<strong>in</strong> ma<strong>in</strong>l<strong>and</strong> Ch<strong>in</strong>a <strong>and</strong> on lower-priced items). The<br />
difference <strong>in</strong> gross marg<strong>in</strong> between mid-end <strong>and</strong><br />
high price po<strong>in</strong>ts is between 300 to 500 bps.<br />
Stripp<strong>in</strong>g out the exceptional ga<strong>in</strong> (related to the<br />
Omas disposal), core pr<strong>of</strong>it marg<strong>in</strong> was up 20bps to<br />
13.5%, not a bad result as staff costs <strong>and</strong> rental costs<br />
were up as a percentage <strong>of</strong> sales to a respective 5.1%<br />
(from 4.7%) <strong>and</strong> 6.0% (from 5.5%).<br />
Dull outlook: Visibility rema<strong>in</strong>s poor on Greater<br />
Ch<strong>in</strong>a dem<strong>and</strong> as we believe consumer psychology<br />
is be<strong>in</strong>g affected <strong>and</strong> they treat Ch<strong>in</strong>a stores as<br />
showrooms, where they discover the products that<br />
they eventually end up purchas<strong>in</strong>g abroad. The<br />
recent currency movement <strong>and</strong> notably the EUR<br />
collapse have not helped Hengdeli. We believe Q3<br />
so far has seen trends <strong>in</strong> l<strong>in</strong>e with Q2, with the<br />
entry price po<strong>in</strong>ts rebound<strong>in</strong>g very slightly (which<br />
by our estimates were s<strong>of</strong>ter than <strong>in</strong> Q1; hence, if<br />
H1 all-<strong>in</strong> price po<strong>in</strong>ts were up 6.3%, Q2 would<br />
probably be flattish).<br />
50
Consumer Br<strong>and</strong>s & Retail<br />
Global luxury goods<br />
September 2012<br />
abc<br />
Management’s goal is to try to grow the bus<strong>in</strong>ess <strong>in</strong><br />
H2 <strong>and</strong> address the <strong>in</strong>ventory situation (195 days at<br />
the end <strong>of</strong> H1) <strong>in</strong>herited through an overly optimistic<br />
stance at the beg<strong>in</strong>n<strong>in</strong>g <strong>of</strong> the year with an obligation<br />
to carry the products that it has committed to dur<strong>in</strong>g<br />
the watch fairs at the beg<strong>in</strong>n<strong>in</strong>g <strong>of</strong> the year.<br />
The company mentioned that it is work<strong>in</strong>g with the<br />
br<strong>and</strong> managers to reign <strong>in</strong> <strong>in</strong>ventories (ie. order<br />
much less), which has started happen<strong>in</strong>g s<strong>in</strong>ce July.<br />
They are also work<strong>in</strong>g to replace the low-turnover<br />
products with high-turnover ones.<br />
Future not so bright: We don’t expect sales to<br />
rebound <strong>in</strong> the short term. We believe the group is<br />
adopt<strong>in</strong>g a realistic attitude <strong>of</strong> not push<strong>in</strong>g the idea<br />
that with the upcom<strong>in</strong>g change <strong>in</strong> the Ch<strong>in</strong>ese<br />
adm<strong>in</strong>istration, everyth<strong>in</strong>g will be resolved <strong>and</strong><br />
corporate gift<strong>in</strong>g would resume. We believe the<br />
future is not as bright <strong>and</strong> the c20% growth that<br />
Hengdeli was envisag<strong>in</strong>g at the beg<strong>in</strong>n<strong>in</strong>g <strong>of</strong> 2012<br />
for the <strong>in</strong>dustry <strong>in</strong> Ch<strong>in</strong>a over the next five years will<br />
not be realistic, as Ch<strong>in</strong>ese nationals are mak<strong>in</strong>g<br />
more purchases abroad. This implies a new<br />
susta<strong>in</strong>able growth rate at a much lower level – mid<br />
to high s<strong>in</strong>gle digit, <strong>in</strong> our view. However, we<br />
believe one element could change this lower outlook<br />
– if the new adm<strong>in</strong>istration would lower: a) the VAT<br />
rate, b) import duties on watches, <strong>and</strong> c) the<br />
consumption tax on high-end watches. In our view,<br />
the visibility on a lower VAT rate is low but<br />
lower<strong>in</strong>g the import duties on watches should<br />
eventually happen. A lower consumption tax on<br />
high-end watches would make sense but could take<br />
longer to implement as the M<strong>in</strong>istry <strong>of</strong> F<strong>in</strong>ance <strong>and</strong><br />
M<strong>in</strong>istry <strong>of</strong> <strong>Commerce</strong> have been debat<strong>in</strong>g this for a<br />
while.<br />
Th<strong>in</strong>gs won’t get better <strong>in</strong> a w<strong>in</strong>k but we<br />
see a bottom<strong>in</strong>g <strong>of</strong> trends<br />
Guanxi has played key role <strong>in</strong> how bus<strong>in</strong>ess was<br />
done <strong>in</strong> Ch<strong>in</strong>a; hence we expect it to eventually<br />
rega<strong>in</strong> its importance. We believe Q3 (end<strong>in</strong>g<br />
September) sales growth, although usually not<br />
disclosed by the company, will rema<strong>in</strong> flattish before<br />
pick<strong>in</strong>g up aga<strong>in</strong> due to easier retail comps (H2 2011<br />
was up 21%, versus up 36% <strong>in</strong> H1 2012).<br />
With Hengdeli’s scale (36% market share <strong>in</strong> Ch<strong>in</strong>a)<br />
<strong>and</strong> its expansion focus<strong>in</strong>g on smaller cities where<br />
dem<strong>and</strong> for products with entry price po<strong>in</strong>ts rema<strong>in</strong>s<br />
strong <strong>and</strong> is more pr<strong>of</strong>itable, we believe H2 sales<br />
<strong>and</strong> core pr<strong>of</strong>its will not deteriorate significantly<br />
relative to H1.<br />
Earn<strong>in</strong>gs, valuation <strong>and</strong> risks<br />
We have cut our earn<strong>in</strong>gs estimates significantly for<br />
2012 <strong>and</strong> 2013 (by a respective 3% <strong>and</strong> 23%,<br />
exclud<strong>in</strong>g exceptionals) on much lower sales growth<br />
than previously expected. For 2012, we now expect<br />
5.4% reported sales growth, less than half <strong>of</strong> our<br />
previous growth estimate. With EBIT marg<strong>in</strong> flattish<br />
on a full-year basis, <strong>and</strong> exclud<strong>in</strong>g exceptionals, we<br />
expect earn<strong>in</strong>gs growth <strong>of</strong> c7% <strong>in</strong> 2012?.<br />
We believe the risk <strong>of</strong> discount<strong>in</strong>g products (to reign<br />
<strong>in</strong> <strong>in</strong>ventories) is low as Hengdeli will take a longterm<br />
view on br<strong>and</strong> distribution <strong>and</strong> address the<br />
<strong>in</strong>ventory issue by order<strong>in</strong>g less rather than risk<br />
damag<strong>in</strong>g their br<strong>and</strong>s’ equity.<br />
Valuation<br />
We decrease our DCF-based target price to<br />
HKD3.20 (from HKD4.10) on the back <strong>of</strong> these<br />
lower assumptions. Our key assumptions are a RFR<br />
<strong>of</strong> 3.0% vs 3.5%, ERP <strong>of</strong> 7.0% vs 6.5% <strong>and</strong> a<br />
WACC <strong>of</strong> 10.21 (see table on page 53).<br />
Under our research model, for stocks with a<br />
volatility <strong>in</strong>dicator, the Neutral b<strong>and</strong> is 10ppts<br />
above <strong>and</strong> below the hurdle rate for Ch<strong>in</strong>ese stocks<br />
<strong>of</strong> 10%. Our HKD3.20 target price implies a 47.5%<br />
potential return, which is above the Neutral b<strong>and</strong>;<br />
therefore, we reiterate our Overweight (V) rat<strong>in</strong>g<br />
on Hengdeli stock. Potential return equals the<br />
percentage difference between the current share<br />
price <strong>and</strong> the target price, <strong>in</strong>clud<strong>in</strong>g the forecast<br />
dividend yield when <strong>in</strong>dicated.<br />
Hengdeli has the highest potential return <strong>in</strong> our<br />
coverage, although we note it is among one <strong>of</strong> the<br />
highest risk stocks as well. At the current price, <strong>and</strong><br />
51
Consumer Br<strong>and</strong>s & Retail<br />
Global luxury goods<br />
September 2012<br />
abc<br />
on our EPS estimates, Hengdeli is trad<strong>in</strong>g at<br />
10.2x2012e <strong>and</strong> 11x2013e earn<strong>in</strong>gs. On our target<br />
price, the stock would be trad<strong>in</strong>g at 11.9x 2012e<br />
earn<strong>in</strong>gs. We believe the stock’s recent de-rat<strong>in</strong>g vs<br />
the European stocks has gone too far, <strong>in</strong> our view.<br />
Risks<br />
Downside risks to our thesis <strong>in</strong>clude execution risk<br />
<strong>in</strong> manag<strong>in</strong>g the store expansion plans, <strong>and</strong> higherthan-expected<br />
rent <strong>and</strong> M&A activity (eg. buyout <strong>of</strong><br />
retail stores, further <strong>in</strong>vestment <strong>in</strong> M<strong>in</strong>g Fung) that<br />
could be negatively viewed by the market.<br />
Hengdeli/Emperor vs Swatch/Richemont<br />
30%<br />
5%<br />
-20%<br />
'05 '06 '07 '08 '09 '10 '11<br />
Av g=-27.2%<br />
-45%<br />
-70%<br />
Prem/Disc Av erage<br />
Source: Thomson Reuters Datastream, I/B/E/S estimates for Emperor, HSBC estimates<br />
Hengedeli - P&L Statement<br />
Year to Dec (RMBm) 2009 1H10 2H10 2010 1H11 2H11 2011 1H12 2H12 2012e 2013e 2014e<br />
Total number <strong>of</strong> stores 270 302 350 350 380 405 405 428 451 451 494 535<br />
+/- 58 32 48 80 30 25 55 23 23 46 43 41<br />
% POS yoy 27% 30% 16% 11% 10% 8%<br />
PRC retail (RMBm) 2,722 1,774 1,996 3,770 2,596 2,614 5,210 2,825 2,710 5,534 6,040 6,599<br />
- No. <strong>of</strong> stores 224 252 286 286 311 332 332 352 372 372 410 446<br />
same-store sales growth 12% 34% 32% 33% 38% 22% 30% 0% -2% -1% 3% 4%<br />
% change yoy 17% 40% 37% 38% 46% 31% 40% 9% 4% 6% 9% 9%<br />
HK retail (RMBm) 1,705 1,046 1,366 2,412 1,449 1,708 3,157 1,415 1,679 3,094 3,156 3,251<br />
- No. <strong>of</strong> stores 13 15 16 16 16 19 19 16 16 16 16 16<br />
+/- 3 5 3 3 0 3 3 -3 0 -3 0 0<br />
% change yoy 20% 45% 33% 41% 39% 25% 31% -2% -2% -2% 2% 3%<br />
Taiwan retail (RMBm) 8 68 125 193 103 120 222 100 123 222 224 227<br />
- No. <strong>of</strong> stores 33 35 48 48 50 4 54 60 63 63 68 73<br />
% change yoy 51% -4% 15% -3% 3% 0% 1% 1%<br />
Retail<strong>in</strong>g (RMBm) 4,428 2,888 3,487 6,375 4,148 4,442 8,589 4,339 4,512 8,851 9,420 10,077<br />
y/y 44% 41% 44% 44% 27% 35% 5% 2% 3% 6% 7%<br />
Wholesale (RMBm) 1,330 751 910 1,661 1,156 1,395 2,551 1,284 1,573 2,857 3,257 3,712<br />
y/y -19% 10% 40% 25% 54% 53% 54% 11% 13% 12% 14% 14%<br />
Others (RMBm; e.g., after-sales) 134 75.6 104 180 104 132 235 127 156 283 331 380<br />
y/y -6% 22% 45% 34% 37% 26% 31% 22% 18% 20% 17% 15%<br />
Sales (RMBm) 5,892 3,715 4,501 8,216 5,407 5,968 11,375 5,750 6,240 11,990 13,007 14,169<br />
y/y 6.8% 37.8% 40.8% 39.4% 45.6% 32.6% 38.5% 6.3% 4.6% 5.4% 8.5% 8.9%<br />
Gr pr<strong>of</strong>it (RMBm) 1,401 915 1,134 2,049 1,392 1,465 2,857 1,536 1,549 3,085 3,284 3,544<br />
GP marg<strong>in</strong> 23.8% 24.6% 25.2% 24.9% 25.7% 24.5% 25.1% 26.7% 24.8% 25.7% 25.2% 25.0%<br />
bp change -35.4 -0.8 213.2 115.6 112.9 -66.0 17.7 95.9 28.5 61.4 -48.1 -23.6<br />
EBIT 578 387 432 819 643 516 1,160 678 525 1,203 1,268 1,376<br />
y/y 6.2% -2402.8% - 41.6% 66.3% 19.5% 41.6% 5.3% 1.7% 3.7% 5.4% 8.5%<br />
EBIT marg<strong>in</strong> 9.8% 10.4% 9.6% 10.0% 11.9% 8.7% 10.2% 11.8% 8.4% 10.0% 9.7% 9.7%<br />
Pre-tax pr<strong>of</strong>it 513 425 391 816 647 551 1,198 771 456 1,227 1,158 1,277<br />
y/y -14.0% -1659.4% -27.7% 58.9% 52.4% 41.0% 46.9% 19.2% -17.3% 2.4% -5.7% 10.4%<br />
Tax -128 -95 -103 -198 -147 -133 -280 -158 -112 -270 -266 -307<br />
Eff tax rate (excl CB loss) 24.9% 22.4% 26.4% 24.3% 22.7% 24.2% 23.4% 20.4% 24.7% 22.0% 23.0% 24.0%<br />
M<strong>in</strong>orities -21 -25 -39 -63 -52 -51 -103 -51 -51 -102 -93 -102<br />
Net pr<strong>of</strong>it/(Loss) - reported 364 305 249 554 448 367 815 563 293 855 799 869<br />
y/y -16.8% -406.4% -46.4% 52.0% 46.8% 47.5% 47.1% 25.6% -20.3% 4.9% -6.6% 8.8%<br />
Net marg<strong>in</strong> 6.2% 8.2% 5.5% 6.7% 8.3% 6.1% 7.2% 6.1% 4.7% 7.1% 6.1% 6.1%<br />
HSBC core net pr<strong>of</strong>it 360 279 249 528 445 348 793 424 309 733 799 869<br />
y/y -17.9% 31.7% 68.6% 46.8% 59.2% 40.0% 50.1% -4.8% -11.1% -7.6% 8.9% 8.8%<br />
Core net marg<strong>in</strong> 6.1% 7.5% -7.4% 6.4% 8.2% -7.7% 7.0% 5.8% -3.5% 6.1% 6.1% 6.1%<br />
Source: Company data, HSBC estimates<br />
52
4<br />
7<br />
.<br />
5<br />
Consumer Br<strong>and</strong>s & Retail<br />
Global luxury goods<br />
September 2012<br />
abc<br />
F<strong>in</strong>ancials & valuation: Hengdeli Hold<strong>in</strong>gs Ltd<br />
Overweight (V)<br />
F<strong>in</strong>ancial statements<br />
Year to 12/2011a 12/2012e 12/2013e 12/2014e<br />
Pr<strong>of</strong>it & loss summary (CNYm)<br />
Revenue 11,375 11,990 13,007 14,169<br />
EBITDA 1,235 1,283 1,355 1,471<br />
Depreciation & amortisation -75 -81 -87 -95<br />
Operat<strong>in</strong>g pr<strong>of</strong>it/EBIT 1,160 1,203 1,268 1,376<br />
Net <strong>in</strong>terest 6 -71 -81 -67<br />
PBT 1,198 1,227 1,158 1,277<br />
HSBC PBT 1,198 1,227 1,158 1,277<br />
Taxation -280 -270 -266 -307<br />
Net pr<strong>of</strong>it 815 855 799 869<br />
HSBC net pr<strong>of</strong>it 815 855 799 869<br />
Cash flow summary (CNYm)<br />
Cash flow from operations 158 38 1,068 1,106<br />
Capex -207 -300 -150 -150<br />
Cash flow from <strong>in</strong>vestment -268 -222 -90 -80<br />
Dividends -185 -281 -257 -240<br />
Change <strong>in</strong> net debt 309 712 -377 -465<br />
FCF equity 198 -467 692 718<br />
Balance sheet summary (CNYm)<br />
Intangible fixed assets 320 317 315 312<br />
Tangible fixed assets 921 917 983 1,043<br />
Current assets 9,740 10,508 11,033 11,747<br />
Cash & others 3,942 4,160 4,287 4,501<br />
Total assets 11,155 11,931 12,539 13,333<br />
Operat<strong>in</strong>g liabilities 1,938 1,383 1,605 1,916<br />
Gross debt 4,244 5,174 4,924 4,674<br />
Net debt 302 1,014 637 173<br />
Shareholders funds 4,891 5,465 6,007 6,636<br />
Invested capital 5,102 6,199 6,439 6,685<br />
Ratio, growth <strong>and</strong> per share analysis<br />
Year to 12/2011a 12/2012e 12/2013e 12/2014e<br />
Y-o-y % change<br />
Revenue 38.5 5.4 8.5 8.9<br />
EBITDA 41.5 3.9 5.6 8.5<br />
Operat<strong>in</strong>g pr<strong>of</strong>it 41.6 3.7 5.4 8.5<br />
PBT 46.9 2.4 -5.7 10.4<br />
HSBC EPS 46.5 4.9 -6.6 8.8<br />
Ratios (%)<br />
Revenue/IC (x) 2.4 2.1 2.1 2.2<br />
ROIC 18.7 16.6 15.5 16.0<br />
ROE 17.7 16.5 13.9 13.7<br />
ROA 9.8 9.2 8.2 8.3<br />
EBITDA marg<strong>in</strong> 10.9 10.7 10.4 10.4<br />
Operat<strong>in</strong>g pr<strong>of</strong>it marg<strong>in</strong> 10.2 10.0 9.7 9.7<br />
EBITDA/net <strong>in</strong>terest (x) 18.2 16.8 22.1<br />
Net debt/equity 5.7 16.9 9.6 2.3<br />
Net debt/EBITDA (x) 0.2 0.8 0.5 0.1<br />
CF from operations/net debt 52.4 3.7 167.5 640.2<br />
Per share data (CNY)<br />
EPS Rep (fully diluted) 0.19 0.17 0.16 0.18<br />
HSBC EPS (fully diluted) 0.17 0.17 0.16 0.18<br />
DPS 0.06 0.06 0.05 0.06<br />
Book value 1.11 1.24 1.37 1.51<br />
DCF analysis<br />
HSBC assumptions<br />
DCF, compris<strong>in</strong>g<br />
Risk-free rate (%) 3.0 EBIT growth 09-19e CAGR (%) 10.0<br />
Equity Premium (%) 7.0 EBIT growth 19-39e CAGR (%) 2.5<br />
Sector beta 1.20 Fade period 2039-45e<br />
Specific beta 1.40 WACC (%) 10.21<br />
Key forecast drivers<br />
Year to 12/2011a 12/2012e 12/2013e 12/2014e<br />
Total number <strong>of</strong> stores 405 451 494 535<br />
PRC retail sales growth (%) 40 6 9 9<br />
HK retail sales growth (%) 31 -2 2 3<br />
Retail turnover growth (%) 35 3 6 7<br />
Wholesales revenue growth (%) 54 12 14 14<br />
Total sales growth (%) 38 5 8 9<br />
Valuation data<br />
Year to 12/2011a 12/2012e 12/2013e 12/2014e<br />
EV/sales 0.7 0.8 0.7 0.6<br />
EV/EBITDA 6.9 7.2 6.6 5.9<br />
EV/IC 1.7 1.5 1.4 1.3<br />
PE* 10.7 10.2 11.0 10.1<br />
P/Book value 1.6 1.4 1.3 1.2<br />
FCF yield (%) 2.4 -5.6 8.3 8.5<br />
Dividend yield (%) 3.6 3.3 3.1 3.3<br />
Note: * = Based on HSBC EPS (fully diluted)<br />
Issuer <strong>in</strong>formation<br />
Share price (HKD)2.17 Target price (HKD)3.20<br />
Reuters (Equity) 3389.HK Bloomberg (Equity) 3389 HK<br />
Market cap (USDm) 1,229 Market cap (HKDm) 9,532<br />
Free float (%) 15 Enterprise value (CNYm) 9277<br />
Country Ch<strong>in</strong>a Sector Distributors<br />
Analyst Erwan Rambourg Contact 852 2996 6572<br />
Anto<strong>in</strong>e Belge Contact 331 5652 4347<br />
Sophie Dargnies Contact 331 5652 4348<br />
Price relative<br />
7<br />
6<br />
5<br />
4<br />
3<br />
2<br />
1<br />
1<br />
Aug-10 Feb-11 Aug-11 Feb-12 Aug-12<br />
Hengdeli Hold<strong>in</strong>gs Ltd Rel to SSE COMPOSITE INDEX<br />
Source: HSBC<br />
Note: price at close <strong>of</strong> 27 Aug 2012<br />
7<br />
6<br />
5<br />
4<br />
3<br />
2<br />
53
Consumer Br<strong>and</strong>s & Retail<br />
Global luxury goods<br />
September 2012<br />
abc<br />
Hermès<br />
Underperformance <strong>of</strong> Hermès’ shares year-to-date<br />
Technical effects (limited free float <strong>and</strong> grants <strong>of</strong> shares to<br />
employees) should put a floor to the shares<br />
Upgrad<strong>in</strong>g to Neutral (from Underweight) but <strong>red</strong>uc<strong>in</strong>g target price<br />
to EUR245 (from EUR272) due to a lower WACC<br />
Upgrade to Neutral<br />
Underperformance <strong>of</strong> Hermès’ shares<br />
year-to-date<br />
Hermès’ shares are down 4% year-to-date whilst<br />
our overall European luxury coverage stocks have<br />
<strong>in</strong>creased by 26%.<br />
Hermes' share price performance s<strong>in</strong>ce January 2010<br />
300<br />
250<br />
200<br />
150<br />
100<br />
50<br />
janv -10 juil-10 janv -11 juil-11 janv -12 juil-12<br />
Source: Thomson Reuters Datastream<br />
Robust fundamentals<br />
Hermès cont<strong>in</strong>ued to register strong organic sales<br />
growth <strong>in</strong> H1 (+15%). We do not believe that the<br />
group is immune aga<strong>in</strong>st an economic slowdown,<br />
but we feel that Hermès should be able to<br />
cont<strong>in</strong>ue to post robust EBIT growth over 2012e-<br />
14e (+19%, +12% <strong>and</strong> +9%, respectively), thanks<br />
to its dist<strong>in</strong>ctive position<strong>in</strong>g (perceived to be the<br />
most luxurious br<strong>and</strong>, scarcity <strong>of</strong> the product,<br />
classic style).<br />
Technical effects (a shares grant<br />
program <strong>and</strong> limited free float) should<br />
put a floor to the shares<br />
At the last AGM (on 29 May 2012), the group<br />
received authorisation to raise the share buyback<br />
maximum price from EUR250 to EUR400. Yearto-date,<br />
Hermès has bought 89.5k shares for an<br />
amount <strong>of</strong> EUR21m <strong>in</strong> order to cover the grants <strong>of</strong><br />
shares to employees. True, the group mentioned<br />
that all grants <strong>of</strong> shares to employees for 2012<br />
have been cove<strong>red</strong> but we believe that the group<br />
will have to cont<strong>in</strong>ue to buy shares <strong>in</strong> order to<br />
cover future grants <strong>of</strong> shares. In addition, as the<br />
free float is so limited (c5.1% by our estimates),<br />
this technical effect should put a floor to the<br />
shares. At end-2011, LVMH owned 22.4% <strong>of</strong><br />
Hermès International. On 3 December 2011, the<br />
Hermès family created a private hold<strong>in</strong>g company<br />
<strong>in</strong> France, named H51. H51 has 50.2% <strong>of</strong> total<br />
Hermès International share capital <strong>and</strong> has<br />
preferential rights on 12.3% <strong>of</strong> total share capital<br />
directly owned by family group members. Only<br />
20 people from the family who owned c10% <strong>of</strong><br />
the stock decided not to be part <strong>of</strong> this hold<strong>in</strong>g<br />
company or to be subject to preferential rights.<br />
54
Consumer Br<strong>and</strong>s & Retail<br />
Global luxury goods<br />
September 2012<br />
abc<br />
Earn<strong>in</strong>gs, valuation <strong>and</strong> risks<br />
On 19 July, Hermès published 13% organic sales<br />
growth for Q2 2012 (compa<strong>red</strong> to +18% <strong>in</strong> Q1).<br />
All regions registe<strong>red</strong> a slowdown (at constant<br />
FX) except for Asia ex-Japan (+27% <strong>in</strong> Q2 vs<br />
22% <strong>in</strong> Q1 12): ma<strong>in</strong>l<strong>and</strong> Ch<strong>in</strong>a (up c30%), the<br />
Americas (+8% <strong>in</strong> Q2 vs +11% <strong>in</strong> Q1 12 due to a<br />
strong basis <strong>in</strong> comparison, especially <strong>in</strong> Hermès'<br />
own stores (+34%)), Europe exclud<strong>in</strong>g France<br />
(+16% <strong>in</strong> Q2 vs +27% <strong>in</strong> Q1 12), France (+7% <strong>in</strong><br />
Q2 vs +14% <strong>in</strong> Q1 12), <strong>and</strong> Japan (-1% <strong>in</strong> Q2 vs<br />
8% <strong>in</strong> Q1 12).<br />
Management guided towards 10% organic sales<br />
growth for 2012 (with c10% <strong>in</strong> Europe, above<br />
10% <strong>in</strong> Americas <strong>and</strong> Asia, <strong>and</strong> 0%+ <strong>in</strong> Japan), as<br />
Hermès should benefit from a lower number <strong>of</strong><br />
store open<strong>in</strong>gs (one open<strong>in</strong>g <strong>and</strong> 11 renovations <strong>in</strong><br />
H2 2012 expected vs more than 10 open<strong>in</strong>gs <strong>in</strong><br />
H2 2011). Still, this sales guidance appears<br />
conservative <strong>in</strong> our view as a +10% organic sales<br />
growth for 2012 would mean a strong slowdown<br />
<strong>in</strong> 2H (+5% organic sales growth <strong>in</strong> H2 vs +15%<br />
<strong>in</strong> H1 2012). In terms <strong>of</strong> EBIT marg<strong>in</strong>, the group<br />
expects to have an EBIT marg<strong>in</strong> between the 2010<br />
<strong>and</strong> the all-time high level achieved <strong>in</strong> 2011<br />
(30.4%), as several elements (operat<strong>in</strong>g leverage,<br />
FX impact, price <strong>in</strong>crease not sufficient to <strong>of</strong>fset<br />
raw materials <strong>in</strong>crease, new share buyback<br />
account<strong>in</strong>g methodology) should not be as<br />
positive for 2012 compa<strong>red</strong> to 2011.<br />
We <strong>in</strong>crease both our 2012-13e EBIT estimates by<br />
3%, due to the weaker euro. For 2012e <strong>and</strong> 2013e,<br />
we forecast organic sales growth <strong>of</strong> 13%<br />
(unchanged) <strong>and</strong> 11% (vs 10% previously), <strong>and</strong><br />
EBIT marg<strong>in</strong> <strong>of</strong> 31.1% (vs 31.0% previously) <strong>and</strong><br />
31.3% (vs 31.5% previously), respectively. For<br />
2014e, we expect a 9% organic sales growth <strong>and</strong> a<br />
31.4% EBIT marg<strong>in</strong>.<br />
value (<strong>and</strong> as a result, we cont<strong>in</strong>ue to apply a 25%<br />
premium). For many years, Hermès’ stock has<br />
been supported by the limited free float, takeover<br />
speculation <strong>in</strong> the press (e.g. Bloomberg) <strong>and</strong> the<br />
potential for short squeezes.<br />
On our fundamental DCF valuation, we value<br />
Hermès at EUR196 (down from EUR217.60), on<br />
the back <strong>of</strong> a our earn<strong>in</strong>gs estimate <strong>in</strong>creases <strong>and</strong> a<br />
change to our WACC (5.88% vs 5.16% as we are<br />
now us<strong>in</strong>g a 0.4 specific beta <strong>in</strong>stead <strong>of</strong> 0.3, as the<br />
creation <strong>of</strong> the family hold<strong>in</strong>g company should<br />
<strong>red</strong>uce further potential takeover speculation) .<br />
Apply<strong>in</strong>g a 25% premium to this fundamental<br />
valuation, we derive a new target price <strong>of</strong><br />
EUR245 (down from EUR272). A full breakdown<br />
<strong>of</strong> our DCF assumptions is provided <strong>in</strong> the<br />
f<strong>in</strong>ancials <strong>and</strong> valuation on page 57.<br />
Under our research model, for Europe ex-UK<br />
stocks without a volatility <strong>in</strong>dicator, the Neutral<br />
b<strong>and</strong> is 5 percentage po<strong>in</strong>ts above <strong>and</strong> below the<br />
hurdle rate for Europe ex-UK stocks <strong>of</strong> 9.0%. As<br />
our target price implies an 11% potential return,<br />
with<strong>in</strong> the Neutral b<strong>and</strong>, we upgrade the stock to<br />
Neutral (from Underweight). Potential return<br />
equals the percentage difference between the<br />
current share price <strong>and</strong> the target price, <strong>in</strong>clud<strong>in</strong>g<br />
the forecast dividend yield when <strong>in</strong>dicated.<br />
Although the current 33.0x2012e <strong>and</strong> 29.5x 2013e<br />
PE multiple still seems very high relative to peers<br />
(c100% premium), we believe those <strong>in</strong>vestors<br />
who still own Hermès’ free float should hold on to<br />
the shares. Upside risks <strong>in</strong>clude the current th<strong>in</strong><br />
free float (c5%) be<strong>in</strong>g further <strong>red</strong>uced by share<br />
purchases by LVMH on the market or a buy-back<br />
by Hermès to cover employees’ grant shares. On<br />
the downside, the top l<strong>in</strong>e may suffer more than<br />
expected if the company loses share to other highend<br />
leather-goods manufacturers.<br />
S<strong>in</strong>ce March 2009, we have believed Hermès<br />
should trade structurally at a premium to its DCF<br />
55
Consumer Br<strong>and</strong>s & Retail<br />
Global luxury goods<br />
September 2012<br />
abc<br />
Hermès FY results <strong>and</strong> forecasts<br />
EURm 2005a YoY 2006a<br />
(%)<br />
YoY 2007a<br />
(%)<br />
YoY 2008a<br />
(%)<br />
YoY 2009a<br />
(%)<br />
YoY 2010a<br />
(%)<br />
YoY 2011a<br />
(%)<br />
YoY 2012e<br />
(%)<br />
YoY 2013e<br />
(%)<br />
YoY 2014e<br />
(%)<br />
YoY<br />
(%)<br />
Sales 1,427 7 1,515 6 1,625 7 1,765 9 1,914 8 2,401 25 2,841 18 3,373 19 3,750 11 4,085 9<br />
Gross pr<strong>of</strong>it 929 7 990 7 1,055 7 1,140 8 1,213 6 1,586 31 1,955 23 2,321 19 2,588 11 2,823 9<br />
Gross marg<strong>in</strong> (%) 65.1% 65.4% 64.9% 64.6% 63.3% 66.1% 68.8% 68.8% 69.0% 69.1%<br />
Communication 76 7 90 18 93 3 98 5 91 -7 126 38 148 18 180 21 195 8 210 8<br />
as a % <strong>of</strong> sales 5.3% 5.9% 5.7% 5.5% 4.8% 5.2% 5.2% 5.3% 5.2% 5.1%<br />
Other operat<strong>in</strong>g costs 469 7 499 6 547 10 593 8 658 11 792 20 921 16 1091 18 1220 12 1330 9<br />
EBIT 384 7 401 5 415 3 449 8 463 3 668 44 885 32 1050 19 1173 12 1283 9<br />
EBIT marg<strong>in</strong> 26.9 26.5 25.5 25.5 24.2 27.8 31.2 31.1 31.3 31.4<br />
F<strong>in</strong>ancial <strong>in</strong>come 4 0 12 18 -13 -13 12 13 15 20<br />
Pre-tax pr<strong>of</strong>it 388 13 409 6 438 7 455 4 444 -3 653 47 893 37 1063 19 1188 12 1303 10<br />
Net pr<strong>of</strong>it 247 16 268 9 288 7 290 1 289 0 422 46 594 41 702 18 785 12 861 10<br />
HSBC EPS (EUR) 2.26 10 2.50 11 2.71 8 2.76 2 2.74 -0.5 4.00 46 5.66 41 6.69 18 7.48 12 8.20 10<br />
Source: Company data, HSBC estimates<br />
Hermès sales by geographic <strong>and</strong> product category<br />
EURm 2005a YoY 2006a<br />
(%)<br />
YoY 2007a<br />
(%)<br />
YoY 2008a<br />
(%)<br />
YoY 2009a<br />
(%)<br />
YoY 2010a<br />
(%)<br />
YoY 2011a<br />
(%)<br />
YoY 2012e<br />
(%)<br />
YoY 2013e<br />
(%)<br />
YoY 2014e<br />
(%)<br />
YoY<br />
(%)<br />
By product category<br />
Silk 163 9% 174 6% 193 11% 208 8% 227 9% 284 25% 347 22% 413 19% 457 11% 498 9%<br />
H<strong>and</strong>bags & Travel 568 7% 664 17% 675 2% 763 13% 936 23% 1,205 29% 1,348 12% 1,570 16% 1,753 12% 1,927 10%<br />
RTW & accessories 294 8% 294 0% 315 7% 337 7% 360 7% 445 24% 576 29% 708 23% 804 14% 877 9%<br />
Other activities 141 6% 77 -45% 86 11% 80 -6% 78 -2% 87 11% 109 25% 142 31% 155 9% 165 7%<br />
Perfume 73 13% 101 38% 119 18% 125 5% 117 -6% 138 17% 159 16% 185 16% 201 9% 215 7%<br />
Watches 104 4% 110 6% 105 -5% 95 -10% 87 -8% 113 30% 139 23% 168 21% 182 9% 195 7%<br />
Tableware 37 6% 45 21% 51 14% 48 -6% 38 -20% 44 14% 51 17% 57 12% 60 6% 63 5%<br />
Other products 48 1% 52 8% 82 60% 109 33% 71 -35% 86 21% 113 31% 131 16% 139 6% 146 5%<br />
Total 1,427 1,515 1,625 1765 1,914 2,401 2,841 3,373 3,750 4,085<br />
By geographic<br />
France 269 5% 290 8% 327 13% 359 10% 370 3% 437 18% 495 13% 544 10% 588 8% 632 7%<br />
Europe 243 9% 280 15% 346 24% 382 10% 385 1% 463 20% 560 21% 654 17% 714 9% 764 7%<br />
Total Europe 512 7% 570 11% 673 18% 741 10% 756 2% 901 19% 1,055 17% 1,198 14% 1,302 9% 1,396 7%<br />
Japan 415 4% 410 -1% 382 -7% 393 3% 408 4% 453 11% 472 4% 523 11% 542 4% 553 2%<br />
Asia 245 13% 261 6% 282 8% 321 14% 423 32% 631 49% 808 28% 1,038 28% 1,224 18% 1,407 15%<br />
Total Asia 660 7% 671 2% 664 -1% 713 7% 831 16% 1,084 30% 1,280 18% 1,562 22% 1,766 13% 1,960 11%<br />
America 216 10% 232 8% 246 6% 265 8% 294 11% 385 31% 464 21% 566 22% 632 12% 676 7%<br />
Rest <strong>of</strong> the world 39 -4% 42 8% 43 1% 46 7% 34 -25% 31 -8% 43 37% 47 10% 50 6% 52 5%<br />
Total 1427 1515 1,625 1,765 1,914 2,401 2,841 3,373 3,750 4,085<br />
Source: Company data, HSBC estimates<br />
56
1<br />
1<br />
.<br />
0<br />
Consumer Br<strong>and</strong>s & Retail<br />
Global luxury goods<br />
September 2012<br />
abc<br />
F<strong>in</strong>ancials & valuation: Hermès<br />
F<strong>in</strong>ancial statements<br />
Year to 12/2011a 12/2012e 12/2013e 12/2014e<br />
Pr<strong>of</strong>it & loss summary (EURm)<br />
Revenue 2,841 3,373 3,750 4,085<br />
EBITDA 1,011 1,185 1,317 1,437<br />
Depreciation & amortisation -126 -135 -144 -154<br />
Operat<strong>in</strong>g pr<strong>of</strong>it/EBIT 885 1,050 1,173 1,283<br />
Net <strong>in</strong>terest 12 13 15 20<br />
PBT 893 1,063 1,188 1,303<br />
HSBC PBT 893 1,063 1,188 1,303<br />
Taxation -290 -351 -392 -430<br />
Net pr<strong>of</strong>it 594 702 785 861<br />
HSBC net pr<strong>of</strong>it 594 702 785 861<br />
Cash flow summary (EURm)<br />
Cash flow from operations 737 807 899 980<br />
Capex -185 -250 -280 -313<br />
Cash flow from <strong>in</strong>vestment -185 -250 -280 -313<br />
Dividends -167 -735 -263 -294<br />
Change <strong>in</strong> net debt -210 164 -371 -394<br />
FCF equity 551 570 634 687<br />
Balance sheet summary (EURm)<br />
Intangible fixed assets 135 135 135 134<br />
Tangible fixed assets 869 985 1,121 1,280<br />
Current assets 1,871 1,754 2,170 2,611<br />
Cash & others 1,048 883 1,254 1,647<br />
Total assets 3,248 3,247 3,799 4,398<br />
Operat<strong>in</strong>g liabilities 870 890 910 930<br />
Gross debt 39 39 39 39<br />
Net debt -1,038 -875 -1,245 -1,639<br />
Shareholders funds 2,313 2,280 2,801 3,368<br />
Invested capital 958 1,101 1,263 1,449<br />
Ratio, growth <strong>and</strong> per share analysis<br />
Year to 12/2011a 12/2012e 12/2013e 12/2014e<br />
Y-o-y % change<br />
Revenue 18.3 18.7 11.2 8.9<br />
EBITDA 28.1 17.2 11.2 9.1<br />
Operat<strong>in</strong>g pr<strong>of</strong>it 32.5 18.6 11.7 9.4<br />
PBT 36.9 19.0 11.8 9.7<br />
HSBC EPS 41.5 18.2 11.8 9.7<br />
Ratios (%)<br />
Revenue/IC (x) 3.0 3.3 3.2 3.0<br />
ROIC 64.0 68.3 66.5 63.4<br />
ROE 26.6 30.6 30.9 27.9<br />
ROA 19.6 21.9 22.6 21.3<br />
EBITDA marg<strong>in</strong> 35.6 35.1 35.1 35.2<br />
Operat<strong>in</strong>g pr<strong>of</strong>it marg<strong>in</strong> 31.2 31.1 31.3 31.4<br />
EBITDA/net <strong>in</strong>terest (x)<br />
Net debt/equity -44.6 -38.0 -43.9 -48.0<br />
Net debt/EBITDA (x) -1.0 -0.7 -0.9 -1.1<br />
CF from operations/net debt<br />
Per share data (EUR)<br />
EPS Rep (fully diluted) 5.66 6.69 7.48 8.20<br />
HSBC EPS (fully diluted) 5.66 6.69 7.48 8.20<br />
DPS 7.00 2.51 2.80 3.08<br />
Book value 21.61 21.30 26.17 31.47<br />
DCF analysis<br />
HSBC assumptions<br />
DCF, compris<strong>in</strong>g<br />
Neutral<br />
Risk-free rate (%) 3.00 EBIT growth 2011-21e CAGR (%) 7.8<br />
Equity premium (%) 6.00 EBIT growth 2021-41e CAGR (%) 4.0<br />
Sector beta 1.20 Fade period 2041-47e<br />
Specific beta 0.40 WACC (%) 5.88<br />
Sensitivity <strong>and</strong> valuation range (DCF) to which we then add a 25% premium to<br />
derive our target price (EUR245 per share)<br />
Cost <strong>of</strong> capital vs fade period 4 years 8 years 12 years<br />
5.5% 200.8 208.9 216.0<br />
5.7% 194.7 202.3 209.1<br />
5.9% 188.9 196.0 202.6<br />
6.1% 183.4 190.0 196.3<br />
6.3% 178.1 184.3 190.3<br />
Valuation data<br />
Year to 12/2011a 12/2012e 12/2013e 12/2014e<br />
EV/sales 7.7 6.5 5.8 5.2<br />
EV/EBITDA 21.6 18.6 16.5 14.8<br />
EV/IC 22.8 20.0 17.2 14.7<br />
PE* 39.0 33.0 29.5 26.9<br />
P/Book value 10.2 10.4 8.4 7.0<br />
FCF yield (%) 2.4 2.5 2.8 3.0<br />
Dividend yield (%) 3.2 1.1 1.3 1.4<br />
Note: * = Based on HSBC EPS (fully diluted)<br />
Issuer <strong>in</strong>formation<br />
Share price (EUR)220.65 Target price (EUR)245.00<br />
Reuters (Equity) HRMS.PA Bloomberg (Equity) RMS FP<br />
Market cap (USDm) 29,154 Market cap (EURm) 23,294<br />
Free float (%) 6 Enterprise value (EURm) 22047<br />
Country France Sector Textiles, Apparel & <strong>Luxury</strong><br />
Goods<br />
Analyst Sophie Dargnies Contact 331 5652 4348<br />
Anto<strong>in</strong>e Belge Contact 331 5652 4347<br />
Erwan Rambourg Contact 852 2996 6572<br />
Price relative<br />
348<br />
298<br />
248<br />
198<br />
148<br />
98<br />
98<br />
Aug-10 Feb-11 Aug-11 Feb-12 Aug-12<br />
Hermes Rel to SBF-120<br />
Source: HSBC<br />
Note: price at close <strong>of</strong> 27 Aug 2012<br />
348<br />
298<br />
248<br />
198<br />
148<br />
57
Consumer Br<strong>and</strong>s & Retail<br />
Global luxury goods<br />
September 2012<br />
abc<br />
Hugo Boss<br />
Higher relative sales exposure to Europe (<strong>and</strong> mostly through<br />
wholesale) to f<strong>in</strong>ally hit HB from H2 2012<br />
Earn<strong>in</strong>gs momentum at rest after a flurry <strong>of</strong> positive surprises<br />
between 2010 <strong>and</strong> early 2012<br />
Rema<strong>in</strong> Neutral (V), lower target price to EUR84 (from EUR88) on<br />
our lower estimates<br />
Earn<strong>in</strong>gs momentum at rest<br />
Surpris<strong>in</strong>gly strong Europe <strong>in</strong> H1, but negative<br />
<strong>in</strong>flection ahead<br />
Amongst our global luxury coverage, Hugo Boss<br />
(HB) is the second most exposed company to<br />
Europe (60% <strong>of</strong> sales <strong>in</strong> 2011) beh<strong>in</strong>d Tod’s (71%)<br />
<strong>and</strong> we believe that local European customers<br />
account for c80% <strong>of</strong> sales reported <strong>in</strong> Europe for HB<br />
(vs c50% on average for the luxury br<strong>and</strong>s).<br />
Nevertheless, HB organic sales growth <strong>in</strong> Europe<br />
rema<strong>in</strong>ed robust <strong>in</strong> H1 2012 (+12%), with<br />
particularly strong performances <strong>in</strong> key markets <strong>of</strong><br />
Germany, UK <strong>and</strong> France; even Spa<strong>in</strong> sales grew at<br />
a double-digit pace.<br />
However, dur<strong>in</strong>g its Q2 earn<strong>in</strong>gs conference call,<br />
HB stated that order <strong>in</strong>take by European retailers for<br />
deliveries <strong>in</strong> H2 was down y-o-y. Given the weight<br />
<strong>of</strong> wholesale with<strong>in</strong> Europe (c60% <strong>of</strong> sales vs 55%<br />
worldwide), this reversal <strong>of</strong> trends was the ma<strong>in</strong><br />
reason why management guided towards flat<br />
worldwide wholesale revenues at constant FX over<br />
FY12 (imply<strong>in</strong>g a decl<strong>in</strong>e <strong>in</strong> H2 as H1 was up 4%,<br />
with Q3 growth even more negative than Q4 s<strong>in</strong>ce<br />
some <strong>of</strong> the fall/w<strong>in</strong>ter merch<strong>and</strong>ise were shipped<br />
earlier this year – ie. booked <strong>in</strong> Q2).<br />
Underperformance <strong>in</strong> Ch<strong>in</strong>a vs peers<br />
HB organic sales growth <strong>in</strong> Ch<strong>in</strong>a (9% <strong>of</strong> sales <strong>in</strong><br />
2011) slowed from +13% <strong>in</strong> Q1 to +1% <strong>in</strong> Q2, one<br />
<strong>of</strong> the slowest growth rates with<strong>in</strong> our coverage.<br />
Management blamed the overall <strong>in</strong>dustry slowdown<br />
<strong>in</strong> Ch<strong>in</strong>a, translat<strong>in</strong>g mostly <strong>in</strong>to much slower traffic<br />
(conversion <strong>and</strong> average ticket was still up y-o-y).<br />
Whilst we believe it is too early to attribute this<br />
underperformance to HB’s ma<strong>in</strong> product category<br />
(ie. is apparel less resilient than accessories?) or to<br />
potential issues with the br<strong>and</strong> itself <strong>in</strong> Ch<strong>in</strong>a, we<br />
note that this 1% growth rate <strong>in</strong> Q2 was the slowest<br />
with<strong>in</strong> our coverage.<br />
Strategy is still sound<br />
Although deteriorat<strong>in</strong>g economic environment is<br />
f<strong>in</strong>ally tak<strong>in</strong>g its toll, we believe the strategy outl<strong>in</strong>ed<br />
<strong>in</strong> the 2015 plan is still sound, <strong>in</strong> particular:<br />
The retail push, which should result <strong>in</strong> an overproportionate<br />
growth <strong>in</strong> retail sales (which<br />
should reach at least 55% <strong>of</strong> sales <strong>in</strong> 2015e vs<br />
40% <strong>in</strong> 2010), <strong>in</strong>clud<strong>in</strong>g a mid s<strong>in</strong>gle-digit<br />
average comps <strong>in</strong>crease, 50 store open<strong>in</strong>gs per<br />
annum (70 <strong>in</strong> 2012 due to the partnership with<br />
Galeries Lafayette), some franchise buy-backs<br />
<strong>and</strong> conversion <strong>of</strong> corners <strong>in</strong>to shop-<strong>in</strong>-shops.<br />
58
Consumer Br<strong>and</strong>s & Retail<br />
Global luxury goods<br />
September 2012<br />
abc<br />
The search for better efficiencies (notably<br />
thanks to the "DRIVE" programme), notably<br />
<strong>in</strong> terms <strong>of</strong> supply cha<strong>in</strong>, logistics <strong>and</strong><br />
customer service.<br />
We believe the risk is that HB may not deliver (at<br />
least <strong>in</strong> 2012) the targeted over-proportionate<br />
growth <strong>in</strong> sales <strong>in</strong> Asia, which should account for<br />
21% <strong>of</strong> sales <strong>in</strong> 2015e vs 13% <strong>in</strong> 2010.<br />
Less room for positive surprises<br />
Dur<strong>in</strong>g the 2010-11 period, HB has been the best<br />
‘earn<strong>in</strong>gs momentum’ story <strong>in</strong> the sector. This<br />
performance has been rewarded by a significant rerat<strong>in</strong>g<br />
<strong>of</strong> HB, both <strong>in</strong> absolute <strong>and</strong> relative terms.<br />
HB shares rose strongly <strong>in</strong> the first few months <strong>of</strong><br />
2012, reach<strong>in</strong>g a high <strong>of</strong> EUR89.35 on 25 April<br />
on the back <strong>of</strong> several positive catalysts (recovery<br />
from the weakness that followed a 14 November<br />
2011 placement by controll<strong>in</strong>g shareholder<br />
Permira, higher-than-expected 2011 results,<br />
robust 2012 guidance, <strong>and</strong> conversion <strong>of</strong> all<br />
prefer<strong>red</strong> shares <strong>in</strong>to ord<strong>in</strong>ary shares).<br />
True, HB shares lost 16% s<strong>in</strong>ce the high on 25<br />
April, <strong>and</strong> the stock is now trad<strong>in</strong>g at a 2013e PE<br />
<strong>of</strong> 13.8x, which we do not f<strong>in</strong>d dem<strong>and</strong><strong>in</strong>g.<br />
However, we now see limited short-term catalysts<br />
for a further re-rat<strong>in</strong>g <strong>and</strong> less potential for<br />
earn<strong>in</strong>gs upgrades.<br />
Earn<strong>in</strong>gs, valuation <strong>and</strong> risks<br />
EBITDA rose 16% <strong>in</strong> H1 2012, with a 10bp<br />
EBITDA marg<strong>in</strong> <strong>in</strong>crease. As expected, organic<br />
sales growth picked up to 14% <strong>in</strong> Q2 (vs +10% <strong>in</strong><br />
Q1) due to tim<strong>in</strong>g effects affect<strong>in</strong>g wholesale: the<br />
change <strong>in</strong> the tim<strong>in</strong>g <strong>of</strong> collections implied a transfer<br />
<strong>of</strong> sales from Q1 to Q2 as well as from Q3 to Q2.<br />
The FY12 guidance was confirmed <strong>and</strong> a few<br />
elements were specified: organic growth up to 10%<br />
(unchanged), 10-12% EBITDA growth (vs<br />
“EBITDA expected to <strong>in</strong>crease at a slightly higher<br />
rate than sales” previously).<br />
Our 2012 <strong>and</strong> 2013 forecasts are for organic sales<br />
growth <strong>of</strong> 9% <strong>and</strong> 7.5% (vs 10% <strong>and</strong> 9% previously<br />
due to lower sales forecasts <strong>in</strong> Asia <strong>and</strong> Europe) <strong>and</strong><br />
EBITDA marg<strong>in</strong> y-o-y change <strong>of</strong> -10bp (vs +100bp<br />
due to a lack <strong>of</strong> leverage <strong>and</strong> one-<strong>of</strong>f depreciation<br />
charges <strong>in</strong> Q2) <strong>and</strong> +70bp, respectively.<br />
We lower our 2012-14 EPS estimates by 4% <strong>and</strong><br />
therefore decrease our DCF-based target price for<br />
Hugo Boss to EUR84 from EUR88. The<br />
assumptions used <strong>in</strong> our DCF-derived target price<br />
are detailed on page 61. Under our research<br />
model, for stocks with a volatility <strong>in</strong>dicator, the<br />
Neutral b<strong>and</strong> is 10 percentage po<strong>in</strong>ts above <strong>and</strong><br />
below the hurdle rate for Europe ex-UK stocks <strong>of</strong><br />
9.0%. Our target price provides a potential return<br />
<strong>of</strong> 12%, with<strong>in</strong> the Neutral b<strong>and</strong> <strong>of</strong> our model;<br />
therefore, we are reiterat<strong>in</strong>g our Neutral (V)<br />
rat<strong>in</strong>g. Potential return equals the percentage<br />
difference between the current share price <strong>and</strong> the<br />
target price, <strong>in</strong>clud<strong>in</strong>g the forecast dividend yield<br />
when <strong>in</strong>dicated.<br />
Upside specific risks <strong>in</strong>clude cont<strong>in</strong>ued outperformance<br />
on 2015 targets <strong>and</strong> a potential<br />
disposal by Permira (who still owns 66% <strong>of</strong> HB)<br />
<strong>of</strong> a majority stake <strong>in</strong> the company trigger<strong>in</strong>g a<br />
m<strong>in</strong>ority buyout. Downside theoretical risks<br />
<strong>in</strong>clude another partial share placement by<br />
Permira.<br />
Hugo Boss sales breakdown by region – 2011<br />
Americas<br />
22%<br />
Source: Company<br />
Asia<br />
15%<br />
Licenses<br />
2%<br />
Europe<br />
61%<br />
59
Consumer Br<strong>and</strong>s & Retail<br />
Global luxury goods<br />
September 2012<br />
abc<br />
Hugo Boss - Pr<strong>of</strong>it & loss<br />
(EURm) 2006a 2007a 2008a 2009a 2010a 2011a 2012e 2013e 2014e<br />
Sales 1,495.5 1,632.0 1,686.1 1,561.9 1,729.4 2,058.8 2,330.0 2,520.0 2,720.0<br />
% yoy 14.2% 9.1% 3.3% -7.4% 10.7% 19.0% 13.2% 8.2% 7.9%<br />
Gross pr<strong>of</strong>it 854.5 946.4 1,010.6 850.1 1,027.1 1,264.8 1,459.4 1,598.5 1,744.4<br />
Gross pr<strong>of</strong>it marg<strong>in</strong> 57.1% 58.0% 59.9% 54.4% 59.4% 61.4% 62.6% 63.4% 64.1%<br />
Total SG&A -621.1 -658.7 -723.0 -691.7 -762.6 -870.7 -1,008.7 -1,094.2 -1,182.9<br />
% yoy 17.9% 6.1% 9.8% - 10.3% 14.2% 15.8% 8.5% 8.1%<br />
ratio (%) -41.5% -40.4% -42.9% -44.3% -44.1% -42.3% -43.3% -43.4% -43.5%<br />
Adjusted EBITDA 233.4 287.7 287.6 270.2 349.0 469.0 530.0 590.0 654.0<br />
Yoy 13.9% 23.3% -0.0% -6.0% 29.1% 34.4% 13.0% 11.3% 10.8%<br />
adjusted EBITDA marg<strong>in</strong> (%) 15.6% 17.6% 17.1% 17.3% 20.2% 22.8% 22.7% 23.4% 24.0%<br />
One-<strong>of</strong>f adj. EBITDA to EBITDA 0.0 0.0 -36.0 -42.7 -13.6 -1.5 0.0 0.0 0.0<br />
EBITDA 233.4 287.7 251.6 227.5 335.4 467.5 530.0 590.0 654.0<br />
EBITDA marg<strong>in</strong> (%) 15.6% 17.6% 14.9% 14.6% 19.4% 22.7% 22.7% 23.4% 24.0%<br />
Amortization & Depreciation -49.1 -67.5 -60.9 -69.1 -70.9 -73.4 -79.3 -85.6 -92.5<br />
EBIT 184.4 220.2 190.7 158.4 264.5 394.1 450.7 504.3 561.5<br />
% yoy 13.2% 19.4% -13.4% -16.9% 67.0% 49.0% 14.4% 11.9% 11.3%<br />
EBIT marg<strong>in</strong> (%) 12.3% 13.5% 11.3% 10.1% 15.3% 19.1% 19.3% 20.0% 20.6%<br />
Net f<strong>in</strong>ancial Result -4.5 -7.9 -41.7 -21.8 -14.8 -11.7 -11.0 -2.0 3.0<br />
EBT 179.9 212.3 149.0 136.6 249.7 382.4 439.7 502.3 564.5<br />
Income tax expenses -51.2 -58.3 -36.4 -32.7 -59.9 -91.4 -105.5 -120.6 -135.5<br />
Tax rate (%) -28.5% -27.5% -24.4% -23.9% -24.0% -23.9% -24.0% -24.0% -24.0%<br />
Net pr<strong>of</strong>it 128.7 154.0 112.6 104.0 189.8 291.0 334.2 381.8 429.0<br />
M<strong>in</strong>orities 0.0 -0.1 -0.1 -0.1 -3.3 -6.5 -7.0 -8.0 -9.0<br />
Net pr<strong>of</strong>it after m<strong>in</strong>orities 128.6 153.9 112.5 103.9 186.4 284.5 327.2 373.8 420.0<br />
EPS prefer<strong>red</strong> 1.86 2.24 1.63 1.51 2.70 4.13 4.74 5.42 6.09<br />
% yoy 20.1% 20.4% -27.2% -7.4% 79.0% 52.7% 15.0% 14.2% 12.4%<br />
Number <strong>of</strong> shares 69.1 68.7 69.0 68.8 69.0 69.0 69.0 69.0 69.0<br />
Sources: Company data, HSBC estimates<br />
Hugo Boss - Split <strong>of</strong> sales<br />
(EURm) 2006 2007 2008 2009 2010 2011 2012e 2013e 2014e<br />
By Region<br />
Europe 1,029 1,124 1,170 1,041 1,073 1,245 1,360 1,428 1,499<br />
America 274 299 307 312 381 455 550 614 676<br />
Asia 150 161 162 165 230 309 363 416 478<br />
Licenses 43 49 47 44 45 49 57 62 67<br />
Total 1,496 1,632 1,686 1,562 1,729 2,059 2,330 2,520 2,720<br />
Europe 69% 69% 69% 67% 62% 60% 58% 57% 55%<br />
America 18% 18% 18% 20% 22% 22% 24% 24% 25%<br />
Asia 10% 10% 10% 11% 13% 15% 16% 17% 18%<br />
Licenses 3% 3% 3% 3% 3% 2% 2% 2% 2%<br />
Total 100% 100% 100% 100% 100% 100% 100% 100% 100%<br />
By Distribution Network<br />
Wholesale na na 1,183 1,008 993 1,085 1,118 1,144 1,179<br />
Retail na na 456 510 691 924 1,156 1,313 1,474<br />
Licenses na na 47 44 45 49 57 62 67<br />
Total na na 1,686 1,562 1,729 2,059 2,330 2,520 2,720<br />
Wholesale na na 70% 65% 57% 53% 48% 45% 43%<br />
Retail na na 27% 33% 40% 45% 50% 52% 54%<br />
Licenses na na 3% 3% 3% 2% 2% 2% 2%<br />
Total na na 100% 100% 100% 100% 100% 100% 100%<br />
Sources: Company report, HSBC estimates<br />
60
1<br />
2<br />
.<br />
0<br />
Consumer Br<strong>and</strong>s & Retail<br />
Global luxury goods<br />
September 2012<br />
abc<br />
F<strong>in</strong>ancials & valuation: Hugo Boss<br />
F<strong>in</strong>ancial statements<br />
Year to 12/2011a 12/2012e 12/2013e 12/2014e<br />
Pr<strong>of</strong>it & loss summary (EURm)<br />
Revenue 2,059 2,330 2,520 2,720<br />
EBITDA 468 530 590 654<br />
Depreciation & amortisation -73 -79 -86 -92<br />
Operat<strong>in</strong>g pr<strong>of</strong>it/EBIT 394 451 504 561<br />
Net <strong>in</strong>terest -12 -11 -2 3<br />
PBT 382 440 502 564<br />
HSBC PBT 382 440 502 564<br />
Taxation -91 -106 -121 -135<br />
Net pr<strong>of</strong>it 285 327 374 420<br />
HSBC net pr<strong>of</strong>it 285 327 374 420<br />
Cash flow summary (EURm)<br />
Cash flow from operations 305 356 428 480<br />
Capex -108 -120 -120 -120<br />
Cash flow from <strong>in</strong>vestment -258 -120 -120 -120<br />
Dividends -140 -199 -229 -262<br />
Change <strong>in</strong> net debt -53 -57 -84 -104<br />
FCF equity 198 236 308 360<br />
Balance sheet summary (EURm)<br />
Intangible fixed assets 141 141 141 141<br />
Tangible fixed assets 286 326 361 388<br />
Current assets 932 1,059 1,194 1,352<br />
Cash & others 200 258 341 446<br />
Total assets 1,449 1,616 1,785 1,971<br />
Operat<strong>in</strong>g liabilities 321 332 344 356<br />
Gross debt 389 389 389 389<br />
Net debt 147 90 6 -98<br />
Shareholders funds 499 634 787 954<br />
Invested capital 838 936 1,010 1,080<br />
Ratio, growth <strong>and</strong> per share analysis<br />
Year to 12/2011a 12/2012e 12/2013e 12/2014e<br />
Y-o-y % change<br />
Revenue 19.0 13.2 8.2 7.9<br />
EBITDA 39.4 13.4 11.3 10.8<br />
Operat<strong>in</strong>g pr<strong>of</strong>it 49.0 14.4 11.9 11.3<br />
PBT 53.1 15.0 14.2 12.4<br />
HSBC EPS 52.7 15.0 14.2 12.4<br />
Ratios (%)<br />
Revenue/IC (x) 2.6 2.6 2.6 2.6<br />
ROIC 38.4 38.6 39.4 40.8<br />
ROE 67.5 57.7 52.6 48.2<br />
ROA 20.8 21.8 22.4 22.8<br />
EBITDA marg<strong>in</strong> 22.7 22.7 23.4 24.0<br />
Operat<strong>in</strong>g pr<strong>of</strong>it marg<strong>in</strong> 19.1 19.3 20.0 20.6<br />
EBITDA/net <strong>in</strong>terest (x) 40.0 48.2 295.0<br />
Net debt/equity 28.1 13.6 0.8 -10.0<br />
Net debt/EBITDA (x) 0.3 0.2 0.0 -0.1<br />
CF from operations/net debt 207.0 395.6 6790.4<br />
Per share data (EUR)<br />
EPS Rep (fully diluted) 4.13 4.74 5.42 6.09<br />
HSBC EPS (fully diluted) 4.13 4.74 5.42 6.09<br />
DPS 2.89 3.32 3.79 4.26<br />
Book value 7.24 9.20 11.41 13.84<br />
DCF analysis<br />
HSBC assumptions<br />
DCF, compris<strong>in</strong>g<br />
Neutral (V)<br />
Risk-free rate (%) 3.00 EBIT growth 2011-21e CAGR (%) 9.2<br />
Equity premium (%) 6.00 EBIT growth 2021-41e CAGR (%) 4.2<br />
Sector beta 1.20 Fade period 2041-47e<br />
Specific beta 1.00 WACC (%) 10.02<br />
Sensitivity <strong>and</strong> valuation range (EUR/share)<br />
Cost <strong>of</strong> capital vs fade period 4 years 8 years 12 years<br />
9.0% 94 96 98<br />
9.5% 88 90 91<br />
10.0% 82 84 85<br />
10.5% 77 79 80<br />
11.0% 73 74 75<br />
Valuation data<br />
Year to 12/2011a 12/2012e 12/2013e 12/2014e<br />
EV/sales 2.6 2.3 2.1 1.9<br />
EV/EBITDA 11.7 10.2 9.0 8.0<br />
EV/IC 6.5 5.8 5.3 4.8<br />
PE* 18.2 15.8 13.8 12.3<br />
P/Book value 10.4 8.2 6.6 5.4<br />
FCF yield (%) 3.7 4.4 5.8 6.8<br />
Dividend yield (%) 3.9 4.4 5.1 5.7<br />
Note: * = Based on HSBC EPS (fully diluted)<br />
Issuer <strong>in</strong>formation<br />
Share price (EUR)74.99 Target price (EUR)84.00<br />
Reuters (Equity) BOSSn.DE Bloomberg (Equity) BOSS GR<br />
Market cap (USDm) 6,607 Market cap (EURm) 5,279<br />
Free float (%) 53 Enterprise value (EURm) 5394<br />
Country Germany Sector Textiles, Apparel & <strong>Luxury</strong><br />
Goods<br />
Anto<strong>in</strong>e Belge Contact 331 5652 4347<br />
Erwan Rambourg Contact 852 2996 6572<br />
Analyst Sophie Dargnies Contact 331 5652 4348<br />
Price relative<br />
97<br />
97<br />
87<br />
87<br />
77<br />
77<br />
67<br />
67<br />
57<br />
57<br />
47<br />
47<br />
37<br />
37<br />
27<br />
27<br />
Aug-10 Feb-11 Aug-11 Feb-12 Aug-12<br />
Hugo Boss Rel to DAX-100<br />
Source: HSBC<br />
Note: price at close <strong>of</strong> 27 Aug 2012<br />
61
Consumer Br<strong>and</strong>s & Retail<br />
Global luxury goods<br />
September 2012<br />
abc<br />
Luxottica<br />
North America (c60% <strong>of</strong> sales) trends still robust <strong>and</strong> weaker EUR<br />
is a booster<br />
Self-help (Coach <strong>and</strong> Armani licences, M&A, retail marg<strong>in</strong><br />
recovery) should benefit with best-<strong>in</strong>-class operat<strong>in</strong>g leverage<br />
Rema<strong>in</strong> Neutral, <strong>in</strong>crease DCF-based target price to EUR30.50<br />
(from EUR28.50) on higher estimates<br />
Self-help <strong>and</strong> best-<strong>in</strong>-class<br />
operat<strong>in</strong>g leverage<br />
North America trends still robust<br />
Still account<strong>in</strong>g for c60% <strong>of</strong> Luxottica’s sales, North<br />
America (NA) cont<strong>in</strong>ues to be the company’s ma<strong>in</strong><br />
growth driver. Overall, NA sales <strong>in</strong>creased 8% <strong>in</strong><br />
USD <strong>in</strong> H1 (compa<strong>red</strong> to 9% <strong>in</strong> Q1).<br />
Wholesale sales rose 18% <strong>in</strong> Q1 <strong>and</strong> 21% <strong>in</strong> Q2<br />
(aga<strong>in</strong>st a 15-18% target for FY12), boosted by the<br />
successful launch <strong>of</strong> Coach, a further <strong>in</strong>crease <strong>in</strong><br />
dem<strong>and</strong> for luxury, Oakley <strong>and</strong> Ray-Ban “still on<br />
fire”.<br />
Retail NA was quite stable <strong>in</strong> Q2 compa<strong>red</strong> to Q1<br />
(comps up 5.6% vs +6%), even though the key cha<strong>in</strong><br />
LensCrafters slowed to +1.1% from +4.9% <strong>in</strong> Q1,<br />
however, we believe that Q3 so far has been trend<strong>in</strong>g<br />
up 2-3%, which would support management view<br />
that the weakness was l<strong>in</strong>ked to the SAP<br />
implementation. Sunglass Hut NA comps rema<strong>in</strong>ed<br />
strong (+11.7% <strong>in</strong> Q2 after +10.3% <strong>in</strong> Q1).<br />
We note however that the Retail NA comps are<br />
artificially boosted by the exclusion (as from Q2) <strong>of</strong><br />
Pearle Vision, for which the bus<strong>in</strong>ess proposition is<br />
mov<strong>in</strong>g away from runn<strong>in</strong>g corporate stores to a<br />
franchis<strong>in</strong>g model.<br />
Weaker EUR is a booster<br />
Luxottica is a strong beneficiary <strong>of</strong> the weaker<br />
EUR. Accord<strong>in</strong>g to the company, each 1%<br />
strengthen<strong>in</strong>g <strong>of</strong> the USD aga<strong>in</strong>st the EUR has a<br />
+0.8%/0.9% impact on EPS.<br />
A lot <strong>of</strong> self-help expected <strong>in</strong> 2012 <strong>and</strong> 2013<br />
We like Luxottica because it should benefit from a lot<br />
<strong>of</strong> self-help <strong>in</strong> 2012 <strong>and</strong> 2013.<br />
The Coach licence, which we estimate will<br />
contribute EUR50m <strong>in</strong> sales <strong>in</strong> year 1 (vs our<br />
previous forecast <strong>of</strong> EUR40m), started to impact<br />
the bus<strong>in</strong>ess <strong>in</strong> January 2012.<br />
As from 2013, the Armani licence (won from<br />
competitor Safilo) should generate EUR150m <strong>in</strong> sales<br />
<strong>in</strong> year 1 with the potential, <strong>in</strong> our view, to reach<br />
EUR200m <strong>in</strong> year 3.<br />
New licences create significant value: not only<br />
can they be conside<strong>red</strong> the equivalent <strong>of</strong> an<br />
acquisition at zero cost, but they also add to the<br />
size <strong>of</strong> the Wholesale division (leverag<strong>in</strong>g<br />
exist<strong>in</strong>g fixed distribution costs <strong>and</strong> re<strong>in</strong>forc<strong>in</strong>g<br />
Luxottica’s position as the supplier <strong>of</strong> choice for<br />
eyewear retailers). Before add<strong>in</strong>g Coach <strong>and</strong><br />
Armani to its portfolio, Luxottica was already by<br />
far the leader <strong>in</strong> eyewear licens<strong>in</strong>g with a global<br />
62
Consumer Br<strong>and</strong>s & Retail<br />
Global luxury goods<br />
September 2012<br />
abc<br />
market share <strong>of</strong> more than 40%. We now estimate<br />
that share at more than 50%. Luxottica also owns<br />
Ray-Ban <strong>and</strong> Oakley, the two star ‘house’ br<strong>and</strong>s<br />
<strong>of</strong> the <strong>in</strong>dustry.<br />
In 2012 <strong>and</strong> 2013, Luxottica should start to<br />
benefit from its recent acquisitions (Tecnol <strong>in</strong> the<br />
wholesale division <strong>and</strong> emerg<strong>in</strong>g markets (EM)<br />
eyewear cha<strong>in</strong>s <strong>in</strong> the retail division), <strong>and</strong> the<br />
company has made it clear that other acquisitions<br />
will follow. Although we have always expressed<br />
caution on M&A <strong>in</strong> the luxury <strong>in</strong>dustry, Luxottica<br />
has developed a strong track record <strong>in</strong> creat<strong>in</strong>g<br />
value via acquisitions.<br />
In the short term, however, the <strong>in</strong>tegration <strong>of</strong><br />
Tecnol is generat<strong>in</strong>g one-<strong>of</strong>f restructur<strong>in</strong>g charges<br />
which would penalise Wholesale marg<strong>in</strong>s.<br />
In 2012, the Retail EBIT should benefit from the<br />
very favourable 2011 basis <strong>of</strong> comparison. Last<br />
year, EBIT marg<strong>in</strong> decl<strong>in</strong>ed 30bp to 11.6%, but<br />
would have been 13.9% at constant FX exclud<strong>in</strong>g<br />
one-<strong>of</strong>fs (notably due to the Australian bus<strong>in</strong>ess).<br />
Even assum<strong>in</strong>g cont<strong>in</strong>ued <strong>in</strong>vestments <strong>in</strong> EM <strong>and</strong><br />
tak<strong>in</strong>g <strong>in</strong>to account the EUR22m one-<strong>of</strong>f charge<br />
l<strong>in</strong>ked to the reorganisation the Australian cha<strong>in</strong><br />
OPSM <strong>in</strong> 2012, we forecast improvement <strong>of</strong> 60bp<br />
<strong>in</strong> 2012 <strong>and</strong> 130bp <strong>in</strong> 2013 based on the current<br />
FX (EUR/USD=1.25) <strong>and</strong> the confirmation <strong>of</strong><br />
improv<strong>in</strong>g trends <strong>in</strong> Australia/New Zeal<strong>and</strong>.<br />
Aggressive yet realistic 2012 target<br />
On 28 February, Luxottica gave an aggressive<br />
2012 target, but it was realistic <strong>in</strong> our view: 30%<br />
sales growth <strong>in</strong> EM, 5-7% retail comps <strong>and</strong> 15%<br />
wholesale growth <strong>in</strong> North America, <strong>and</strong> 4-6%<br />
wholesale growth <strong>in</strong> Western Europe. All <strong>in</strong> all,<br />
we estimate these regional trends should translate<br />
<strong>in</strong>to 9-10% top-l<strong>in</strong>e growth. In addition,<br />
Luxottica’s leverage ‘rule <strong>of</strong> thumb’ <strong>of</strong> c2x (ie<br />
EBIT growth/sales growth), which was met <strong>in</strong><br />
2011, was reiterated for 2012 <strong>and</strong> confirmed when<br />
the company reported H1 2012.<br />
Earn<strong>in</strong>gs, valuation <strong>and</strong> risks<br />
Luxottica posted a 20% <strong>in</strong>crease <strong>in</strong> EBIT <strong>in</strong> Q2<br />
2012, ie. an 80bp EBIT marg<strong>in</strong> <strong>in</strong>crease to 17.7%<br />
Reported sales were up 15.2% <strong>in</strong> Q2 (+5.1%<br />
exclud<strong>in</strong>g FX <strong>and</strong> acquisition impacts, compa<strong>red</strong><br />
to +8.1% <strong>in</strong> Q1). Worldwide Retail comps slightly<br />
slowed (from 6.5% <strong>in</strong> Q1 to 5.1% <strong>in</strong> Q2) on the<br />
back <strong>of</strong> the above-mentioned weakness at<br />
LensCrafters, store closures <strong>in</strong> Australia <strong>and</strong><br />
weaker Western Europe wholesale sales (down<br />
4% <strong>in</strong> Q1 vs +6% <strong>in</strong> Q2).<br />
We forecast worldwide Retail comps <strong>of</strong> 5.5% for<br />
2012e (vs 5.5% <strong>in</strong> 2011), to which we add a 2.2%<br />
contribution from acquisitions <strong>and</strong> an 8% FX<br />
impact, <strong>and</strong> deduct a -0.5% contribution from new<br />
stores , lead<strong>in</strong>g to a 15.2% reported sales growth<br />
<strong>in</strong> 2012e.<br />
We forecast Wholesale sales to slow from 11.2%<br />
<strong>in</strong> 2011 at constant FX to 9% <strong>in</strong> 2012 (<strong>in</strong>clud<strong>in</strong>g<br />
Coach). Reported sales growth should amount to<br />
15.7% as Tecnol <strong>and</strong> FX impact should add 2.7%<br />
<strong>and</strong> 4%, respectively.<br />
For this division, which has historically shown a<br />
high operat<strong>in</strong>g leverage, we forecast 90bp EBIT<br />
marg<strong>in</strong> enhancement <strong>in</strong> 2012 (after 80bp <strong>in</strong> 2011)<br />
to a hefty 22.4%.<br />
At the group level, Luxottica sales <strong>and</strong> EBIT<br />
should thus grow at a respective 15% <strong>and</strong> 23% <strong>in</strong><br />
2012, with an operat<strong>in</strong>g leverage <strong>of</strong> 1.5x, amongst<br />
the best-<strong>in</strong>-class with Ferragamo, PPR <strong>and</strong> Prada.<br />
We have lowe<strong>red</strong> our 2012 EPS estimate due to<br />
higher <strong>in</strong>terest charges, but raised our 2013-14<br />
EPS estimates by 3% <strong>and</strong> 2%, respectively, due to<br />
the lower EUR.<br />
63
Consumer Br<strong>and</strong>s & Retail<br />
Global luxury goods<br />
September 2012<br />
abc<br />
We <strong>in</strong>crease our DCF-based target price to<br />
EUR30.50 from EUR28.50 on the back <strong>of</strong> our<br />
higher estimates. The assumptions used <strong>in</strong> our<br />
target price are detailed on page 65. Under our<br />
research model, for stocks without a volatility<br />
<strong>in</strong>dicator, the Neutral b<strong>and</strong> is 5ppts above <strong>and</strong><br />
below the hurdle rate for Europe ex-UK stocks <strong>of</strong><br />
9.0%. Our new target price implies a 5.5%<br />
potential return; with<strong>in</strong> the Neutral b<strong>and</strong> <strong>of</strong> our<br />
model; hence we reiterate our Neutral rat<strong>in</strong>g.<br />
Potential return equals the percentage difference<br />
between the current share price <strong>and</strong> the target<br />
price, <strong>in</strong>clud<strong>in</strong>g the forecast dividend yield when<br />
<strong>in</strong>dicated.<br />
Upside risks to our rat<strong>in</strong>g <strong>in</strong>clude a better-thanexpected<br />
resilience <strong>of</strong> the group’s North American<br />
bus<strong>in</strong>ess, a faster-than-expected development <strong>in</strong> EM,<br />
a USD/EUR strengthen<strong>in</strong>g, value-enhanc<strong>in</strong>g<br />
acquisitions <strong>and</strong> new license deals. Downside risks<br />
<strong>in</strong>clude poor execution <strong>in</strong> <strong>in</strong>tegrat<strong>in</strong>g new deals <strong>and</strong><br />
non-renewal <strong>of</strong> licence contracts.<br />
Luxottica is trad<strong>in</strong>g at 21.9x 2012e <strong>and</strong> 18.2x<br />
2013e PE (note that our EPS exclude trademark<br />
amortisation), imply<strong>in</strong>g a c20% premium to its<br />
peers (compa<strong>red</strong> to a c10% historical level).<br />
Luxottica P&L summary<br />
EURm 2005a 2006a 2007a 2008a** 2009e 2010a 2011a 2012e 2013e 2014e 06 vs<br />
05<br />
07 vs<br />
06<br />
08 vs<br />
07<br />
09 vs 10 evs 11e vs<br />
08 09 10e<br />
12e vs 13e vs<br />
11e 12e<br />
14e vs<br />
13e<br />
Wholesale 1,311 1,715 1,993 2,092 1,955 2,236 2,456 2,841 3,189 3,412 31% 16% 5% -7% 14% 10% 16% 12% 7%<br />
Retail 3,062 3,294 3,234 3,109 3,139 3,562 3,766 4,339 4,654 4,934 8% -2% -4% 1% 13% 6% 15% 7% 6%<br />
Inter-Segments -238 -333 -348 40% 4% -100%<br />
Oakley 88<br />
Total sales 4,135 4,676 4,967 5,202 5,094 5,798 6,222 7,180 7,843 8,346 13% 6% 5% -2% 14% 7% 15% 9% 6%<br />
Wholesale 304 446 528 440 356 462 529 637 738 810 46% 18% -17% -19% 30% 15% 20% 16% 10%<br />
Retail 355 431 362 431 367 424 437 531 627 683 21% -16% 19% -15% 15% 3% 22% 18% 9%<br />
Inter-Segments -78 -121 -60 -121 -140 -174 -159 -178 -195 -214 55% -50% 101% 16% 25% -9% 12% 10% 10%<br />
Oakley EBIT 3<br />
Total EBIT 581 756 833 750 583 712 807 990 1,170 1,280 30% 10% -10% -22% 22% 13% 23% 18% 9%<br />
Wholesale 23.2% 26.0% 26.5% 21.0% 18.2% 20.7% 21.5% 22.4% 23.1% 23.8%<br />
Retail 11.6% 13.1% 11.2% 13.8% 11.7% 11.9% 11.6% 12.2% 13.5% 13.9%<br />
TOTAL EBIT marg<strong>in</strong> 14.1% 16.2% 16.8% 14.4% 11.4% 12.3% 13.0% 13.8% 14.9% 15.3%<br />
Reported diluted EPS 0.73 0.94 1.07 0.83 0.69 0.83 0.98 1.21 1.48 1.65 29% 14% -23% -17% 21% 18% 24% 22% 12%<br />
HSBC diluted EPS* 0.73 0.94 1.10 0.96 0.80 0.99 1.09 1.32 1.59 1.76 29% 17% -13% -17% 23% 10% 21% 20% 11%<br />
Retail comps (worldwide) 5.5% 6.7% 1.2% -5.4% -4.2% 4.5% 5.5% 5.5% 4.0% 4.0%<br />
* Exclud<strong>in</strong>g exceptional items <strong>and</strong> trademark amortisation ** change <strong>in</strong> sales & EBIT breakdown methodology<br />
Source: Company data, HSBC estimates<br />
64
5<br />
.<br />
5<br />
Consumer Br<strong>and</strong>s & Retail<br />
Global luxury goods<br />
September 2012<br />
abc<br />
F<strong>in</strong>ancials & valuation: Luxottica<br />
F<strong>in</strong>ancial statements<br />
Year to 12/2011a 12/2012e 12/2013e 12/2014e<br />
Pr<strong>of</strong>it & loss summary (EURm)<br />
Revenue 6,222 7,180 7,843 8,346<br />
EBITDA 1,131 1,330 1,527 1,655<br />
Depreciation & amortisation -324 -340 -357 -375<br />
Operat<strong>in</strong>g pr<strong>of</strong>it/EBIT 807 990 1,170 1,280<br />
Net <strong>in</strong>terest -109 -120 -107 -94<br />
PBT 695 870 1,063 1,186<br />
HSBC PBT 695 870 1,063 1,186<br />
Taxation -237 -300 -367 -409<br />
Net pr<strong>of</strong>it 452 564 690 769<br />
HSBC net pr<strong>of</strong>it 504 616 742 821<br />
Cash flow summary (EURm)<br />
Cash flow from operations 811 836 974 1,088<br />
Capex -307 -325 -345 -366<br />
Cash flow from <strong>in</strong>vestment -483 -433 -356 -377<br />
Dividends -202 -226 -281 -343<br />
Change <strong>in</strong> net debt -80 -190 -350 -381<br />
FCF equity 491 510 629 723<br />
Balance sheet summary (EURm)<br />
Intangible fixed assets 4,441 4,441 4,441 4,441<br />
Tangible fixed assets 1,694 1,788 1,787 1,788<br />
Current assets 2,269 2,398 2,524 2,637<br />
Cash & others 905 905 905 905<br />
Total assets 8,644 8,867 8,991 9,106<br />
Operat<strong>in</strong>g liabilities 1,626 1,700 1,766 1,835<br />
Gross debt 2,937 2,747 2,397 2,016<br />
Net debt 2,032 1,842 1,492 1,111<br />
Shareholders funds 3,625 3,964 4,372 4,798<br />
Invested capital 5,873 6,022 6,081 6,126<br />
Ratio, growth <strong>and</strong> per share analysis<br />
Year to 12/2011a 12/2012e 12/2013e 12/2014e<br />
Y-o-y % change<br />
Revenue 7.3 15.4 9.2 6.4<br />
EBITDA 9.4 17.6 14.8 8.4<br />
Operat<strong>in</strong>g pr<strong>of</strong>it 13.3 22.7 18.2 9.4<br />
PBT 14.8 25.2 22.2 11.6<br />
HSBC EPS 10.4 21.5 20.4 10.7<br />
Ratios (%)<br />
Revenue/IC (x) 1.1 1.2 1.3 1.4<br />
ROIC 9.3 10.9 12.7 13.7<br />
ROE 14.6 16.2 17.8 17.9<br />
ROA 6.5 7.4 8.6 9.3<br />
EBITDA marg<strong>in</strong> 18.2 18.5 19.5 19.8<br />
Operat<strong>in</strong>g pr<strong>of</strong>it marg<strong>in</strong> 13.0 13.8 14.9 15.3<br />
EBITDA/net <strong>in</strong>terest (x) 10.4 11.1 14.3 17.7<br />
Net debt/equity 56.0 46.5 34.1 23.2<br />
Net debt/EBITDA (x) 1.8 1.4 1.0 0.7<br />
CF from operations/net debt 39.9 45.4 65.3 98.0<br />
Per share data (EUR)<br />
EPS Rep (fully diluted) 0.98 1.21 1.48 1.65<br />
HSBC EPS (fully diluted) 1.09 1.32 1.59 1.76<br />
DPS 0.49 0.61 0.74 0.83<br />
Book value 7.92 8.66 9.56 10.49<br />
DCF analysis<br />
HSBC assumptions<br />
DCF, compris<strong>in</strong>g<br />
Neutral<br />
Risk-free rate (%) 3.00 EBIT growth 2011-21e CAGR (%) 10.1<br />
Equity premium (%) 6.00 EBIT growth 2021-41e CAGR (%) 4.3<br />
Sector beta 1.10 Fade period 2041-47e<br />
Specific beta 0.90 WACC (%) 8.25<br />
Sensitivity <strong>and</strong> valuation range (EUR/share)<br />
Cost <strong>of</strong> capital vs fade period 4 years 8 years 12 years<br />
7.25% 35.6 36.7 37.3<br />
7.75% 32.5 33.4 34.0<br />
8.25% 29.8 30.5 31.1<br />
8.75% 27.3 27.9 28.6<br />
9.25% 25.2 25.7 26.3<br />
Valuation data<br />
Year to 12/2011a 12/2012e 12/2013e 12/2014e<br />
EV/sales 2.5 2.1 1.9 1.8<br />
EV/EBITDA 13.8 11.6 9.9 8.9<br />
EV/IC 2.7 2.6 2.5 2.4<br />
PE* 26.6 21.9 18.2 16.4<br />
P/Book value 3.6 3.3 3.0 2.8<br />
FCF yield (%) 3.6 3.8 4.6 5.3<br />
Dividend yield (%) 1.7 2.1 2.6 2.9<br />
Note: * = Based on HSBC EPS (fully diluted)<br />
Issuer <strong>in</strong>formation<br />
Share price (EUR)28.91 Target price (EUR)30.50<br />
Reuters (Equity) LUX.MI Bloomberg (Equity) LUX IM<br />
Market cap (USDm) 17,006 Market cap (EURm) 13,587<br />
Free float (%) 25 Enterprise value (EURm) 15420<br />
Country Italy Sector Textiles, Apparel & <strong>Luxury</strong><br />
Goods<br />
Analyst Anto<strong>in</strong>e Belge Contact 33 1 5652 4347<br />
Erwan Rambourg Contact 852 2996 6572<br />
Sophie Dargnies Contact 331 5652 4348<br />
Price relative<br />
45<br />
40<br />
35<br />
30<br />
25<br />
20<br />
15<br />
15<br />
Aug-10 Feb-11 Aug-11 Feb-12 Aug-12<br />
Luxottica Rel to BCI ALL-SHARE INDEX<br />
Source: HSBC<br />
Note: price at close <strong>of</strong> 27 Aug 2012<br />
45<br />
40<br />
35<br />
30<br />
25<br />
20<br />
65
Consumer Br<strong>and</strong>s & Retail<br />
Global luxury goods<br />
September 2012<br />
abc<br />
LVMH<br />
Whilst Cognac <strong>and</strong> DFS should cont<strong>in</strong>ue to surprise positively, LV’s<br />
growth is the ma<strong>in</strong> victim <strong>of</strong> our ‘first-mover disadvantage’ theme<br />
After the share’s recent good run, we see limited (8.6%) potential<br />
return to our TP; we prefer <strong>in</strong>vest<strong>in</strong>g <strong>in</strong> Dior (OW, TP EUR140),<br />
LVMH’s parent company, which <strong>of</strong>fer a 19.7% potential return<br />
Downgrade to Neutral from Overweight; target price <strong>of</strong> EUR145<br />
rema<strong>in</strong>s unchanged<br />
Downgrade to Neutral<br />
LV the ma<strong>in</strong> victim <strong>of</strong> our ‘first-mover<br />
disadvantage’ theme<br />
LVMH does not disclose the specific sales <strong>and</strong> EBIT<br />
performance <strong>of</strong> the LV br<strong>and</strong>, its ma<strong>in</strong> pr<strong>of</strong>it<br />
contributor. But dur<strong>in</strong>g the H1 2012 conference call,<br />
management said that LV’s organic sales growth <strong>in</strong><br />
Q2 was slightly below the 8% recorded by the<br />
Fashion & Leather division as a whole <strong>and</strong> that its<br />
EBIT marg<strong>in</strong> decl<strong>in</strong>ed <strong>in</strong> H1 (with the decl<strong>in</strong>e at the<br />
divisional level be<strong>in</strong>g 220bp). We estimate that<br />
organic sales growth was 6% at LV <strong>in</strong> Q2, one <strong>of</strong> the<br />
lowest with<strong>in</strong> our coverage.<br />
In our previous reports, we wrote that achiev<strong>in</strong>g the<br />
8% organic growth we were forecast<strong>in</strong>g for 2012-14<br />
(even underperform<strong>in</strong>g the <strong>in</strong>dustry), would be<br />
another considerable achievement as it would<br />
represent an annual <strong>in</strong>crease <strong>of</strong> EUR500m (ie. the<br />
size <strong>of</strong> a br<strong>and</strong> like YSL). We now forecast organic<br />
growth <strong>of</strong> 7% <strong>in</strong> 2012-14.<br />
Beyond this sheer size effect (ie. it is more difficult<br />
for a EUR6.5bn sales br<strong>and</strong> to grow), we believe LV<br />
is also the ma<strong>in</strong> victim <strong>of</strong> our ‘first-mover<br />
disadvantage’ theme <strong>in</strong> Asia. Whilst LV benefited<br />
from be<strong>in</strong>g a pioneer <strong>in</strong> Ch<strong>in</strong>a up until 2011, smaller<br />
br<strong>and</strong>s are now grow<strong>in</strong>g faster due to the <strong>in</strong>creas<strong>in</strong>g<br />
sophistication <strong>of</strong> the Ch<strong>in</strong>ese consumers.<br />
LVMH also owns smaller br<strong>and</strong>s – notably Fendi,<br />
Cél<strong>in</strong>e, Loewe <strong>and</strong> Marc Jacobs – which are<br />
grow<strong>in</strong>g at a faster rate than LV, but are too small<br />
relative to the size <strong>of</strong> LV <strong>and</strong> other group assets to<br />
really matter <strong>in</strong> terms <strong>of</strong> numbers.<br />
We also note that H2 2012 should face an<br />
unfavourable basis <strong>of</strong> comparison as organic sales<br />
growth was 18% <strong>in</strong> Fashion & Leather <strong>in</strong> both Q3<br />
<strong>and</strong> Q4 <strong>of</strong> last year (vs +14% <strong>in</strong> H1 2011).<br />
From a marg<strong>in</strong> st<strong>and</strong>po<strong>in</strong>t, we expect a lower rate <strong>of</strong><br />
decl<strong>in</strong>e <strong>in</strong> H2 y-o-y, compa<strong>red</strong> to H1 y-o-y as costs<br />
have been front-loaded <strong>in</strong> H1 whilst H2 should see a<br />
stronger pipel<strong>in</strong>e <strong>of</strong> product launches (notably the<br />
collection <strong>in</strong> collaboration with the Japanese artist<br />
<strong>and</strong> designer Kusama). Nevertheless, we forecast a<br />
130bp decl<strong>in</strong>e <strong>in</strong> the Fashion & Leather EBIT<br />
marg<strong>in</strong> over the FY2012, s<strong>in</strong>ce <strong>in</strong>vestments beh<strong>in</strong>d<br />
Berluti, the negative impact from the takeover <strong>of</strong> the<br />
jeans license at Donna Karan or the streaml<strong>in</strong><strong>in</strong>g <strong>of</strong><br />
Fendi wholesale distribution will cont<strong>in</strong>ue to weigh<br />
on marg<strong>in</strong>s.<br />
66
Consumer Br<strong>and</strong>s & Retail<br />
Global luxury goods<br />
September 2012<br />
abc<br />
Cognac <strong>and</strong> DFS likely to cont<strong>in</strong>ue to surprise<br />
positively<br />
Cognac: Beg<strong>in</strong>n<strong>in</strong>g <strong>of</strong> 2012, management was<br />
cautious on Cognac volume growth due to<br />
anticipated shortage <strong>of</strong> <strong>in</strong>ventories <strong>of</strong> older qualities<br />
<strong>of</strong> eau-de-vie. But this caution proved unfounded:<br />
organic growth was 18% <strong>in</strong> H1 2012 (volumes +8%<br />
<strong>and</strong> price/mix +10%) <strong>and</strong> management sounded<br />
confident about H2 dur<strong>in</strong>g the H1 results conference<br />
call, even though the magnitude <strong>of</strong> price mix effects<br />
should be lower. We forecast 11% organic sales<br />
growth <strong>in</strong> H2 (volumes +6% <strong>and</strong> price/mix +5%).<br />
DFS: This bus<strong>in</strong>ess cont<strong>in</strong>ues to be the star<br />
performer as an <strong>in</strong>creas<strong>in</strong>g share <strong>of</strong> its sales (c40%<br />
<strong>in</strong> 2011) are now generated by ma<strong>in</strong>l<strong>and</strong> Ch<strong>in</strong>ese<br />
tourists, leverag<strong>in</strong>g an exist<strong>in</strong>g store network with<br />
limited capex need.<br />
Other bus<strong>in</strong>esses more <strong>of</strong> a mixed bag<br />
We are less enthusiastic regard<strong>in</strong>g the prospects <strong>of</strong><br />
champagne (historically the group’s most cyclical<br />
bus<strong>in</strong>ess), perfumes (47% <strong>of</strong> sales <strong>in</strong> Europe) <strong>and</strong><br />
watches (which underperformed peers <strong>in</strong> Q2 with<br />
9% organic sales growth <strong>and</strong> for which the Bulgari<br />
<strong>in</strong>tegration is prov<strong>in</strong>g a short-term drag).<br />
LVMH: 2012e EBIT by division<br />
Louis Vuitton<br />
br<strong>and</strong><br />
49%<br />
Perfumes <strong>and</strong><br />
Cosmetics<br />
6%<br />
Source: HSBC estimates<br />
Watches <strong>and</strong><br />
Jewellery<br />
6%<br />
Other Fashion<br />
br<strong>and</strong>s<br />
5%<br />
Selective<br />
retail<strong>in</strong>g<br />
14%<br />
Champagne<br />
<strong>and</strong> W<strong>in</strong>es<br />
9%<br />
Cognac &<br />
spirits<br />
11%<br />
Earn<strong>in</strong>gs, valuation <strong>and</strong> risks<br />
Organic sales growth was 10% <strong>in</strong> Q2 2012<br />
(compa<strong>red</strong> to 14% <strong>in</strong> Q1). EBIT grew 20% <strong>in</strong> H1<br />
2012, imply<strong>in</strong>g an 110bp EBIT marg<strong>in</strong> deterioration<br />
at the group level (-220bp <strong>in</strong> Fashion & Leather <strong>and</strong><br />
-60bp <strong>in</strong> W<strong>in</strong>es & Spirits).<br />
For 2012, we forecast a 19.9% reported sales growth<br />
(9.5% organic, 7.2% FX, 3.2% from consolidation).<br />
We expect a 19% y-o-y rise <strong>in</strong> EBIT (18% exclud<strong>in</strong>g<br />
Bulgari), imply<strong>in</strong>g a 20bp EBIT marg<strong>in</strong> decl<strong>in</strong>e to<br />
22%. The limited marg<strong>in</strong> improvement is l<strong>in</strong>ked to<br />
the outperformance <strong>of</strong> lower-marg<strong>in</strong> bus<strong>in</strong>esses<br />
(DFS <strong>and</strong> smaller fashion br<strong>and</strong>s), the full<br />
<strong>in</strong>tegration <strong>of</strong> Bulgari (c12% EBIT marg<strong>in</strong> <strong>in</strong> 2011)<br />
<strong>and</strong> the above-mentioned elements weigh<strong>in</strong>g on<br />
Fashion & Leather marg<strong>in</strong>s.<br />
We decrease our 2012 EBIT estimates by 2%, but<br />
leave our 2013-14 EBIT estimates unchanged. More<br />
favourable FX is <strong>of</strong>fsett<strong>in</strong>g our lower Fashion &<br />
Leather estimates.<br />
Our DCF-based target price for LVMH is EUR145<br />
(unchanged). The assumptions used <strong>in</strong> our target<br />
price are detailed on page 69. Under our research<br />
model, for stocks without a volatility <strong>in</strong>dicator, the<br />
Neutral b<strong>and</strong> is 5 percentage po<strong>in</strong>ts above <strong>and</strong> below<br />
the hurdle rate for Europe ex-UK stocks <strong>of</strong> 9%. Our<br />
target price <strong>of</strong> EUR145 implies a potential return <strong>of</strong><br />
8.6%, with<strong>in</strong> the Neutral b<strong>and</strong> <strong>of</strong> our model;<br />
therefore, we downgrade LVMH to Neutral (from<br />
Overweight). Potential return equals the percentage<br />
difference between the current share price <strong>and</strong> the<br />
target price, <strong>in</strong>clud<strong>in</strong>g the forecast dividend yield<br />
when <strong>in</strong>dicated.<br />
Note that our EUR140 target price for Dior implies a<br />
19.7% potential return (OW, 27 Aug 2012 price <strong>of</strong><br />
EUR117, DIOR.PA) (see detailed <strong>in</strong>vestment case<br />
on page 37). We thus prefer to play LVMH’s robust<br />
fundamentals via its parent company (for which its<br />
40.9% stake <strong>in</strong> LVMH accounts for 90% <strong>of</strong> restated<br />
net asset value).<br />
The ma<strong>in</strong> specific upside risks to our rat<strong>in</strong>g are<br />
higher sales <strong>and</strong> marg<strong>in</strong>s at the LV br<strong>and</strong>. The ma<strong>in</strong><br />
specific downside risks would be destock<strong>in</strong>g <strong>of</strong> the<br />
wholesale bus<strong>in</strong>esses (W<strong>in</strong>es & Spirits, Watches,<br />
Perfumes) <strong>and</strong> value destruction l<strong>in</strong>ked to M&A<br />
activities (past <strong>and</strong> future).<br />
67
Consumer Br<strong>and</strong>s & Retail<br />
Global luxury goods<br />
September 2012<br />
abc<br />
LVMH FY results & forecasts<br />
EURm 2007a YoY<br />
% chg<br />
2008a<br />
YoY<br />
% chg<br />
2009a<br />
YoY<br />
% chg<br />
Sales 16,481 8 17,193 4 17,053 -1 20,320 19 23,659 16 28,370 20 31,210 10 33,660 8<br />
Current operat<strong>in</strong>g <strong>in</strong>come (EBIT) 3,555 12 3,628 2 3,352 -8 4,321 29 5,263 22 6,245 19 7,127 14 7,831 10<br />
Other operat<strong>in</strong>g <strong>in</strong>come <strong>and</strong> expenses -126 -143 -191 -152 -109 -122 -100 -100<br />
Operat<strong>in</strong>g <strong>in</strong>come 3,429 12 3,485 2 3,161 -9 4,169 32 5,154 24 6,123 19 7,027 15 7,731 10<br />
Net f<strong>in</strong>ancial expenses -252 -281 -342 612 -242 -69 -94 -8<br />
Income before taxes 3,177 6 3,204 1 2,819 -12 4,781 70 4,912 3 6,054 23 6,932 15 7,723 11<br />
Taxes -853 -893 -849 -1,469 -1,453 -1,786 -2,149 -2,394<br />
Associates 7 7 3 7 6 8 10 12<br />
M<strong>in</strong>ority <strong>in</strong>terests -306 -292 -218 -287 -400 -482 -560 -619<br />
Net pft before goodwill <strong>and</strong><br />
2,025 8 2,026 0 1,755 -13 3,032 73 3,065 1 3,794 24 4,234 12 4,722 12<br />
exceptionals<br />
EPS 4.22 7 4.26 1 3.70 -13 6.32 71 6.23 -1 7.56 21 8.43 12 9.41 12<br />
Sales by division<br />
W<strong>in</strong>es & Spirits 3,226 8 3,126 -3 2,740 -12 3,261 19 3,524 8 4,144 18 4,570 10 4,914 8<br />
Leather <strong>and</strong> Fashion 5,628 8 6,010 7 6,302 5 7,581 20 8,712 15 10,108 16 11,119 10 12,008 8<br />
Perfume <strong>and</strong> cosmetics 2,731 8 2,868 5 2,741 -4 3,076 12 3,195 4 3,568 12 3,772 6 3,941 4<br />
Selective distribution 4,179 7 4,376 5 4,533 4 5,378 19 6,436 20 7,873 22 8,768 11 9,533 9<br />
Watches 833 13 879 6 764 -13 985 29 1,949 98 2,923 50 3,239 11 3,531 9<br />
Others -116 nm -66 nm -27 nm 39 nm -157 nm -246 nm -257 nm -268 nm<br />
Total sales 16,481 8 17,193 4 17,053 -1 20,320 19 23,659 16 28,370 20 31,210 10 33,660 8<br />
EBIT by division<br />
W<strong>in</strong>es & Spirits 1,058 10 1,060 0 760 -28 930 22 1,101 18 1,322 20 1,524 15 1,675 10<br />
Leather <strong>and</strong> Fashion 1,829 12 1,927 5 1,986 3 2,555 29 3,075 20 3,434 12 3,870 13 4,228 9<br />
Perfume <strong>and</strong> cosmetics 256 15 290 13 291 0 332 14 348 5 393 13 422 8 449 6<br />
Selective distribution 439 10 388 -12 388 0 536 38 716 34 923 29 1,069 16 1,191 11<br />
Watches 141 76 118 -16 63 -47 128 103 265 107 395 49 470 19 530 13<br />
Others -168 34 -155 -8 -136 -12 -160 18 -242 51 -221 -9 -228 3 -241 6<br />
Total EBIT 3,555 12 3,628 2 3,352 -8 4,321 29 5,263 22 6,245 19 7,127 14 7,831 10<br />
EBIT marg<strong>in</strong> by division<br />
W<strong>in</strong>es & Spirits 32.8% 33.9% 27.7% 28.5% 31.2% 31.9% 33.3% 34.1%<br />
Leather <strong>and</strong> Fashion 32.5% 32.1% 31.5% 33.7% 35.3% 34.0% 34.8% 35.2%<br />
Perfume <strong>and</strong> cosmetics 9.4% 10.1% 10.6% 10.8% 10.9% 11.0% 11.2% 11.4%<br />
Selective distribution 10.5% 8.9% 8.6% 10.0% 11.1% 11.7% 12.2% 12.5%<br />
Watches 16.9% 13.4% 8.2% 13.0% 13.6% 13.5% 14.5% 15.0%<br />
Others nm nm nm nm nm nm nm nm<br />
Total EBIT marg<strong>in</strong> 21.6% 21.1% 19.7% 21.3% 22.2% 22.0% 22.8% 23.3%<br />
Source : Company, HSBC estimates<br />
2010a<br />
YoY<br />
% chg<br />
2011a<br />
YoY<br />
% chg<br />
2012e<br />
YoY<br />
% chg<br />
2013e<br />
YoY<br />
% chg<br />
2014e<br />
YoY<br />
% chg<br />
68
8<br />
.<br />
6<br />
Consumer Br<strong>and</strong>s & Retail<br />
Global luxury goods<br />
September 2012<br />
abc<br />
F<strong>in</strong>ancials & valuation: LVMH<br />
F<strong>in</strong>ancial statements<br />
Year to 12/2011a 12/2012e 12/2013e 12/2014e<br />
Pr<strong>of</strong>it & loss summary (EURm)<br />
Revenue 23,659 28,370 31,210 33,660<br />
EBITDA 6,187 7,062 7,993 8,750<br />
Depreciation & amortisation -924 -817 -867 -918<br />
Operat<strong>in</strong>g pr<strong>of</strong>it/EBIT 5,263 6,245 7,127 7,831<br />
Net <strong>in</strong>terest -242 -69 -94 -8<br />
PBT 4,918 6,062 6,942 7,735<br />
HSBC PBT 4,912 6,054 6,932 7,723<br />
Taxation -1,453 -1,786 -2,149 -2,394<br />
Net pr<strong>of</strong>it 3,065 3,794 4,234 4,722<br />
HSBC net pr<strong>of</strong>it 3,065 3,794 4,234 4,722<br />
Cash flow summary (EURm)<br />
Cash flow from operations 3,643 3,996 4,918 5,590<br />
Capex -1,749 -1,400 -1,500 -1,600<br />
Cash flow from <strong>in</strong>vestment -6,309 -1,400 -1,500 -1,600<br />
Dividends -1,069 -1,324 -1,482 -1,631<br />
Change <strong>in</strong> net debt 1,982 -1,273 -1,935 -2,360<br />
FCF equity 2,209 2,907 3,707 4,279<br />
Balance sheet summary (EURm)<br />
Intangible fixed assets 18,439 18,439 18,439 18,439<br />
Tangible fixed assets 8,017 8,600 9,233 9,915<br />
Current assets 13,449 15,608 16,910 18,032<br />
Cash & others 2,606 2,606 2,606 2,606<br />
Total assets 47,372 50,311 52,445 54,450<br />
Operat<strong>in</strong>g liabilities 6,763 8,021 8,780 9,435<br />
Gross debt 7,266 5,993 4,058 1,698<br />
Net debt 4,660 3,387 1,452 -908<br />
Shareholders funds 22,451 24,922 27,673 30,764<br />
Invested capital 30,536 32,019 33,196 34,345<br />
Ratio, growth <strong>and</strong> per share analysis<br />
Year to 12/2011a 12/2012e 12/2013e 12/2014e<br />
Y-o-y % change<br />
Revenue 16.4 19.9 10.0 7.8<br />
EBITDA 19.9 14.1 13.2 9.5<br />
Operat<strong>in</strong>g pr<strong>of</strong>it 21.8 18.7 14.1 9.9<br />
PBT 2.7 23.3 14.5 11.4<br />
HSBC EPS -1.5 21.4 11.6 11.5<br />
Ratios (%)<br />
Revenue/IC (x) 0.9 0.9 1.0 1.0<br />
ROIC 13.6 14.1 15.1 16.0<br />
ROE 15.5 16.0 16.1 16.2<br />
ROA 8.6 8.9 9.5 10.0<br />
EBITDA marg<strong>in</strong> 26.2 24.9 25.6 26.0<br />
Operat<strong>in</strong>g pr<strong>of</strong>it marg<strong>in</strong> 22.2 22.0 22.8 23.3<br />
EBITDA/net <strong>in</strong>terest (x) 25.6 102.9 84.6 1069.9<br />
Net debt/equity 19.8 12.8 4.9 -2.7<br />
Net debt/EBITDA (x) 0.8 0.5 0.2 -0.1<br />
CF from operations/net debt 78.2 118.0 338.7<br />
Per share data (EUR)<br />
EPS Rep (fully diluted) 6.23 7.56 8.43 9.41<br />
HSBC EPS (fully diluted) 6.23 7.56 8.43 9.41<br />
DPS 2.60 2.91 3.20 3.52<br />
Book value 44.18 49.04 54.45 60.53<br />
DCF analysis<br />
HSBC assumptions<br />
DCF, compris<strong>in</strong>g<br />
Neutral<br />
Risk-free rate (%) 3.00 EBIT growth 2011-21e CAGR (%) 8.5<br />
Equity premium (%) 6.00 EBIT growth 2021-41e CAGR (%) 3.7<br />
Sector beta 1.20 Fade period 2041-47e<br />
Specific beta 0.90 WACC (%) 9.09<br />
Sensitivity <strong>and</strong> valuation range (EUR/share)<br />
Cost <strong>of</strong> capital vs fade period 4 years 8 years 12 years<br />
8.1% 166 169 171<br />
8.6% 154 156 158<br />
9.1% 143 145 147<br />
9.6% 133 135 137<br />
10.1% 124 126 128<br />
Valuation data<br />
Year to 12/2011a 12/2012e 12/2013e 12/2014e<br />
EV/sales 3.0 2.5 2.2 1.9<br />
EV/EBITDA 11.4 9.8 8.5 7.4<br />
EV/IC 2.3 2.2 2.0 1.9<br />
PE* 21.4 17.7 15.8 14.2<br />
P/Book value 3.0 2.7 2.5 2.2<br />
FCF yield (%) 3.3 4.4 5.6 6.6<br />
Dividend yield (%) 1.9 2.2 2.4 2.6<br />
Note: * = Based on HSBC EPS (fully diluted)<br />
Issuer <strong>in</strong>formation<br />
Share price (EUR)133.50 Target price (EUR)145.00<br />
Reuters (Equity) LVMH.PA Bloomberg (Equity) MC FP<br />
Market cap (USDm) 84,920 Market cap (EURm) 67,850<br />
Free float (%) 47 Enterprise value (EURm) 69534<br />
Country France Sector Textiles, Apparel & <strong>Luxury</strong><br />
Goods<br />
Analyst Anto<strong>in</strong>e Belge Contact 33 1 5652 4347<br />
Erwan Rambourg Contact 852 2996 6572<br />
Sophie Dargnies Contact 331 5652 4348<br />
Price relative<br />
145<br />
135<br />
125<br />
115<br />
105<br />
95<br />
85<br />
85<br />
Aug-10 Feb-11 Aug-11 Feb-12 Aug-12<br />
LVMH Rel to SBF-120<br />
Source: HSBC<br />
Note: price at close <strong>of</strong> 27 Aug 2012<br />
145<br />
135<br />
125<br />
115<br />
105<br />
95<br />
69
Consumer Br<strong>and</strong>s & Retail<br />
Global luxury goods<br />
September 2012<br />
abc<br />
PPR<br />
We believe PPR’s luxury division has the potential to cont<strong>in</strong>ue to<br />
outperform its peers <strong>in</strong> terms <strong>of</strong> EBIT growth <strong>in</strong> 2012 as it did <strong>in</strong><br />
2011<br />
26 July announcement regard<strong>in</strong>g CFAO: a step further <strong>in</strong> terms <strong>of</strong><br />
divesture <strong>of</strong> non-core assets<br />
Reiterate Overweight, raise target price to EUR156 (from<br />
EUR150) on higher estimates<br />
Increas<strong>in</strong>gly a great luxury play<br />
<strong>Luxury</strong> division: Potential to cont<strong>in</strong>ue to<br />
outperform peers <strong>in</strong> 2012 as <strong>in</strong> 2011<br />
In 2011, PPR’s <strong>Luxury</strong> division registe<strong>red</strong> 34%<br />
EBIT growth (restated for the account<strong>in</strong>g change<br />
affect<strong>in</strong>g central costs), which was the fourthstrongest<br />
<strong>in</strong> our coverage after Ferragamo, Prada<br />
<strong>and</strong> Hugo Boss. For 2012, we forecast 26% EBIT<br />
growth, aga<strong>in</strong> above our estimate for the average<br />
<strong>of</strong> the <strong>in</strong>dustry (18%).<br />
Even though the Gucci br<strong>and</strong> may be a victim <strong>of</strong><br />
our ‘first-mover disadvantage’ theme (outl<strong>in</strong>ed on<br />
page 19 <strong>of</strong> this report) <strong>in</strong> certa<strong>in</strong> Asian countries,<br />
its sales cont<strong>in</strong>ued to grow at a double-digit pace<br />
on a worldwide basis <strong>in</strong> Q2 (+10% after +11.6% <strong>in</strong><br />
Q1) <strong>and</strong> its EBIT marg<strong>in</strong> <strong>in</strong>creased further <strong>in</strong> H1<br />
(+30bp after +180bp <strong>in</strong> 2011).<br />
Moreover, PPR’s <strong>Luxury</strong> division growth pr<strong>of</strong>ile is<br />
boosted by the stellar performance (both <strong>in</strong> terms <strong>of</strong><br />
sales <strong>and</strong> marg<strong>in</strong>s) <strong>of</strong> Bottega Veneta, YSL <strong>and</strong><br />
smaller br<strong>and</strong>s (Balenciaga <strong>in</strong> particular).<br />
Gucci br<strong>and</strong>; some weak spots, but still<br />
grow<strong>in</strong>g EBIT nicely<br />
S<strong>in</strong>ce Q4 2011, not everyth<strong>in</strong>g has been runn<strong>in</strong>g<br />
smoothly at the Gucci br<strong>and</strong>. True, on a worldwide<br />
basis, the br<strong>and</strong>’s average price <strong>in</strong> leather goods<br />
has risen by c30% <strong>in</strong> the last three years by<br />
focus<strong>in</strong>g on the medium segment <strong>of</strong> its h<strong>and</strong>bag<br />
proposition, with a higher leather content vs canvas<br />
<strong>and</strong> fewer logo products, <strong>and</strong> achiev<strong>in</strong>g a higher<br />
share <strong>of</strong> carry-overs. But <strong>in</strong> Korea for <strong>in</strong>stance, this<br />
upgrade has been more recent <strong>and</strong> probably is too<br />
sudden, which may have disoriented clients.<br />
In ma<strong>in</strong>l<strong>and</strong> Ch<strong>in</strong>a, organic growth rema<strong>in</strong>ed robust<br />
(+18.5% <strong>in</strong> Q1 <strong>and</strong> +16.1% <strong>in</strong> Q2). Management is<br />
monitor<strong>in</strong>g the current ‘bipolarisation’: whilst <strong>in</strong><br />
tier-2 <strong>and</strong> moreover tier-3 cities, customers are still<br />
eager to buy logo products, clients from tier-1 cities<br />
are now clearly trad<strong>in</strong>g up.<br />
We forecast a 14% EBIT CAGR over 2012-14e<br />
for the Gucci br<strong>and</strong> on the back <strong>of</strong> an 8% organic<br />
sales growth <strong>in</strong> H2 2012, 2013 <strong>and</strong> 2014. We<br />
believe the Gucci br<strong>and</strong> has significant EBIT<br />
marg<strong>in</strong> improvement potential, even after the<br />
180bp ga<strong>in</strong> to 30.2% seen <strong>in</strong> 2011: we forecast<br />
EBIT marg<strong>in</strong> to <strong>in</strong>crease from 28.7% <strong>in</strong> 2010 to<br />
32% <strong>in</strong> 2014 (mostly driven by lower markdowns<br />
<strong>and</strong> scale effects).<br />
70
Consumer Br<strong>and</strong>s & Retail<br />
Global luxury goods<br />
September 2012<br />
abc<br />
BV, Balenciaga, YSL: strong pr<strong>of</strong>it contributors<br />
Bottega Veneta <strong>and</strong> Balenciaga, <strong>in</strong> our view, have<br />
the potential to outpace the <strong>in</strong>dustry average due to<br />
their niche position<strong>in</strong>g <strong>and</strong> the c<strong>red</strong>ibility <strong>of</strong> their<br />
leather goods <strong>of</strong>fer<strong>in</strong>g (more than 70% <strong>of</strong> sales for<br />
both <strong>of</strong> them). For Bottega <strong>in</strong> particular, which<br />
accounts for 18% <strong>in</strong> 2012e <strong>of</strong> PPR’s <strong>Luxury</strong><br />
division’s EBIT, we forecast organic sales growth <strong>of</strong><br />
27% <strong>in</strong> 2012 after 34% <strong>in</strong> 2011. YSL (+28% organic<br />
sales growth <strong>and</strong> 340bp EBIT marg<strong>in</strong> expansion <strong>in</strong><br />
2012e), Alex<strong>and</strong>er McQueen, Stella McCartney,<br />
Brioni <strong>and</strong> Girard-Perregaux also have significant<br />
sales <strong>and</strong> marg<strong>in</strong> potential, <strong>in</strong> our view.<br />
CFAO announcement: a step further <strong>in</strong> terms <strong>of</strong><br />
divesture <strong>of</strong> non-core assets<br />
On 26 July, PPR announced that it had agreed to sell<br />
29.8% <strong>of</strong> CFAO capital to Toyota Tsusho Corp <strong>and</strong><br />
to tender its rema<strong>in</strong><strong>in</strong>g 12.2% stake <strong>in</strong>to the public<br />
tender <strong>of</strong>fer which TTC is consider<strong>in</strong>g.<br />
Regard<strong>in</strong>g the different assets lodged <strong>in</strong> the Redcats<br />
division, PPR stated it was now seek<strong>in</strong>g to sell them<br />
<strong>in</strong> pieces after fail<strong>in</strong>g to secure a buyer for the entire<br />
division. Whilst this is <strong>in</strong> our view <strong>in</strong>creas<strong>in</strong>g the<br />
likelihood <strong>of</strong> some disposal before the end <strong>of</strong> 2012,<br />
this may also probably mean it will take longer to<br />
sell the least <strong>in</strong>terest<strong>in</strong>g pieces. F<strong>in</strong>ally, we do not<br />
expect the disposal <strong>of</strong> Fnac to happen before 2013,<br />
i.e. when the effect <strong>of</strong> the ongo<strong>in</strong>g restructur<strong>in</strong>g<br />
should be more visible.<br />
Acquisition risks overstated<br />
In our view, not only does the market not seem to<br />
recognise that PPR’s good track record <strong>in</strong> sell<strong>in</strong>g<br />
assets would be a proxy for future disposals, it also<br />
appears worried about the potential dilution risk<br />
l<strong>in</strong>ked to PPR’s stated M&A ambitions <strong>in</strong> luxury<br />
<strong>and</strong> br<strong>and</strong>ed goods. We have fewer concerns than<br />
most about PPR’s possible next move, especially <strong>in</strong><br />
the next 12-18 months. 2011 showed that PPR is<br />
focus<strong>in</strong>g on small to medium-sized deals, <strong>and</strong> no<br />
deal has occur<strong>red</strong> so far <strong>in</strong> 2012. PPR acqui<strong>red</strong> the<br />
sports & lifestyle company Volcom (for an EV <strong>of</strong><br />
USD516m), the premium menswear company<br />
Brioni (EUR170m <strong>in</strong> sales <strong>in</strong> 2010, undisclosed<br />
price – our estimate is EUR300m) <strong>and</strong> <strong>in</strong>creased its<br />
stake <strong>in</strong> the watch company Sow<strong>in</strong>d (Girard-<br />
Perregaux <strong>and</strong> JeanRichard br<strong>and</strong>s as well as watch<br />
movements manufactur<strong>in</strong>g capacities) from 23% to<br />
50.1% for cEUR200m (a hefty price, <strong>in</strong> our view,<br />
but on a small deal).<br />
Puma: the true real weak spot<br />
We acknowledge that Puma’s disappo<strong>in</strong>t<strong>in</strong>g<br />
operat<strong>in</strong>g <strong>and</strong> share price performance s<strong>in</strong>ce its<br />
acquisition may lead to scepticism about PPR’s<br />
ability to create value from acquisitions <strong>in</strong> sport<strong>in</strong>g<br />
goods <strong>and</strong> lifestyle.<br />
Earn<strong>in</strong>gs, valuation <strong>and</strong> risks<br />
We have lowe<strong>red</strong> our overall 2012 EBIT estimates<br />
by 1%, but <strong>in</strong>creased our 2013 <strong>and</strong> 2014 EBIT<br />
estimates by 2% <strong>and</strong> 3%, respectively. More<br />
importantly, we have raised our 2012-14 EBIT<br />
estimates for the <strong>Luxury</strong> division by 6%, 8% <strong>and</strong> 9%<br />
on the back <strong>of</strong> the weaker EUR <strong>and</strong> higher earn<strong>in</strong>gs<br />
forecasts for Bottega Veneta <strong>and</strong> YSL. S<strong>in</strong>ce the<br />
<strong>Luxury</strong> division accounts for more than 75% <strong>of</strong> our<br />
sum-<strong>of</strong>-the-parts, this upgrades more than <strong>of</strong>fset the<br />
downward revision on Puma (see our Puma report<br />
dated 09 August). We are thus <strong>in</strong>creas<strong>in</strong>g our sum<strong>of</strong>-the-parts-based<br />
target price to EUR156 (from<br />
EUR150). For details <strong>of</strong> our sum-<strong>of</strong>-the-parts<br />
valuation approach, please refer to page 73. Under<br />
our research model, for Europe ex-UK stocks<br />
without a volatility <strong>in</strong>dicator, the Neutral b<strong>and</strong> is 5<br />
percentage po<strong>in</strong>ts above <strong>and</strong> below the hurdle rate <strong>of</strong><br />
9.0%. S<strong>in</strong>ce our target price implies a 23.5%<br />
potential return, which is above the Neutral b<strong>and</strong>, we<br />
reiterate our Overweight rat<strong>in</strong>g on PPR. Potential<br />
return equals the percentage difference between the<br />
current share price <strong>and</strong> the target price, <strong>in</strong>clud<strong>in</strong>g the<br />
forecast dividend yield when <strong>in</strong>dicated.<br />
Downside risks to our Overweight rat<strong>in</strong>g <strong>in</strong>clude<br />
underperformance <strong>of</strong> the Gucci br<strong>and</strong>, disposals <strong>of</strong><br />
assets at lower-than-expected prices, <strong>and</strong> value<br />
destruction l<strong>in</strong>ked to acquisitions.<br />
71
Consumer Br<strong>and</strong>s & Retail<br />
Global luxury goods<br />
September 2012<br />
abc<br />
PPR - Earn<strong>in</strong>gs forecasts<br />
EURm<br />
2003 pro 2004 pro<br />
forma forma<br />
2005a 2006a 2007a 2008a 2009a* 2010a* 2011a 2012e 2013e 2014e<br />
Sales<br />
<strong>Luxury</strong> Goods 2,576 2,712 3,034 3,568 3,867 3,380 3,390 4,011 4,917 6,165 6,816 7,401<br />
Retail 13,903 14,358 13,906 14,365 14,196 14,318 10,690 7,909 4,165 4,123 4,247 4,374<br />
Puma 1,718 2,524 2,461 2,706 3,009 3,240 3,470 3,720<br />
Volcom 147 292 307 322<br />
Other -30 -29 -2 -2 -20 -21 -16 -21 -10 -14 -18 -21<br />
Total PPR 16,449 17,042 16,938 17,931 19,761 20,201 16,525 14,605 12,227 13,807 14,822 15,797<br />
Sales growth y-o-y (%)<br />
<strong>Luxury</strong> Goods 5.3 11.9 17.6 8.4 -12.6 0.3 18.3 22.6 25.4 10.6 8.6<br />
Retail 3.3 -3.1 3.3 -1.2 0.9 -25.3 -26.0 -47.3 -1.0 3.0 3.0<br />
Puma 47.0 -2.5 10.0 11.2 7.7 7.1 7.2<br />
Volcom 99.0 5.0 5.0<br />
Total PPR 3.6 -0.6 5.9 10.2 2.2 -18.2 -11.6 -16.3 12.9 7.4 6.6<br />
EBIT<br />
<strong>Luxury</strong> Goods 250 288 392 565 731 731 692 897 1,263 1,588 1,825 2,047<br />
Retail 754 760 729 759 785 695 422 353 103 70 106 131<br />
Puma 236 350 320 337 333 300 350 400<br />
Volcom 14 23 28 32<br />
Hold<strong>in</strong>g companies & other -61 -59 -50 -57 -54 -50 -56 -110 -111 -116 -116<br />
Total PPR 1,003 986 1,063 1,275 1,696 1,721 1,383 1,531 1,602 1,870 2,193 2,494<br />
EBIT marg<strong>in</strong>s (%)<br />
<strong>Luxury</strong> Goods 9.7 10.6 12.9 15.8 18.9 21.6 20.4 22.4 25.7 25.8 26.8 27.7<br />
Retail 5.4 5.3 5.2 5.3 5.5 4.9 3.9 4.5 2.5 1.7 2.5 3.0<br />
Puma 13.7 13.9 13.0 12.5 11.1 9.3 10.1 10.8<br />
Volcom 9.2 8.0 9.0 10.0<br />
Total PPR 6.1 5.8 6.3 7.1 8.6 8.5 8.4 10.5 13.1 13.5 14.8 15.8<br />
EBIT growth y-o-y (%)<br />
<strong>Luxury</strong> Goods 15.3 36.3 44.2 29.3 0.0 -5.3 29.7 40.7 25.8 14.9 12.1<br />
Retail 0.8 -4.0 4.1 3.4 -11.5 -39.3 -16.3 -70.9 -31.7 51.5 23.6<br />
Puma 48.2 -8.6 5.5 -1.2 -10.0 16.7 14.3<br />
Volcom 73.0 18.1 16.7<br />
Total PPR -1.7 7.7 19.9 33.1 1.5 -19.6 10.7 4.6 16.7 17.3 13.7<br />
Other operat<strong>in</strong>g <strong>in</strong>c/charges nm nm 3 0 100 -361 -547 -194 -58 -180 0 0<br />
Operat<strong>in</strong>g <strong>in</strong>come nm nm 1,066 1,274 1,796 1,360 837 1,337 1,544 1,690 2,193 2,494<br />
Net Interest nm nm -307 -290 -322 -373 -381 -254 -215 -235 -195 -135<br />
Tax nm nm -187 -260 -298 -335 -177 -304 -317 -386 -530 -625<br />
Tax rate (%) nm nm -24.7% -26.4% -20.2% -33.9% -38.8% -28.1% -23.9% -26.5% -26.5% -26.5%<br />
Equity Affiliate Share nm nm 3 2 1 1 0 36 47 41 21 24<br />
M<strong>in</strong>orities nm nm -38 -47 -119 -117 -32 -51 -59 -60 -70 -80<br />
Net pr<strong>of</strong>it reported nm 536 685 922 537 985 964 986 1,111 1,479 1,737<br />
Net pr<strong>of</strong>it (base <strong>of</strong> diluted EPS calculation) 578 698 904 875 712 932 1,055 1,243 1,479 1,737<br />
Avg Number <strong>of</strong> shares used <strong>in</strong> diluted EPS nm 132.5 121.7 128.7 126.1 126.5 126.7 126.3 126.3 126.3 126.3<br />
HSBC EPS (diluted)** nm 4.36 5.73 7.03 6.94 5.63 7.35 8.35 9.84 11.72 13.76<br />
HSBC EPS growth nm nm 31.3 22.6 -1.2 -18.8 30.5 13.6 17.8 19.0 17.4<br />
*2009 not restated for the disposal <strong>of</strong> Conforama, 2010 not restated for Redcats discont<strong>in</strong>uation <strong>and</strong> change <strong>in</strong> central costs account<strong>in</strong>g<br />
**HSBC 2012-2014e EPS <strong>in</strong>cludes discont<strong>in</strong>ued activities<br />
Source: company data, HSBC estimates<br />
72
2<br />
3<br />
.<br />
5<br />
Consumer Br<strong>and</strong>s & Retail<br />
Global luxury goods<br />
September 2012<br />
abc<br />
F<strong>in</strong>ancials & valuation: PPR<br />
F<strong>in</strong>ancial statements<br />
Year to 12/2011a 12/2012e 12/2013e 12/2014e<br />
Pr<strong>of</strong>it & loss summary (EURm)<br />
Revenue 12,227 13,807 14,822 15,797<br />
EBITDA 1,911 2,202 2,545 2,867<br />
Depreciation & amortisation -309 -332 -352 -373<br />
Operat<strong>in</strong>g pr<strong>of</strong>it/EBIT 1,602 1,870 2,193 2,494<br />
Net <strong>in</strong>terest -215 -235 -195 -135<br />
PBT 1,376 1,496 2,019 2,382<br />
HSBC PBT 1,329 1,455 1,998 2,359<br />
Taxation -317 -386 -530 -625<br />
Net pr<strong>of</strong>it 999 1,051 1,419 1,677<br />
HSBC net pr<strong>of</strong>it 1,055 1,243 1,479 1,737<br />
Cash flow summary (EURm)<br />
Cash flow from operations 1,036 1,317 1,645 1,917<br />
Capex -325 -390 -418 -447<br />
Cash flow from <strong>in</strong>vestment 104 -152 -418 -447<br />
Dividends -441 -448 -475 -503<br />
Change <strong>in</strong> net debt -414 -709 -778 -987<br />
FCF equity 819 941 1,242 1,487<br />
Balance sheet summary (EURm)<br />
Intangible fixed assets 16,136 15,316 15,316 15,316<br />
Tangible fixed assets 1,372 1,881 1,947 2,021<br />
Current assets 5,277 5,650 5,943 6,259<br />
Cash & others 1,271 1,271 1,271 1,271<br />
Total assets 24,954 25,015 25,374 25,765<br />
Operat<strong>in</strong>g liabilities 8,163 8,286 8,419 8,562<br />
Gross debt 4,678 3,968 3,190 2,203<br />
Net debt 3,407 2,698 1,920 933<br />
Shareholders funds 10,925 11,573 12,577 13,811<br />
Invested capital 13,351 13,289 13,516 13,763<br />
Ratio, growth <strong>and</strong> per share analysis<br />
Year to 12/2011a 12/2012e 12/2013e 12/2014e<br />
Y-o-y % change<br />
Revenue -16.3 12.9 7.4 6.6<br />
EBITDA 2.7 15.2 15.6 12.6<br />
Operat<strong>in</strong>g pr<strong>of</strong>it 4.6 16.7 17.3 13.7<br />
PBT 22.9 8.8 34.9 18.0<br />
HSBC EPS 13.6 17.8 19.0 17.4<br />
Ratios (%)<br />
Revenue/IC (x) 0.8 1.0 1.1 1.2<br />
ROIC 8.4 10.4 12.1 13.5<br />
ROE 9.8 11.0 12.3 13.2<br />
ROA 4.9 5.1 6.5 7.3<br />
EBITDA marg<strong>in</strong> 15.6 15.9 17.2 18.1<br />
Operat<strong>in</strong>g pr<strong>of</strong>it marg<strong>in</strong> 13.1 13.5 14.8 15.8<br />
EBITDA/net <strong>in</strong>terest (x) 8.9 9.4 13.1 21.2<br />
Net debt/equity 29.0 21.8 14.3 6.4<br />
Net debt/EBITDA (x) 1.8 1.2 0.8 0.3<br />
CF from operations/net debt 30.4 48.8 85.7 205.5<br />
Per share data (EUR)<br />
EPS Rep (fully diluted) 7.91 8.32 11.24 13.28<br />
HSBC EPS (fully diluted) 8.35 9.84 11.72 13.76<br />
DPS 3.50 3.71 3.93 4.17<br />
Book value 86.09 91.19 99.11 108.83<br />
PPR sum-<strong>of</strong>-the-parts valuation<br />
Valuation<br />
(EURm)<br />
Per share<br />
(EUR)<br />
Overweight<br />
Methodology<br />
Gucci br<strong>and</strong> 11,843 94 9.5x12e EBITDA<br />
Bottega Veneta 3,925 31 13x12e EBITDA<br />
Other luxury bus<strong>in</strong>esses 1,910 15 1.5x12e sales (adj for m<strong>in</strong>orities)<br />
Sub-total <strong>Luxury</strong> 17,678 140<br />
Fnac 1,237 10 0.3x12e sales<br />
Redcats 949 8 0.3x12e sales<br />
Retail (Fnac+Redcats) 2,186 17<br />
CFAO (12.18%) 281 2 Price <strong>of</strong> August 2012 partial<br />
disposal (EUR37.50)<br />
Puma (82.4%) 2,911 23 HSBC target price EUR265<br />
Volcom 356 3 Acquisition price<br />
Other -1,113 -9 10x12e EBITDA<br />
Total PPR 22,299 177<br />
Net debt end 12e 2,698 -21<br />
Total PPR equity value 19,602 156<br />
Note: CFAO (CFAO FP, EUR36.90, N); Puma (PUM GR, EUR229.90, OW)<br />
Valuation data<br />
Year to 12/2011a 12/2012e 12/2013e 12/2014e<br />
EV/sales 1.6 1.3 1.2 1.1<br />
EV/EBITDA 10.1 8.5 7.0 5.9<br />
EV/IC 1.4 1.4 1.3 1.2<br />
PE* 15.1 12.8 10.8 9.2<br />
P/Book value 1.5 1.4 1.3 1.2<br />
FCF yield (%) 5.1 5.9 7.8 9.3<br />
Dividend yield (%) 2.8 2.9 3.1 3.3<br />
Note: * = Based on HSBC EPS (fully diluted)<br />
Issuer <strong>in</strong>formation<br />
Share price (EUR)126.35 Target price (EUR)156.00<br />
Reuters (Equity) PRTP.PA Bloomberg (Equity) PP FP<br />
Market cap (USDm) 19,921 Market cap (EURm) 15,916<br />
Free float (%) 55 Enterprise value (EURm) 18614<br />
Country France Sector Multil<strong>in</strong>e Retail<br />
Anto<strong>in</strong>e Belge Contact 33 1 5652 4347<br />
Erwan Rambourg Contact 852 2996 6572<br />
Analyst Anto<strong>in</strong>e Belge Contact 33 1 5652 4347<br />
Price relative<br />
145<br />
135<br />
125<br />
115<br />
105<br />
95<br />
85<br />
85<br />
Aug-10 Feb-11 Aug-11 Feb-12 Aug-12<br />
PPR Rel to SBF-120<br />
Source: HSBC<br />
Note: price at close <strong>of</strong> 27 Aug 2012<br />
145<br />
135<br />
125<br />
115<br />
105<br />
95<br />
73
Consumer Br<strong>and</strong>s & Retail<br />
Global luxury goods<br />
September 2012<br />
abc<br />
Prada<br />
If as mentioned <strong>in</strong> our previous report, “Prada is the next<br />
Burberry”, then we believe it’s too early to sell despite the high<br />
perceived valuation<br />
The real operational benchmark is probably Louis Vuitton <strong>and</strong><br />
market share ga<strong>in</strong>s <strong>and</strong> operat<strong>in</strong>g leverage should cont<strong>in</strong>ue<br />
Consensus does not believe the story <strong>in</strong> our view; our EBIT is<br />
14% higher; we raise TP to HKD71 (from HKD62) on H1 strength<br />
<strong>and</strong> lower beta; reiterate OW(V)<br />
The snowball effect: roll with it!<br />
Is this f<strong>in</strong>ally the next big th<strong>in</strong>g?<br />
Greed is good. Guilt is cumbersome. In mid-June,<br />
we wrote the follow<strong>in</strong>g: While Burberry has been<br />
the most compell<strong>in</strong>g stock re-rat<strong>in</strong>g story <strong>in</strong> our<br />
luxury coverage over the past four years (with Hugo<br />
Boss), we believe Prada may just be at the beg<strong>in</strong>n<strong>in</strong>g<br />
<strong>of</strong> becom<strong>in</strong>g a market darl<strong>in</strong>g. Keep<strong>in</strong>g an OW(V)<br />
rat<strong>in</strong>g on what consensus will <strong>in</strong>evitably say is “a<br />
high PE stock on a story that has unfolded” can be<br />
seem as greedy. We felt guilty downgrad<strong>in</strong>g<br />
Burberry <strong>in</strong> the midst <strong>of</strong> its transformation process<br />
which saw that stock <strong>in</strong>creas<strong>in</strong>g sevenfold from the<br />
2008 lows. So we would rather appear as greedy<br />
rather than feel guilty.<br />
We th<strong>in</strong>k the reason Prada is do<strong>in</strong>g so well is that<br />
there is a snowball effect <strong>and</strong> that positive changes <strong>in</strong><br />
br<strong>and</strong> perception are slow <strong>and</strong> susta<strong>in</strong>ed <strong>and</strong><br />
resist<strong>in</strong>g them is like st<strong>and</strong><strong>in</strong>g <strong>in</strong> front <strong>of</strong> a tra<strong>in</strong> or a<br />
(very big) snowball. Prada, four years ago was a<br />
good to have, complimentary br<strong>and</strong>, now it’s<br />
become a challenger <strong>in</strong> the h<strong>and</strong>bag <strong>and</strong> accessories<br />
space. In a few years, we argue the br<strong>and</strong> will have<br />
become one <strong>of</strong> the very few reference br<strong>and</strong>s<br />
alongside Louis Vuitton <strong>and</strong> Cartier.<br />
As consumer’s perception changes, so does the<br />
perspective <strong>of</strong> retail operators who will gradually<br />
give better terms to the br<strong>and</strong>, better locations,<br />
<strong>and</strong> priority over competitors.<br />
From a stock perspective, we thought it was<br />
<strong>in</strong>terest<strong>in</strong>g to compare Prada to Burberry, which is<br />
a similar-sized br<strong>and</strong>s, has very different<br />
operat<strong>in</strong>g leverage, <strong>and</strong> great capacity to surprise<br />
(for Burberry <strong>in</strong> the past, for Prada now). From an<br />
operational st<strong>and</strong>po<strong>in</strong>t, we believe the true<br />
benchmark for Prada now is Louis Vuitton. LV<br />
dom<strong>in</strong>ates <strong>in</strong> scale (br<strong>and</strong> should generate<br />
EUR7.4bn <strong>in</strong> sales this year, close to 2.7x times<br />
the Prada br<strong>and</strong>), with EBIT marg<strong>in</strong>s at low 40s<br />
vs low 30s at Prada, tight image control (sales are<br />
100% retail), good execution, <strong>and</strong> top <strong>of</strong> m<strong>in</strong>d for<br />
consumers. Of course, we believe every br<strong>and</strong><br />
aspires to emulate LV but very few have a shot<br />
<strong>and</strong> we th<strong>in</strong>k Prada does. With a goal to generate<br />
90% <strong>of</strong> sales at retail <strong>in</strong> the next three years,<br />
aggressive store open<strong>in</strong>gs (263 Prada-br<strong>and</strong> stores<br />
74
Consumer Br<strong>and</strong>s & Retail<br />
Global luxury goods<br />
September 2012<br />
abc<br />
at end-July, c200 less than LV) <strong>and</strong> <strong>in</strong>novative as<br />
well as fast-mov<strong>in</strong>g product flow (thanks to<br />
monthly “flash” collections), we see the strong<br />
market share ga<strong>in</strong>s <strong>and</strong> momentum experienced<br />
over the past 18 months not disappear<strong>in</strong>g<br />
overnight.<br />
Earn<strong>in</strong>gs, valuation <strong>and</strong> risks<br />
What to expect for H1 results<br />
Q2 sales growth at constant FX was c19%<br />
(compa<strong>red</strong> to +41% <strong>in</strong> Q1). As anticipated, growth<br />
<strong>in</strong> wholesale turned negative <strong>in</strong> Q2 (c-12% at<br />
constant FX vs +39% <strong>in</strong> Q1 which was boosted by<br />
deliveries postponed from Q4 2011). This negative<br />
wholesale figure was not a surprise s<strong>in</strong>ce the<br />
company was guid<strong>in</strong>g towards “flat to slightly<br />
positive” trends at constant FX over the full year.<br />
Growth at constant FX <strong>in</strong> retail was c33% <strong>in</strong> Q2 (vs<br />
42% <strong>in</strong> Q1), driven by 19% same-store-sales growth<br />
(vs 19% <strong>in</strong> Q1) – by far the highest <strong>in</strong> the sector –<br />
<strong>and</strong> a contribution from new stores <strong>of</strong> c14% (vs 23%<br />
<strong>in</strong> Q1). The company mentioned that leather goods<br />
outperformed <strong>in</strong> H1. By br<strong>and</strong>, Prada grew 40.5% <strong>in</strong><br />
H1 <strong>and</strong> Miu Miu was up 23.6% on a reported basis.<br />
By region, Prada disclosed the follow<strong>in</strong>g growth<br />
rates <strong>in</strong> reported terms for H1: Italy +22%, Europe:<br />
+37%, Asia ex Japan +45%, Americas +31%, Japan:<br />
+34%. Based on our own estimates <strong>of</strong> how FX<br />
impacted each region, we estimate that the Q2 sales<br />
growth at constant FX rates were the follow<strong>in</strong>g: Italy<br />
+6% (vs +54% <strong>in</strong> Q1), Europe +25% (vs +55% <strong>in</strong><br />
Q1), Americas (+13% vs +26% <strong>in</strong> Q1), Japan +15%<br />
(vs +28% <strong>in</strong> Q1), <strong>and</strong> Asia ex Japan +26% (vs +37%<br />
<strong>in</strong> Q1). The above-mentioned wholesale impact<br />
which boosted Q1 impacted Italy, Europe <strong>and</strong> the<br />
US the most (elsewhere, Prada is almost only retail).<br />
Gross marg<strong>in</strong> should be up <strong>in</strong> Q2 as it is a more<br />
retail-driven quarter <strong>and</strong> retail also outperformed<br />
wholesale significantly. Whilst we see negative<br />
leverage on sell<strong>in</strong>g expenses (new store concepts <strong>and</strong><br />
lower wholesale sales weigh<strong>in</strong>g), we believe other<br />
SG&A items such as advertis<strong>in</strong>g (aga<strong>in</strong> l<strong>in</strong>ked to<br />
retail outperformance), product <strong>and</strong> development<br />
expenses <strong>and</strong> adm<strong>in</strong> costs will have seen strong<br />
leverage from the sales growth. All <strong>in</strong>, we are<br />
expect<strong>in</strong>g a 210bps EBIT marg<strong>in</strong> improvement <strong>in</strong><br />
Q2 (to 28.0%) after a 670bps improvement <strong>in</strong> Q1,<br />
lead<strong>in</strong>g to a 390bps improvement for H1 to 26.2% <strong>of</strong><br />
sales.<br />
Still well ahead <strong>of</strong> consensus<br />
We believe either consensus does not believe <strong>in</strong> the<br />
market share ga<strong>in</strong> story as much as we do or<br />
underestimates the operat<strong>in</strong>g leverage from Prada’s<br />
strong top-l<strong>in</strong>e growth. Whatever the case is, we are,<br />
for 2012 <strong>and</strong> 2013 respectively, 6% <strong>and</strong> 4% ahead<br />
on sales <strong>and</strong> 13% <strong>and</strong> 15% ahead on EBIT<br />
estimates. For FY Jan 13e, we cont<strong>in</strong>ue to take the<br />
view that Prada should have the highest sales growth<br />
<strong>in</strong> the sector (24% organic, 31% reported). Gross<br />
marg<strong>in</strong> should <strong>in</strong>crease by 70bps (to 72.2%), less<br />
than before as the shift to retail from wholesale<br />
cont<strong>in</strong>ues but is capped by the transfer <strong>of</strong><br />
consumption from Asia (high gross marg<strong>in</strong>) to<br />
Europe (low gross marg<strong>in</strong>). At the EBIT marg<strong>in</strong><br />
level, we have facto<strong>red</strong> <strong>in</strong> another 280bps <strong>of</strong><br />
improvement to 27.4% <strong>of</strong> sales, imply<strong>in</strong>g a 200bps<br />
<strong>in</strong>crease <strong>in</strong> H2.<br />
We have <strong>in</strong>creased our FY Jan 13-14e EBIT<br />
estimates by 2% <strong>and</strong> 6%, respectively, on the back<br />
<strong>of</strong> higher sales <strong>and</strong> have also lower the specific beta<br />
<strong>of</strong> the company on greater visibility (longer, stronger<br />
track record) with new stores show<strong>in</strong>g no<br />
cannibalisation on the exist<strong>in</strong>g base for now. We<br />
<strong>in</strong>crease our DCF-based target price to HKD71<br />
(from HKD62) on these revisions. Our assumptions<br />
are RFR 3.0% vs 3.5%, ERP 5.5% vs 4.5%, WACC<br />
8.94% (vs 9.60% previously); see page 77 for<br />
details. Under our research model, for stocks with a<br />
volatility <strong>in</strong>dicator, the Neutral b<strong>and</strong> is 10ppts above<br />
<strong>and</strong> below the hurdle rate for Hong Kong stocks <strong>of</strong><br />
8.5%. Our target price <strong>of</strong> HKD71 provides a<br />
potential return <strong>of</strong> 20%, which is above the Neutral<br />
b<strong>and</strong>, therefore we reiterate our Overweight (V)<br />
rat<strong>in</strong>g. Potential return equals the percentage<br />
difference between the current share price <strong>and</strong> the<br />
75
Consumer Br<strong>and</strong>s & Retail<br />
Global luxury goods<br />
September 2012<br />
abc<br />
target price, <strong>in</strong>clud<strong>in</strong>g the forecast dividend yield<br />
when <strong>in</strong>dicated.<br />
On our new estimates, Prada is trad<strong>in</strong>g at 25.0x<br />
CY12e <strong>and</strong> 20.0x CY13e EPS, a 15% premium to<br />
Burberry, <strong>and</strong> a 30% premium to LVMH. Risks<br />
<strong>in</strong>clude a potential placement <strong>of</strong> shares from Prada<br />
family members as the lock-up agreement expi<strong>red</strong><br />
on 24 June 2012 <strong>and</strong> the failure to execute the retail<br />
strategy, translat<strong>in</strong>g <strong>in</strong>to lower operat<strong>in</strong>g leverage<br />
than we model.<br />
Prada SPA (EURm) – Pr<strong>of</strong>it & Loss<br />
__________________ 2011____________________ _____________ 2012 _____________<br />
FY06 FY07 FY08 FY09 FY10 Q1 Q2 H1 Q3 Q4 H2 FY Q1 Q2 H1 H2(e) FY(e) FY 13e FY 14e<br />
Net Sales 1,604 1,531 2,017 456 662 1,117 589 817 1,406 2,523 673 852 1,525 1,784 3,309 3,820 4,271<br />
Royalties 40 31 30 9 8 17 7 8 15 32 13 10 23 18 41 46 51<br />
Net revenues 1,335 1,425 1,644 1,561 2,047 464 670 1,134 596 825 1,421 2,555 687 861 1,548 1,803 3,351 3,865 4,323<br />
Gross Pr<strong>of</strong>it 744 829 953 975 1,388 341 464 805 431 592 1,023 1,828 496 607 1,104 1,316 2,419 2,833 3,220<br />
Gross marg<strong>in</strong> (%) 55.8% 58.1% 58.0% 62.4% 67.8% 73.5% 69.3% 71.0% 72.2% 71.8% 72.0% 71.5% 72.3% 70.5% 71.3% 73.0% 72.2% 73.3% 74.5%<br />
Product <strong>and</strong> development (78) (85) (88) (97) (97) (22) (30) (51) (22) (30) (52) (103) (25) (37) (62) (51) (113) (120) (124)<br />
expenses<br />
as a % <strong>of</strong> sales 5.8% 5.9% 5.4% 6.2% 4.7% 4.6% 4.5% 4.5% 3.7% 3.7% 3.6% 4.0% 3.7% 4.2% 4.0% 2.8% 3.4% 3.1% 2.9%<br />
Advertis<strong>in</strong>g <strong>and</strong> promotion (60) (87) (100) (76) (85) (30) (24) (54) (37) (39) (75) (129) (35) (34) (70) (88) (157) (180) (195)<br />
expenses<br />
as a % <strong>of</strong> sales 4.5% 6.1% 6.1% 4.9% 4.2% 6.5% 3.5% 4.8% 6.2% 4.7% 5.3% 5.1% 5.1% 4.0% 4.5% 4.9% 4.7% 4.5% 4.5%<br />
Sell<strong>in</strong>g expenses (428) (485) (643) (171) (186) (357) (199) (246) (446) (803) (228) (242) (471) (585) (1,055) (1,206) (1,340)<br />
as a % <strong>of</strong> sales 26.0% 31.0% 31.4% 36.9% 27.7% 31.5% 33.9% 30.1% 31.4% 31.1% 33.2% 28.2% 30.4% 32.4% 31.5% 31.2% 31.0%<br />
General <strong>and</strong> adm<strong>in</strong>istrative (634) (221) (146) (130) (145) (38) (51) (89) (34) (41) (75) (164) (43) (53) (96) (79) (175) (190) (205)<br />
expenses<br />
as a % <strong>of</strong> sales 47.5% 15.5% 8.9% 8.4% 7.1% 8.2% 7.7% 7.9% 5.8% 5.0% 5.3% 6.7% 6.2% 6.2% 6.2% 4.4% 5.2% 4.9% 4.7%<br />
SG&A as a % <strong>of</strong> sales 47.4% 56.2% 43.4% 48.6% 49.5% 43.5% 45.5% 46.9% 48.3% 42.5% 45.1% 44.5% 44.8% 43.7% 43.1%<br />
EBIT 99.3 607.2 191.0 187 414 80 173 253 139 237 376 629 165 241 406 513 918 1,137 1,357<br />
EBIT marg<strong>in</strong> (%) 7.4 42.6 11.6 12.0 20.2 17.3 25.9 22.3 23.3 28.7 26.4 24.6 24.0 28.0 26.2 28.4 27.4 29.4 31.4<br />
PBT 68.3 574.8 153.8 155 388 78 164 242 133 229 361 603 166 239 406 508 913 1,137 1,362<br />
Taxation (20) (47) (53) (53) (135) (20) (41) (61) (38) (68) (106) (166) (43) (67) (110) (137) (247) (301) (354)<br />
Tax rate 29.6% 8.1% 34.2% 33.8% 34.7% 25.1% 25.0% 25.1% 28.6% 29.8% 27.6% 27.6% 25.9% 28.0% 27.1% 26.9% 27.0% 26.5% 26.0%<br />
PAT 48.1 528.1 101.2 103 254 59 123 181 95 161 255 437 123 172 296 371 667 836 1,008<br />
Net pr<strong>of</strong>it for group (1,448) (259) 101 101 254 59 121 180 95 161 257 437 123 171 294 373 667 836 1,008<br />
Net marg<strong>in</strong> (%) -108.5 -18.2 6.1 6.4 12.4 12.6 18.1 15.8 15.9 19.5 17.1 17.1 18.0 19.8 19.0 19.9 19.9 21.6 23.3<br />
Pr<strong>of</strong>. attrib. to noncontroll<strong>in</strong>g<br />
1,496 787 2 0 (3) (1) 6 5 (1) 0 (10) (4.5) (2) (1) (3) (4) (6.5) (8.5) (10.5)<br />
<strong>in</strong>terests<br />
Pr<strong>of</strong>. attributable to equity<br />
98 98 251 58 125 183 94 161 247 432 122 168 289 371 660 827 997<br />
owner<br />
Weighted avg number <strong>of</strong><br />
2,548 2,506 2,528 2,500 2,512 2,512 2,512 2,512 2,512 2,536 2,559 2,559 2,559 2,559 2,559 2,559 2,559<br />
shares (m)<br />
EPS (Basic) (EUR) 0.040 0.04 0.10 0.02 0.05 0.07 0.04 0.06 0.10 0.17 0.05 0.07 0.11 0.14 0.26 0.32 0.39<br />
Source: Company data, HSBC estimates<br />
76
2<br />
0<br />
.<br />
0<br />
Consumer Br<strong>and</strong>s & Retail<br />
Global luxury goods<br />
September 2012<br />
abc<br />
F<strong>in</strong>ancials & valuation: Prada SPA<br />
F<strong>in</strong>ancial statements<br />
Year to 01/2012a 01/2013e 01/2014e 01/2015e<br />
Pr<strong>of</strong>it & loss summary (EURm)<br />
Revenue 2,555 3,351 3,865 4,323<br />
EBITDA 759 1,069 1,311 1,551<br />
Depreciation & amortisation -130 -151 -174 -195<br />
Operat<strong>in</strong>g pr<strong>of</strong>it/EBIT 629 918 1,137 1,357<br />
Net <strong>in</strong>terest -26 -5 0 5<br />
PBT 603 913 1,137 1,362<br />
HSBC PBT 603 913 1,137 1,362<br />
Taxation -166 -247 -301 -354<br />
Net pr<strong>of</strong>it 432 660 827 997<br />
HSBC net pr<strong>of</strong>it 432 660 827 997<br />
Cash flow summary (EURm)<br />
Cash flow from operations 530 740 963 1,160<br />
Capex -257 -294 -320 -365<br />
Cash flow from <strong>in</strong>vestment -257 -294 -320 -365<br />
Dividends -6 -127 -188 -236<br />
Change <strong>in</strong> net debt -419 -320 -455 -560<br />
FCF equity 273 446 643 796<br />
Balance sheet summary (EURm)<br />
Intangible fixed assets 864 864 864 864<br />
Tangible fixed assets 947 1,090 1,235 1,406<br />
Current assets 1,118 1,648 2,234 2,909<br />
Cash & others 362 682 1,137 1,697<br />
Total assets 2,944 3,616 4,348 5,194<br />
Operat<strong>in</strong>g liabilities 628 761 845 919<br />
Gross debt 344 344 344 344<br />
Net debt -18 -338 -793 -1,353<br />
Shareholders funds 1,823 2,356 2,995 3,757<br />
Invested capital 1,937 2,158 2,350 2,563<br />
Ratio, growth <strong>and</strong> per share analysis<br />
Year to 01/2012a 01/2013e 01/2014e 01/2015e<br />
Y-o-y % change<br />
Revenue 24.9 31.1 15.4 11.8<br />
EBITDA 42.9 40.8 22.7 18.3<br />
Operat<strong>in</strong>g pr<strong>of</strong>it 52.0 46.0 23.9 19.3<br />
PBT 55.3 51.4 24.5 19.7<br />
HSBC EPS 71.7 52.8 25.3 20.5<br />
Ratios (%)<br />
Revenue/IC (x) 1.4 1.6 1.7 1.8<br />
ROIC 24.7 32.7 37.1 40.9<br />
ROE 28.5 31.6 30.9 29.5<br />
ROA 17.2 20.4 21.0 21.0<br />
EBITDA marg<strong>in</strong> 29.7 31.9 33.9 35.9<br />
Operat<strong>in</strong>g pr<strong>of</strong>it marg<strong>in</strong> 24.6 27.4 29.4 31.4<br />
EBITDA/net <strong>in</strong>terest (x) 29.2 213.8<br />
Net debt/equity -1.0 -14.3 -26.3 -35.7<br />
Net debt/EBITDA (x) 0.0 -0.3 -0.6 -0.9<br />
CF from operations/net debt<br />
Per share data (EUR)<br />
EPS Rep (fully diluted) 0.17 0.26 0.33 0.39<br />
HSBC EPS (fully diluted) 0.17 0.26 0.33 0.39<br />
DPS 0.05 0.07 0.09 0.10<br />
Book value 0.72 0.93 1.18 1.48<br />
DCF analysis<br />
HSBC assumptions<br />
DCF, compris<strong>in</strong>g<br />
Overweight (V)<br />
Risk-free rate (%) 3.00 EBIT growth 11-21e CAGR (%) 14.6<br />
Equity premium (%) 5.50 EBIT growth 21-41e CAGR (%) 4.6<br />
Sector beta 1.20 Fade period 2041-47e<br />
Specific beta 0.90 WACC (%) 8.94<br />
Sensitivity <strong>and</strong> valuation range (HKD/share)<br />
Cost <strong>of</strong> capital vs fade period 4 years 8 years 12 years<br />
8.6% 79.7 81.9 83.6<br />
9.1% 74.3 76.1 77.7<br />
9.6% 69.4 71.0 72.3<br />
10.1% 65.0 66.3 67.5<br />
10.6% 60.9 62.1 63.1<br />
Valuation data<br />
Year to 01/2012a 01/2013e 01/2014e 01/2015e<br />
EV/sales 6.1 4.6 3.8 3.3<br />
EV/EBITDA 20.5 14.3 11.3 9.2<br />
EV/IC 8.0 7.1 6.3 5.6<br />
PE* 35.7 23.4 18.7 15.5<br />
P/Book value 8.5 6.6 5.2 4.1<br />
FCF yield (%) 1.7 2.9 4.1 5.1<br />
Dividend yield (%) 0.8 1.2 1.5 1.7<br />
Note: * = Based on HSBC EPS (fully diluted)<br />
Issuer <strong>in</strong>formation<br />
Share price (HKD)59.15 Target price (HKD)71.00<br />
Reuters (Equity) 1913.HK Bloomberg (Equity) 1913 HK<br />
Market cap (USDm) 19,515 Market cap (HKDm) 151,354<br />
Free float (%) 20 Enterprise value (EURm) 15253<br />
Country Hong Kong Sector Textiles, Apparel & <strong>Luxury</strong><br />
Goods<br />
Erwan Rambourg Contact 852 2996 6572<br />
Anto<strong>in</strong>e Belge Contact 331 5652 4347<br />
Analyst Sophie Dargnies Contact 331 5652 4348<br />
Price relative<br />
64<br />
59<br />
54<br />
49<br />
44<br />
39<br />
34<br />
29<br />
24<br />
Aug-11 Feb-12 Aug-12<br />
Prada SPA Rel to HANG SENG INDEX<br />
Source: HSBC<br />
Note: price at close <strong>of</strong> 27 Aug 2012<br />
64<br />
59<br />
54<br />
49<br />
44<br />
39<br />
34<br />
29<br />
24<br />
77
Consumer Br<strong>and</strong>s & Retail<br />
Global luxury goods<br />
September 2012<br />
abc<br />
Richemont<br />
Although valuation appears reasonable, the positive alert <strong>in</strong> August<br />
implies a lack <strong>of</strong> short-term catalysts<br />
Despite a “favorable basis <strong>of</strong> comparison”, sales growth should slow<br />
<strong>in</strong> H2 as Greater Ch<strong>in</strong>a’s turbulences are not fully mitigated<br />
Rema<strong>in</strong> N, <strong>in</strong>crease TP to CHF67 (from CHF62) on higher<br />
estimates<br />
What’s the next catalyst?<br />
In an unusual move, Richemont published on 6<br />
August a trad<strong>in</strong>g statement say<strong>in</strong>g that organic sales<br />
growth <strong>in</strong> the first 4 months (April-July 2012) rose<br />
13% (or 24% reported due to a +11% FX impact).<br />
On this basis, Richemont expects EBIT <strong>and</strong> net<br />
pr<strong>of</strong>it to <strong>in</strong>crease between 20% <strong>and</strong> 40% <strong>in</strong> H1<br />
end<strong>in</strong>g September-12. April organic sales growth<br />
was +20%, hence organic growth <strong>in</strong> May-July was<br />
c10% accord<strong>in</strong>g to our estimates. Management<br />
stated that monthly trends had slowed sequentially<br />
from the high level <strong>of</strong> April (+20%), but is unwill<strong>in</strong>g<br />
to give more details (the <strong>of</strong>ficial 5-month trad<strong>in</strong>g<br />
statement will be released on 5 Sep). Accord<strong>in</strong>g to<br />
our estimates, it is likely that Richemont sales were<br />
no longer grow<strong>in</strong>g at a double-digit pace <strong>in</strong> July at<br />
constant FX.<br />
Richemont: organic sales growth rates<br />
FY March 2008a 2009a 2010a 2011a 2012a 2013e<br />
H1 16% 16% -20% 22% 36% 11%<br />
H2 15% -12% 10% 16% 19% 6%<br />
FY 16% 2% -5% 19% 27% 8%<br />
Source: Company data, HSBC estimates<br />
The company’s confidence about H1 pr<strong>of</strong>its is<br />
mostly FX-related: the strength <strong>of</strong> the USD <strong>and</strong> the<br />
EUR/CHF peg would boost H1 pr<strong>of</strong>its. In April-July<br />
alone, the FX boost at the sales level was +11% <strong>and</strong><br />
August should benefit even more as we anniversary<br />
the CHF spike. Even if Richemont’s FY12 opex<br />
guidance is call<strong>in</strong>g for a +14% <strong>in</strong>crease y-o-y <strong>in</strong><br />
SG&A exclud<strong>in</strong>g communication, we believe the H1<br />
gross marg<strong>in</strong> will be supported by FX.<br />
Whilst H1 results should be strong as anticipated by<br />
the company, we expect the market to now focus on<br />
the 5-months trad<strong>in</strong>g statement (5 Sep) as well as on<br />
H1 results (9 Nov) <strong>and</strong> could be more focused on<br />
sales trends than on operat<strong>in</strong>g marg<strong>in</strong> – as the EBIT<br />
<strong>in</strong>crease has been guided for by management. In<br />
other words, while don’t doubt that Richemont will<br />
deliver, we struggle to f<strong>in</strong>d the next catalyst for<br />
shares to cont<strong>in</strong>ue to re-rate, especially follow<strong>in</strong>g the<br />
summer’s rally.<br />
It’s not all about Ch<strong>in</strong>a, but still<br />
This part is common to the <strong>in</strong>vestment cases <strong>of</strong><br />
Richemont <strong>and</strong> the Swatch Group. Look<strong>in</strong>g at the<br />
recent poor sales growth at Hendgeli <strong>and</strong> given the<br />
amount <strong>of</strong> <strong>in</strong>ventory this major distributor still<br />
carries on its books (not to mention other retailers<br />
hav<strong>in</strong>g more), we believe “sell-<strong>in</strong>” growth rates for<br />
Greater Ch<strong>in</strong>a will now f<strong>in</strong>ally see a step down. This<br />
78
Consumer Br<strong>and</strong>s & Retail<br />
Global luxury goods<br />
September 2012<br />
abc<br />
is especially true when look<strong>in</strong>g at the higher-end<br />
portion <strong>of</strong> Hengdeli sales (‘Elegant” concept).<br />
As watch retailers <strong>in</strong> Greater Ch<strong>in</strong>a look to <strong>red</strong>uce<br />
excess <strong>in</strong>ventory, we believe there are two options:<br />
a) to discount product to clear excess stock, or b) to<br />
order less from the br<strong>and</strong>s. We believe the only<br />
viable option (br<strong>and</strong>s <strong>and</strong> retailers still believe <strong>in</strong> the<br />
long-term growth <strong>in</strong> Ch<strong>in</strong>a) is option b <strong>and</strong> as we<br />
have f<strong>in</strong>ally seen a slowdown <strong>in</strong> Swiss Watch<br />
Exports <strong>in</strong> July (Ch<strong>in</strong>a was down 9%, HK was down<br />
1%). We expect export (ie. sell-<strong>in</strong>) to be s<strong>of</strong>t<br />
between now <strong>and</strong> the year-end <strong>in</strong> Greater Ch<strong>in</strong>a, as<br />
<strong>in</strong>ventories are gradually kept <strong>in</strong> check.<br />
In Greater Ch<strong>in</strong>a, we believe our “high <strong>and</strong> dry<br />
versus cheap <strong>and</strong> cheerful” theme is still valid as<br />
high-end watches, driven by gift giv<strong>in</strong>g, <strong>and</strong> with<strong>in</strong><br />
this category, the more “ma<strong>in</strong>stream” br<strong>and</strong>s like<br />
Rolex <strong>and</strong> Cartier will suffer more than those at<br />
access price po<strong>in</strong>ts.<br />
We estimate that up to two-thirds <strong>of</strong> consumers<br />
purchas<strong>in</strong>g luxury products <strong>in</strong> Ch<strong>in</strong>a are new to the<br />
br<strong>and</strong>s they buy (ie. not “repeat purchasers”) <strong>and</strong> are<br />
tak<strong>in</strong>g the view that the proportion <strong>of</strong> clients “new to<br />
a br<strong>and</strong>” is greater at the lower price po<strong>in</strong>ts (Rado,<br />
Mido, Long<strong>in</strong>es, Tissot) than for Omega <strong>and</strong> above<br />
type <strong>of</strong> price po<strong>in</strong>ts. We believe that consumers able<br />
to afford higher price po<strong>in</strong>ts are more “travelled” <strong>and</strong><br />
exposed to negative headl<strong>in</strong>e news weigh<strong>in</strong>g on<br />
sentiment <strong>and</strong> will take the view that they can<br />
postpone a EUR10k purchase, wait<strong>in</strong>g for a better<br />
environment. We are conv<strong>in</strong>ced that corporate gift<br />
giv<strong>in</strong>g (or Guanxi) drives high-end purchases more<br />
than it drives sales <strong>of</strong> the likes <strong>of</strong> Rado, Long<strong>in</strong>es,<br />
Tissot, etc. As real estate deals are scarce <strong>and</strong><br />
government <strong>of</strong>ficials cont<strong>in</strong>ue to be vocal aga<strong>in</strong>st<br />
corporate gift<strong>in</strong>g, we are see<strong>in</strong>g the trend <strong>of</strong> gift<br />
giv<strong>in</strong>g slow<strong>in</strong>g, at least temporarily.<br />
Our estimate for Greater Ch<strong>in</strong>a is that sales growth<br />
for the high end (Omega <strong>and</strong> above price po<strong>in</strong>ts) will<br />
be flat <strong>in</strong> H2 while lower-priced br<strong>and</strong>s could still<br />
grow <strong>in</strong> the mid-teens, on the back <strong>of</strong> middle-class<br />
expansion <strong>and</strong> higher wages. On those assumptions,<br />
Asia ex-Japan should underperform global trends at<br />
both Swatch <strong>and</strong> Richemont.<br />
Earn<strong>in</strong>gs, valuation <strong>and</strong> risks<br />
We have raised our FY March 13e <strong>and</strong> 14e EBIT<br />
estimates by 14% <strong>and</strong> 8%, respectively, on the back<br />
<strong>of</strong> the weaker euro <strong>and</strong> higher gross marg<strong>in</strong><br />
assumptions (we now see an <strong>in</strong>crease <strong>in</strong> FY March<br />
13 despite the fact that FX hedg<strong>in</strong>g will no longer be<br />
booked <strong>in</strong> the gross marg<strong>in</strong> <strong>and</strong> that Richemont is<br />
hir<strong>in</strong>g watch makers to <strong>red</strong>uce its dependence on<br />
Swatch – thanks to the shift towards retail <strong>and</strong> price<br />
<strong>in</strong>creases). Regard<strong>in</strong>g FY March 13, we have based<br />
our SG&A forecasts on the company’s guidance <strong>of</strong> a<br />
9.5% communication-to-sales ratio (as the shift<br />
towards more retail sales technically lowers the<br />
ratio) <strong>and</strong> 14% <strong>in</strong>crease y-o-y at constant FX <strong>of</strong><br />
other SG&A (retail, Net-à-Porter, Ch<strong>in</strong>a<br />
<strong>in</strong>frastructure, watch repairs facilities). On our<br />
revised estimates, EBIT marg<strong>in</strong> should dip by 60bps<br />
<strong>in</strong> FY March 2013 <strong>and</strong> by 50bp <strong>in</strong> FY March 14, <strong>and</strong><br />
then rega<strong>in</strong> 40bps (to 22.3% <strong>of</strong> sales) <strong>in</strong> FY March<br />
15.<br />
We have raised our DCF-based target price to<br />
CHF67 (vs CHF62) follow<strong>in</strong>g these revisions). Our<br />
DCF assumptions are unchanged (see table on page<br />
81). Under our research model, for stocks without a<br />
volatility <strong>in</strong>dicator, the Neutral b<strong>and</strong> is 5 ppts above<br />
<strong>and</strong> below the hurdle rate for Swiss stocks <strong>of</strong> 7.5%.<br />
Our target price <strong>of</strong> EUR67 provides a potential<br />
return <strong>of</strong> 11.8%, with<strong>in</strong> the Neutral b<strong>and</strong>; therefore,<br />
we rema<strong>in</strong> Neutral on the stock. Potential return<br />
equals the percentage difference between the current<br />
share price <strong>and</strong> the target price, <strong>in</strong>clud<strong>in</strong>g the<br />
forecast dividend yield when <strong>in</strong>dicated. On our new<br />
estimates, Richemont is trad<strong>in</strong>g at 15.6x CY 2012e<br />
<strong>and</strong> 14.2x CY 2013e EPS.<br />
Specific risks <strong>in</strong>clude the Swiss franc’s strength<br />
(on the downside) or weakness (on the upside).<br />
Downside risks are the historically lower<br />
resilience <strong>of</strong> watches compa<strong>red</strong> to other luxury<br />
79
Consumer Br<strong>and</strong>s & Retail<br />
Global luxury goods<br />
September 2012<br />
abc<br />
segments <strong>in</strong> case <strong>of</strong> a severe economic downturn,<br />
<strong>and</strong> failure to improve results <strong>of</strong> the<br />
underperform<strong>in</strong>g assets. Upside risks <strong>in</strong>clude a<br />
much better resilience <strong>of</strong> sales trends <strong>and</strong> more<br />
conv<strong>in</strong>c<strong>in</strong>g marg<strong>in</strong> turnaround at Baume &<br />
Mercier, Dunhill <strong>and</strong> Net-à-Porter.<br />
Richemont - FY results <strong>and</strong> forecasts<br />
______ 2010a ______ ______ 2011a ______ _______ 2012 ______ ______ 2013e______<br />
EURm, year end<strong>in</strong>g March 2007a 2008a 2009a H1 H2 FY H1 H2 FY H1(a) H2(a) FY(e) H1 H2 FY 2014e 2015e<br />
Net sales 4,827 5,302 5,418 2,379 2,797 5,176 3,259 3,633 6,892 4,214 4,653 8,867 5,110 5,140 10,250 10,925 11,725<br />
% change 12.0% 9.8% 2.2% -15.0% 6.8% -4.5% 37.0% 29.9% 33.2% 29.3% 28.1% 28.7% 21.3% 10.5% 15.6% 6.6% 7.3%<br />
Gross pr<strong>of</strong>it 3,074 3,405 3,417 1,464 1,727 3,191 2,113 2,281 4,394 2,665 2,986 5,651 3,300 3,291 6,591 6,992 7,551<br />
Gross marg<strong>in</strong> 63.7% 64.2% 63.1% 61.5% 61.7% 61.6% 64.8% 62.8% 63.8% 63.2% 64.2% 63.7% 64.6% 64.0% 64.3% 64.0% 64.4%<br />
Sell<strong>in</strong>g & distribution 1,090 1,181 1,235 598 679 1,277 761 893 1,654 891 1,071 1,962 1,105 1,269 2,374 2,564 2,769<br />
as a % <strong>of</strong> sales 22.6% 22.3% 22.8% 25.1% 24.3% 24.7% 23.3% 24.6% 24.0% 21.1% 23.0% 22.1% 21.6% 24.7% 23.2% 23.5% 23.6%<br />
Adm<strong>in</strong>istration 503 528 542 259 286 545 314 342 656 342 405 747 424 480 904 958 1,016<br />
as a % <strong>of</strong> sales 10.4% 10.0% 10.0% 10.9% 10.2% 10.5% 9.6% 9.4% 9.5% 8.1% 8.7% 8.4% 8.3% 9.3% 8.8% 8.8% 8.7%<br />
Communication 570 607 644 204 302 506 264 435 699 340 519 859 404 570 974 1,038 1,114<br />
as a % <strong>of</strong> sales 11.8% 11.4% 11.9% 8.6% 10.8% 9.8% 8.1% 12.0% 10.1% 8.1% 11.2% 9.7% 7.9% 11.1% 9.5% 9.5% 9.5%<br />
Other / Non-recurr<strong>in</strong>g items -5 -13 28 13 20 33 14 16 30 17 26 43 17 26 43 43 43<br />
Total operat<strong>in</strong>g exps 2,158 2,297 2,449 1,074 1,287 2,361 1,353 1,686 3,039 1,590 2,021 3,611 1,950 2,345 4,295 4,603 4,942<br />
as a % <strong>of</strong> sales 44.7% 43.3% 45.2% 45.1% 46.0% 45.6% 41.5% 46.4% 44.1% 37.7% 43.4% 40.7% 38.2% 45.6% 41.9% 42.1% 42.1%<br />
EBIT reported 916 1,108 968 390 440 830 760 595 1,355 1,075 965 2,040 1,350 946 2,296 2,389 2,609<br />
EBIT underly<strong>in</strong>g 900 1,108 968 390 440 830 760 595 1,355 1,075 965 2,040 1,350 946 2,296 2,389 2,609<br />
EBIT marg<strong>in</strong> underly<strong>in</strong>g 18.6% 20.9% 17.9% 16.4% 15.7% 16.0% 23.3% 16.4% 19.7% 25.5% 20.7% 23.0% 26.4% 18.4% 22.4% 21.9% 22.3%<br />
F<strong>in</strong>ancial result 31 47 -101 24 -161 -137 -120 -163 -283 -227 -9 -236 0 18 18 23 29<br />
Exceptional 102 0 102 0 0 0 0<br />
Taxation -158 -195 -133 -70 -24 -94 -98 -98 -196 -139 -125 -264 -226 -161 -386 -403 -441<br />
M<strong>in</strong>ority <strong>in</strong>terest -1 1 3 0 4 4 -2 103 101 0 0 0 0 0 0 0 0<br />
<strong>Luxury</strong> net pr<strong>of</strong>it (reported) 788 961 737 344 259 603 642 437 1,079 709 831 1,540 1,125 803 1,928 2,009 2,198<br />
Source: Company data, HSBC estimates<br />
Richemont - FY sales <strong>and</strong> EBIT by segment<br />
______ 2010a ______ ______ 2011a ______ _______ 2012 ______ ______ 2013e______<br />
EURm, year end<strong>in</strong>g March 2007a 2008a 2009a H1 H2 FY H1 H2 FY H1(a) H2(a) FY(e) H1 H2 FY 2014e 2015e<br />
Sales by segment<br />
Jewellery maisons 2,435 2,657 2,762 1,222 1,465 2,688 1,619 1,860 3,479 2,165 2,425 4,590 2,598 2,708 5,306 5,633 6,004<br />
Specialist watchmakers 1,203 1,378 1,437 655 699 1,353 901 873 1,774 1,171 1,152 2,323 1,434 1,283 2,717 2,885 3,087<br />
Writ<strong>in</strong>g <strong>in</strong>struments 585 637 587 238 313 551 303 369 672 334 389 723 381 400 781 820 861<br />
Other bus<strong>in</strong>esses 604 630 632 264 320 584 436 531 967 544 688 1,232 696 750 1,446 1,587 1,774<br />
Total Sales 4,827 5,302 5,418 2,379 2,797 5,176 3,259 3,633 6,892 4,214 4,653 8,867 5,110 5,141 10,250 10,925 11,725<br />
EBIT by segment<br />
Jewellery maisons 667 767 777 349 393 742 541 521 1,062 734 776 1,510 925 812 1,737 1,817 1,963<br />
Specialist watchmakers 274 376 301 133 98 231 259 120 379 312 227 539 410 235 645 642 715<br />
Writ<strong>in</strong>g <strong>in</strong>struments 110 120 69 29 50 79 48 61 109 54 65 119 60 70 130 135 145<br />
Other bus<strong>in</strong>esses 9 2 -39 -29 -7 -36 -19 -16 -35 -17 -18 -35 -1 -1 -2 24 33<br />
Total EBIT before unallocated costs 1,060 1,265 1,108 482 534 1,016 829 687 1,516 1,083 1,050 2,133 1,394 1,117 2,511 2,618 2,856<br />
EBIT reported 916 1,108 968 390 440 830 760 595 1,355 1,075 965 2,040 1,350 946 2,296 2,389 0<br />
EBIT marg<strong>in</strong> by segment<br />
Jewellery maisons 27.4% 28.9% 28.1% 28.6% 26.8% 27.6% 33.4% 28.0% 30.5% 33.9% 32.0% 32.9% 35.6% 30.0% 32.7% 32.3% 32.7%<br />
Specialist watchmakers 22.8% 27.3% 20.9% 20.3% 14.0% 17.1% 28.7% 13.8% 21.4% 26.6% 19.7% 23.2% 28.6% 18.3% 23.7% 22.2% 23.2%<br />
Writ<strong>in</strong>g <strong>in</strong>struments 18.8% 18.8% 11.8% 12.2% 16.0% 14.3% 15.8% 16.5% 16.2% 16.2% 16.7% 16.5% 15.8% 17.6% 16.7% 16.5% 16.8%<br />
Other bus<strong>in</strong>esses 1.5% 0.3% -6.2% -11.0% -2.2% -6.2% -4.4% -3.0% -3.6% -3.1% -2.7% -2.9% -0.1% -0.1% -0.1% 1.5% 1.9%<br />
Total EBIT marg<strong>in</strong> before unallocated 22.0% 23.9% 20.4% 20.3% 19.1% 19.6% 25.4% 18.9% 22.0% 25.7% 22.6% 24.1% 27.3% 21.7% 24.5% 24.0% 24.4%<br />
costs<br />
EBIT marg<strong>in</strong> reported 19.0% 20.9% 17.9% 16.4% 15.7% 16.0% 23.3% 16.4% 19.7% 25.5% 20.7% 23.0% 26.4% 18.4% 22.4% 21.9% 22.3%<br />
Source: Company data, HSBC estimates<br />
80
1<br />
1<br />
.<br />
8<br />
Consumer Br<strong>and</strong>s & Retail<br />
Global luxury goods<br />
September 2012<br />
abc<br />
F<strong>in</strong>ancials & valuation: Richemont<br />
F<strong>in</strong>ancial statements<br />
Year to 03/2012a 03/2013e 03/2014e 03/2015e<br />
Pr<strong>of</strong>it & loss summary (EURm)<br />
Revenue 8,867 10,250 10,925 11,725<br />
EBITDA 2,359 2,647 2,775 3,034<br />
Depreciation & amortisation -319 -351 -386 -425<br />
Operat<strong>in</strong>g pr<strong>of</strong>it/EBIT 2,040 2,296 2,389 2,609<br />
Net <strong>in</strong>terest -236 18 23 29<br />
PBT 1,804 2,314 2,412 2,638<br />
HSBC PBT 1,804 2,314 2,412 2,638<br />
Taxation -264 -386 -403 -441<br />
Net pr<strong>of</strong>it 1,540 1,928 2,009 2,198<br />
HSBC net pr<strong>of</strong>it 1,540 1,928 2,009 2,198<br />
Cash flow summary (EURm)<br />
Cash flow from operations 1,236 2,039 2,169 2,405<br />
Capex -511 -750 -803 -859<br />
Cash flow from <strong>in</strong>vestment -511 -750 -803 -859<br />
Dividends -204 -253 -326 -373<br />
Change <strong>in</strong> net debt -598 -1,035 -1,064 -1,174<br />
FCF equity 778 1,289 1,389 1,546<br />
Balance sheet summary (EURm)<br />
Intangible fixed assets 59 59 59 59<br />
Tangible fixed assets 1,529 1,928 2,345 2,779<br />
Current assets 8,595 9,214 10,626 12,172<br />
Cash & others 4,036 4,245 5,309 6,483<br />
Total assets 11,753 12,771 14,600 16,580<br />
Operat<strong>in</strong>g liabilities 1,896 2,067 2,211 2,366<br />
Gross debt 848 22 22 22<br />
Net debt -3,188 -4,223 -5,287 -6,461<br />
Shareholders funds 8,609 10,283 11,966 13,792<br />
Invested capital 4,251 4,890 5,509 6,161<br />
Ratio, growth <strong>and</strong> per share analysis<br />
Year to 03/2012a 03/2013e 03/2014e 03/2015e<br />
Y-o-y % change<br />
Revenue 28.7 15.6 6.6 7.3<br />
EBITDA 34.0 12.2 4.8 9.3<br />
Operat<strong>in</strong>g pr<strong>of</strong>it 50.6 12.6 4.0 9.2<br />
PBT 53.7 28.3 4.2 9.4<br />
HSBC EPS 59.5 25.2 4.2 9.4<br />
Ratios (%)<br />
Revenue/IC (x) 2.3 2.2 2.1 2.0<br />
ROIC 45.3 41.9 38.3 37.3<br />
ROE 19.8 20.4 18.1 17.1<br />
ROA 16.2 15.6 14.5 13.9<br />
EBITDA marg<strong>in</strong> 26.6 25.8 25.4 25.9<br />
Operat<strong>in</strong>g pr<strong>of</strong>it marg<strong>in</strong> 23.0 22.4 21.9 22.3<br />
EBITDA/net <strong>in</strong>terest (x) 10.0<br />
Net debt/equity -37.0 -41.0 -44.1 -46.8<br />
Net debt/EBITDA (x) -1.4 -1.6 -1.9 -2.1<br />
CF from operations/net debt<br />
Per share data (EUR)<br />
EPS Rep (fully diluted) 2.76 3.45 3.60 3.93<br />
HSBC EPS (fully diluted) 2.76 3.45 3.60 3.93<br />
DPS 0.45 0.58 0.67 0.67<br />
Book value 14.99 17.91 20.84 24.02<br />
DCF analysis<br />
HSBC assumptions<br />
DCF, compris<strong>in</strong>g<br />
Neutral<br />
Risk-free rate (%) 3.00 EBIT growth 2011-21e CAGR (%) 6.7<br />
Equity premium (%) 4.50 EBIT growth 2021-41e CAGR (%) 3.6<br />
Sector beta 1.20 Fade period 2041-47e<br />
Specific beta 1.20 WACC (%) 9.48<br />
Sensitivity <strong>and</strong> valuation range (CHF/share)<br />
Cost <strong>of</strong> capital vs fade period 4 years 8 years 12 years<br />
8.5% 74.4 75.7 76.7<br />
9.0% 70.0 71.1 72.0<br />
9.5% 66.0 67.0 67.9<br />
10.0% 62.5 63.3 64.1<br />
10.5% 59.3 60.0 60.7<br />
Valuation data<br />
Year to 03/2012a 03/2013e 03/2014e 03/2015e<br />
EV/sales 2.8 2.3 2.1 1.8<br />
EV/EBITDA 10.5 9.0 8.2 7.1<br />
EV/IC 5.8 4.8 4.1 3.5<br />
PE* 18.1 14.5 13.9 12.7<br />
P/Book value 3.3 2.8 2.4 2.1<br />
FCF yield (%) 2.8 4.6 5.0 5.5<br />
Dividend yield (%) 0.9 1.2 1.3 1.3<br />
Note: * = Based on HSBC EPS (fully diluted)<br />
Issuer <strong>in</strong>formation<br />
Share price (CHF)59.95 Target price (CHF)67.00<br />
Reuters (Equity) CFR.VX Bloomberg (Equity) CFR VX<br />
Market cap (USDm) 35,869 Market cap (CHFm) 34,423<br />
Free float (%) 91 Enterprise value (EURm) 23700<br />
Country Switzerl<strong>and</strong> Sector Textiles, Apparel & <strong>Luxury</strong><br />
Goods<br />
Erwan Rambourg Contact 852 2996 6572<br />
Anto<strong>in</strong>e Belge Contact 33 1 5652 4347<br />
Analyst Sophie Dargnies Contact 331 5652 4348<br />
Price relative<br />
65<br />
60<br />
55<br />
50<br />
45<br />
40<br />
35<br />
35<br />
Aug-10 Feb-11 Aug-11 Feb-12 Aug-12<br />
Richemont Br Rel to SMI<br />
Source: HSBC<br />
Note: price at close <strong>of</strong> 27 Aug 2012<br />
65<br />
60<br />
55<br />
50<br />
45<br />
40<br />
81
Consumer Br<strong>and</strong>s & Retail<br />
Global luxury goods<br />
September 2012<br />
abc<br />
Swatch<br />
2012 should be supported by Omega <strong>and</strong> access price po<strong>in</strong>ts<br />
While the slowdown <strong>in</strong> orders should affect Swatch <strong>in</strong> H2, we see<br />
this as limited vs. what Richemont may experience<br />
Reiterate OW with an unchanged TP <strong>of</strong> CHF500<br />
Omega <strong>and</strong> access price<br />
po<strong>in</strong>ts should show resilience<br />
While Omega may suffer from a bit <strong>of</strong> “first-mover<br />
disadvantage” <strong>in</strong> Ch<strong>in</strong>a (a bit like Louis Vuitton <strong>in</strong><br />
h<strong>and</strong>bags <strong>and</strong> accessories), we believe the br<strong>and</strong><br />
may be suffer<strong>in</strong>g less there than Rolex (very<br />
volume-driven) <strong>and</strong> Cartier (exposed to gift<strong>in</strong>g).<br />
Outside <strong>of</strong> Ch<strong>in</strong>a, however, we believe that the<br />
br<strong>and</strong> should be do<strong>in</strong>g very well this year (at least <strong>in</strong><br />
terms <strong>of</strong> sales growth) driven by retail <strong>in</strong>vestments<br />
which are f<strong>in</strong>ally start<strong>in</strong>g to put the br<strong>and</strong> on the<br />
radar <strong>in</strong> the US, the recent London Olympics’ global<br />
advertis<strong>in</strong>g campaign, <strong>and</strong> the sponsorship <strong>of</strong><br />
Skyfall, the latest James bond movie to be released<br />
at the end <strong>of</strong> this year.<br />
Access price po<strong>in</strong>ts (ie. Tissot, Long<strong>in</strong>es) <strong>in</strong> our<br />
view should cont<strong>in</strong>ue to perform well as they are<br />
mostly volume-led br<strong>and</strong>s (ie. price <strong>in</strong>creases<br />
have been m<strong>in</strong>imal so as not to alienate the<br />
consumer base). Besides, there is evidence<br />
(notably <strong>in</strong> the Hengdeli H1 results released<br />
recently) that sell-through rates have rema<strong>in</strong>ed<br />
very strong for these br<strong>and</strong>s.<br />
It’s not all about Ch<strong>in</strong>a, but still<br />
This part is common to the <strong>in</strong>vestment cases <strong>of</strong><br />
Richemont <strong>and</strong> the Swatch Group. Look<strong>in</strong>g at the<br />
recent poor sales growth at Hendgeli <strong>and</strong> given the<br />
amount <strong>of</strong> <strong>in</strong>ventory this major distributor still<br />
carries on its books (not to mention other retailers<br />
hav<strong>in</strong>g more), we believe “sell-<strong>in</strong>” growth rates for<br />
Greater Ch<strong>in</strong>a will now f<strong>in</strong>ally see a step down.<br />
This is especially true when look<strong>in</strong>g at the higherend<br />
portion <strong>of</strong> Hengdeli sales (‘Elegant” concept).<br />
As watch retailers <strong>in</strong> Greater Ch<strong>in</strong>a look to <strong>red</strong>uce<br />
excess <strong>in</strong>ventory we believe there are two options: a)<br />
to discount product to clear excess stock, or b) to<br />
order less from the br<strong>and</strong>s. We believe the only<br />
viable option (br<strong>and</strong>s <strong>and</strong> retailers still believe <strong>in</strong> the<br />
long-term growth <strong>in</strong> Ch<strong>in</strong>a) is option b <strong>and</strong> as we<br />
have seen f<strong>in</strong>ally a slowdown <strong>in</strong> Swiss Watch<br />
Exports <strong>in</strong> July (Ch<strong>in</strong>a was down 9%, HK was down<br />
1%). We expect export (ie. sell-<strong>in</strong>) to be s<strong>of</strong>t<br />
between now <strong>and</strong> the year-end <strong>in</strong> Greater Ch<strong>in</strong>a as<br />
<strong>in</strong>ventories are gradually kept <strong>in</strong> check.<br />
Swatch 2011 sales by region<br />
Greater<br />
Japan<br />
Ch<strong>in</strong>a<br />
2%<br />
Oceania<br />
38%<br />
1%<br />
Africa<br />
Asia ex<br />
1%<br />
GC ex<br />
Japan<br />
14%<br />
Europe<br />
Americas<br />
36%<br />
8%<br />
Source: Company data<br />
82
Consumer Br<strong>and</strong>s & Retail<br />
Global luxury goods<br />
September 2012<br />
abc<br />
In Greater Ch<strong>in</strong>a, we believe our “high <strong>and</strong> dry<br />
versus cheap <strong>and</strong> cheerful” theme is still valid as<br />
high-end watches, driven by corporate gift giv<strong>in</strong>g,<br />
<strong>and</strong> with<strong>in</strong> this category, the more “ma<strong>in</strong>stream”<br />
br<strong>and</strong>s like Rolex <strong>and</strong> Cartier will suffer more<br />
than those at access price po<strong>in</strong>ts.<br />
Swatch 2011 sales breakdown<br />
Electronic Systems<br />
5%<br />
Production external sales<br />
7%<br />
Low end watch<br />
segment<br />
14%<br />
High end watch<br />
segment*<br />
30%<br />
We estimate that up to two-thirds <strong>of</strong> consumers<br />
purchas<strong>in</strong>g luxury products <strong>in</strong> Ch<strong>in</strong>a are new to<br />
the br<strong>and</strong>s they buy (ie. not “repeat purchasers”)<br />
<strong>and</strong> are tak<strong>in</strong>g the view that the proportion <strong>of</strong><br />
clients “new to a br<strong>and</strong>” is greater at the lower<br />
price po<strong>in</strong>ts (Rado, Mido, Long<strong>in</strong>es, Tissot) than<br />
for the above-Omega type <strong>of</strong> price po<strong>in</strong>ts.<br />
We believe that consumers able to afford higher<br />
price po<strong>in</strong>ts are more “travelled” <strong>and</strong> exposed to<br />
negative headl<strong>in</strong>e news weigh<strong>in</strong>g on sentiment<br />
<strong>and</strong> will take the view that they can postpone a<br />
EUR10k purchase, wait<strong>in</strong>g for a better<br />
environment. We are conv<strong>in</strong>ced that corporate gift<br />
giv<strong>in</strong>g (or Guanxi) drives high-end purchases<br />
more than it drives sales <strong>of</strong> the likes <strong>of</strong> Rado,<br />
Long<strong>in</strong>es, Tissot, etc. As real estate deals are<br />
scarce <strong>and</strong> government <strong>of</strong>ficials cont<strong>in</strong>ue to be<br />
vocal aga<strong>in</strong>st corporate gift<strong>in</strong>g, we are see<strong>in</strong>g the<br />
trend <strong>of</strong> gift<strong>in</strong>g slow<strong>in</strong>g, at least temporarily.<br />
Our estimate for Greater Ch<strong>in</strong>a is that sales<br />
growth for the high-end (above Omega price<br />
po<strong>in</strong>ts) will be flat <strong>in</strong> H2 while lower-priced<br />
br<strong>and</strong>s could still grow <strong>in</strong> the mid-teens, on<br />
the back <strong>of</strong> middle-class expansion <strong>and</strong> higher<br />
wages. On those assumptions, Asia ex-Japan<br />
should underperform global trends at both<br />
Swatch <strong>and</strong> Richemont.<br />
Earn<strong>in</strong>gs, valuation <strong>and</strong> risks<br />
As compa<strong>red</strong> to Richemont, Swatch’s H2 should<br />
be supported at the P&L level by the fact that last<br />
year, the summer’s currency sw<strong>in</strong>g (strong CHF)<br />
weighed significantly on H2 marg<strong>in</strong>s at Swatch.<br />
Even though we factor <strong>in</strong> a sales slowdown, H2<br />
EBIT marg<strong>in</strong> should be better for Swatch than H1.<br />
Medium watch segment<br />
44%<br />
*Includes Breguet, Blancpa<strong>in</strong>, Glasshütte, Léon Hatot, Jacquet Droz, 50% <strong>of</strong> Omega sales<br />
Source: HSBC estimates<br />
H1 EBIT rose 19%, imply<strong>in</strong>g an 80bp EBIT marg<strong>in</strong><br />
improvement to 24.5%, mostly com<strong>in</strong>g from the<br />
Production division (+290bp to 19.2% vs HSBC<br />
17%) whilst Watches & Jewellery's marg<strong>in</strong> decl<strong>in</strong>ed<br />
slightly (-40bp to 22.2% vs HSBC 22%) due to <strong>in</strong>put<br />
cost <strong>in</strong>flation <strong>and</strong> <strong>in</strong>vestments <strong>in</strong> retail <strong>and</strong><br />
market<strong>in</strong>g. The CEO said CHF8bn (<strong>in</strong> gross sales)<br />
was still the <strong>of</strong>ficial target for FY12. Yet at the same<br />
time, he mentioned that July was up double-digit <strong>in</strong><br />
CHF (up 6-8% at constant FX accord<strong>in</strong>g to our<br />
estimates) <strong>and</strong> that H2 could potentially <strong>in</strong>crease at a<br />
double-digit growth rate <strong>in</strong> CHF: this would imply a<br />
gross sales figure closer to CHF8.1-8.2bn.<br />
We factor <strong>in</strong> an 11% group organic sales growth for<br />
2012, driven by a 12% <strong>in</strong>crease <strong>in</strong> Watches &<br />
Jewellery sales, a 20% <strong>in</strong>crease <strong>in</strong> Production <strong>and</strong> a<br />
12% decl<strong>in</strong>e <strong>in</strong> Electronic Systems. We have kept<br />
our 2012-14 EBIT estimates unchanged as positive<br />
FX (strengthen<strong>in</strong>g <strong>of</strong> the USD aga<strong>in</strong>st the CHF)<br />
should be mitigated by higher ad spend.<br />
Our DCF assumptions are unchanged (see table on<br />
page 85). Under our research model, for stocks<br />
without a volatility <strong>in</strong>dicator, the Neutral b<strong>and</strong> is<br />
5ppts above <strong>and</strong> below the hurdle rate for Swiss<br />
stocks <strong>of</strong> 7.5%. Our unchanged CHF500 target price<br />
implies a potential return <strong>of</strong> 24.4%, above the<br />
Neutral b<strong>and</strong>; therefore, we reiterate our Overweight<br />
rat<strong>in</strong>g on Swatch.<br />
83
Consumer Br<strong>and</strong>s & Retail<br />
Global luxury goods<br />
September 2012<br />
abc<br />
Potential return equals the percentage difference<br />
between the current share price <strong>and</strong> the target price,<br />
<strong>in</strong>clud<strong>in</strong>g the forecast dividend yield when <strong>in</strong>dicated.<br />
Swatch currently trades at 14.1x 2012e PE <strong>and</strong> 12.7x<br />
2013e PE. Restated for the group’s net cash pile<br />
(CHF2.5bn at end-2012e), Swatch’s cash 2013e PE<br />
would be 10.9x. We believe this is an<br />
attractive valuation.<br />
Downside risks to our rat<strong>in</strong>g <strong>in</strong>clude a slower-thanexpected<br />
return <strong>of</strong> the Production division’s EBIT<br />
marg<strong>in</strong> to the 2007 peak; watch movement shortages<br />
weigh<strong>in</strong>g on sales, negative macro news flow on<br />
Ch<strong>in</strong>a, <strong>and</strong> a stronger CHF.<br />
The Swatch Group - Results & forecasts<br />
CHFm 2005a 2006a YoY 2007a YoY 2008a YoY 2009a YoY 2010a* YoY 2011a YoY 2012e YoY 2013e YoY 2014e YoY<br />
Sales<br />
Watches & Jewellery 3,272 3,723 14 4,456 20 4,547 2 4,187 -8 5,225 25 5,953 14 6,909 16 7,489 8 8,053 8<br />
Watches Production 1,230 1,335 9 1,624 22 1,742 7 1,429 -18 1,487 4 1,972 33 2,366 20 2,568 9 2,760 8<br />
Electronics Systems 538 586 9 623 6 526 -16 391 -26 436 12 334 -23 299 -11 318 6 337 6<br />
General services 6 6 0 5 7 5 5 5 5 5 5<br />
Elim<strong>in</strong>ation <strong>in</strong>ternal sales -754 -830 10 -1,062 28 -1,145 8 -870 -24 -1,045 20 -1,500 44 -1,809 21 -1,961 8 -2,105 7<br />
Total net sales 4,292 4,820 12 5,646 17 5,677 1 5,142 -9 6,108 19 6,764 11 7,770 15 8,420 8 9,050 7<br />
Total gross sales 4,497 5,050 12 5,941 18 5,966 0 5,421 -9 6,440 19 7,143 11 8,176 14 8,854 8 9,514 7<br />
EBIT<br />
Watches 626 738 18 920 25 828 -10 804 -3 1,257 56 1,352 8 1,589 18 1,753 10 1,892 8<br />
Watches production 47 147 213 235 60 281 20 94 -67 186 98 322 73 402 25 449 12 497 11<br />
Electronics systems 78 106 36 99 -7 104 5 24 -77 62 158 13 -79 21 61 29 37 34 18<br />
General services -16 -18 13 -18 0 -11 -39 -19 73 -69 263 -73 6 -76 4 -79 4 -82 4<br />
Total 735 973 32 1,236 27 1,202 -3 903 -25 1,436 59 1,614 12 1,936 20 2,151 11 2,341 9<br />
EBIT marg<strong>in</strong><br />
Watches 19.1% 19.8% 20.6% 18.2% 19.2% 24.1% 22.7% 23.0% 23.4% 23.5%<br />
Watches production 3.8% 11.0% 14.5% 16.1% 6.6% 12.5% 16.3% 17.0% 17.5% 18.0%<br />
Electronics systems 14.5% 18.1% 15.9% 19.8% 6.1% 14.2% 3.9% 7.0% 9.0% 10.0%<br />
Total 17.1% 20.2% 21.9% 21.2% 17.6% 23.5% 23.9% 24.9% 25.6% 25.9%<br />
Net f<strong>in</strong>ancial result & associates 49 84 37 -196 46 -38 -3 35 47 59<br />
Taxes -163 -227 -258 -168 -186 -318 -335 -424 -473 -516<br />
Tax rate 20.8% 21.5% 20.3% 16.7% 19.6% 22.7% 20.8% 21.5% 21.5% 21.5%<br />
M<strong>in</strong>ority <strong>in</strong>terest -7 -3 -4 -4 -4 -6 -7 -9 -11 -13<br />
Net consolidated <strong>in</strong>come (reported) 614 827 35 1,011 22 834 -18 759 -9 1,074 42 1,269 18 1,538 21 1,714 11 1,871 9<br />
Earn<strong>in</strong>gs per bearer share (reported) 10.74 14.87 39 18.50 24 15.76 -15 14.48 -8 20.28 40 23.49 16 28.47 21 31.74 11 34.63 9<br />
Earn<strong>in</strong>gs per bearer share (HSBC) 10.55 14.87 41 18.50 24 15.76 -15 14.48 -8 20.28 40 23.49 16 28.47 21 31.74 11 34.63 9<br />
*Restated<br />
Source : company, HSBC estimates<br />
84
2<br />
4<br />
.<br />
4<br />
Consumer Br<strong>and</strong>s & Retail<br />
Global luxury goods<br />
September 2012<br />
abc<br />
F<strong>in</strong>ancials & valuation: Swatch<br />
F<strong>in</strong>ancial statements<br />
Year to 12/2011a 12/2012e 12/2013e 12/2014e<br />
Pr<strong>of</strong>it & loss summary (CHFm)<br />
Revenue 6,764 7,770 8,420 9,050<br />
EBITDA 1,843 2,174 2,399 2,599<br />
Depreciation & amortisation -229 -238 -248 -258<br />
Operat<strong>in</strong>g pr<strong>of</strong>it/EBIT 1,614 1,936 2,151 2,341<br />
Net <strong>in</strong>terest -9 35 47 59<br />
PBT 1,611 1,971 2,198 2,399<br />
HSBC PBT 1,611 1,971 2,198 2,399<br />
Taxation -335 -424 -473 -516<br />
Net pr<strong>of</strong>it 1,269 1,538 1,714 1,871<br />
HSBC net pr<strong>of</strong>it 1,269 1,538 1,714 1,871<br />
Cash flow summary (CHFm)<br />
Cash flow from operations 644 966 1,516 1,736<br />
Capex -515 -640 -450 -450<br />
Cash flow from <strong>in</strong>vestment -523 -640 -450 -450<br />
Dividends -270 -317 -385 -429<br />
Change <strong>in</strong> net debt 183 -23 -693 -867<br />
FCF equity 129 326 1,066 1,286<br />
Balance sheet summary (CHFm)<br />
Intangible fixed assets 328 558 558 558<br />
Tangible fixed assets 1,665 1,837 2,039 2,232<br />
Current assets 7,096 8,029 9,277 10,655<br />
Cash & others 2,169 2,192 2,885 3,752<br />
Total assets 9,805 11,140 12,590 14,161<br />
Operat<strong>in</strong>g liabilities 1,133 1,224 1,322 1,427<br />
Gross debt 91 91 91 91<br />
Net debt -2,078 -2,101 -2,794 -3,661<br />
Shareholders funds 8,054 9,275 10,605 12,047<br />
Invested capital 5,787 7,008 7,668 8,266<br />
Ratio, growth <strong>and</strong> per share analysis<br />
Year to 12/2011a 12/2012e 12/2013e 12/2014e<br />
Y-o-y % change<br />
Revenue 10.7 14.9 8.4 7.5<br />
EBITDA 11.2 18.0 10.3 8.3<br />
Operat<strong>in</strong>g pr<strong>of</strong>it 12.4 20.0 11.1 8.8<br />
PBT 15.2 22.3 11.5 9.2<br />
HSBC EPS 15.8 21.2 11.5 9.1<br />
Ratios (%)<br />
Revenue/IC (x) 1.3 1.2 1.1 1.1<br />
ROIC 24.4 23.8 23.0 23.1<br />
ROE 16.8 17.8 17.2 16.5<br />
ROA 13.9 14.5 14.2 13.7<br />
EBITDA marg<strong>in</strong> 27.2 28.0 28.5 28.7<br />
Operat<strong>in</strong>g pr<strong>of</strong>it marg<strong>in</strong> 23.9 24.9 25.6 25.9<br />
EBITDA/net <strong>in</strong>terest (x) 204.8<br />
Net debt/equity -25.7 -22.6 -26.3 -30.3<br />
Net debt/EBITDA (x) -1.1 -1.0 -1.2 -1.4<br />
CF from operations/net debt<br />
Per share data (CHF)<br />
EPS Rep (fully diluted) 23.49 28.47 31.74 34.63<br />
HSBC EPS (fully diluted) 23.49 28.47 31.74 34.63<br />
DPS 5.87 7.12 7.93 8.66<br />
Book value 149.11 171.71 196.33 223.02<br />
DCF analysis<br />
HSBC assumptions<br />
DCF, compris<strong>in</strong>g<br />
Overweight<br />
Risk-free rate (%) 3.00 EBIT growth 2011-21e CAGR (%) 8.8<br />
Equity premium (%) 4.50 EBIT growth 2021-41e CAGR (%) 4.0<br />
Sector beta 1.20 Fade period 2041-47e<br />
Specific beta 1.20 WACC (%) 9.48<br />
Sensitivity <strong>and</strong> valuation range (CHF/share)<br />
Cost <strong>of</strong> capital vs fade period 4 years 8 years 12 years<br />
8.5% 562 573 581<br />
9.0% 525 534 542<br />
9.5% 492 500 507<br />
10.0% 462 469 476<br />
10.5% 436 442 448<br />
Valuation data<br />
Year to 12/2011a 12/2012e 12/2013e 12/2014e<br />
EV/sales 2.7 2.3 2.1 1.8<br />
EV/EBITDA 9.9 8.4 7.3 6.4<br />
EV/IC 3.2 2.6 2.3 2.0<br />
PE* 17.1 14.1 12.7 11.6<br />
P/Book value 2.7 2.3 2.0 1.8<br />
FCF yield (%) 0.6 1.6 5.2 6.3<br />
Dividend yield (%) 1.5 1.8 2.0 2.2<br />
Note: * = Based on HSBC EPS (fully diluted)<br />
Issuer <strong>in</strong>formation<br />
Share price (CHF)401.80 Target price (CHF)500.00<br />
Reuters (Equity) UHR.VX Bloomberg (Equity) UHR VX<br />
Market cap (USDm) 21,915 Market cap (CHFm) 21,031<br />
Free float (%) 73 Enterprise value (CHFm) 18214<br />
Country Switzerl<strong>and</strong> Sector Textiles, Apparel & <strong>Luxury</strong><br />
Goods<br />
Anto<strong>in</strong>e Belge Contact 331 5652 4347<br />
Erwan Rambourg Contact 852 2996 6572<br />
Analyst Sophie Dargnies Contact 331 5652 4348<br />
Price relative<br />
478<br />
428<br />
378<br />
328<br />
278<br />
278<br />
Aug-10 Feb-11 Aug-11 Feb-12 Aug-12<br />
Swatch Rel to SMI<br />
Source: HSBC<br />
Note: price at close <strong>of</strong> 27 Aug 2012<br />
478<br />
428<br />
378<br />
328<br />
85
Consumer Br<strong>and</strong>s & Retail<br />
Global luxury goods<br />
September 2012<br />
abc<br />
Tiffany<br />
Underperformance vs peers led to three pr<strong>of</strong>it warn<strong>in</strong>gs s<strong>in</strong>ce<br />
January 2012<br />
c25% exposure to silver jewellery <strong>and</strong> higher vulnerability than<br />
European br<strong>and</strong>s to aggressive discount<strong>in</strong>g from the US ‘mom &<br />
pop” jewellers are the ma<strong>in</strong> specific issues<br />
Rema<strong>in</strong> Neutral (add<strong>in</strong>g V-flag) with an unchanged USD69 target<br />
price<br />
Strong Q4 is not a given<br />
Third pr<strong>of</strong>it warn<strong>in</strong>g s<strong>in</strong>ce January 2012<br />
S<strong>in</strong>ce January 2012, Tiffany has issued three pr<strong>of</strong>it<br />
warn<strong>in</strong>gs:<br />
On 10 January, Tiffany warned on FY Jan<br />
2012 follow<strong>in</strong>g weaker-than-expected<br />
November-December sales.<br />
On 24 May, Tiffany lowe<strong>red</strong> its FY Jan 2013<br />
EPS guidance to USD3.70-3.80, only two<br />
months after provid<strong>in</strong>g an <strong>in</strong>itial guidance <strong>of</strong><br />
USD3.95-4.05 on 20 March<br />
On 27 August, Tiffany warned aga<strong>in</strong> on FY<br />
Jan 2013 pr<strong>of</strong>its, lower<strong>in</strong>g its EPS guidance to<br />
USD3.55-3.70<br />
Underperformance <strong>in</strong> all regions except Japan<br />
With the exception <strong>of</strong> Japan, which has been a<br />
constant provider <strong>of</strong> positive surprises over the last<br />
few quarters, Tiffany has been underperform<strong>in</strong>g <strong>in</strong><br />
all regions s<strong>in</strong>ce the end <strong>of</strong> 2011.<br />
Tiffany’s sales growth at constant FX has slowed<br />
from 17% <strong>in</strong> Q3 2011 to 7% <strong>in</strong> Q4 2011, then<br />
stabilised to 8% <strong>in</strong> Q1 2012 before fall<strong>in</strong>g to 3% <strong>in</strong><br />
Q2 2012. In our universe, most companies still<br />
achieved double-digit growth at constant FX,<br />
exclud<strong>in</strong>g acquisitions <strong>in</strong> Q2 <strong>and</strong> those which did<br />
not (Tod’s, Luxottica, Coach <strong>and</strong> Hengdeli) register<br />
at least +5% growth. True, the basis <strong>of</strong> comparison<br />
was very high <strong>in</strong> Q1 <strong>and</strong> more so for Q2, as<br />
constant FX growth was +16% <strong>and</strong> +24% <strong>in</strong> Q1<br />
<strong>and</strong> Q2 last year. But that was the case for almost<br />
everybody <strong>in</strong> the <strong>in</strong>dustry, which saw an average<br />
20% growth <strong>in</strong> H1 2011.<br />
Price <strong>in</strong>creases hurt<strong>in</strong>g silver jewellery (c25%<br />
<strong>of</strong> sales)<br />
On the back <strong>of</strong> the sharp <strong>in</strong>flation <strong>in</strong> the price <strong>of</strong><br />
silver, Tiffany raised prices substantially for its<br />
silver jewellery products. Unfortunately, the<br />
customer base for silver products (which are on<br />
average much cheaper than other luxury products)<br />
reacted negatively to these price <strong>in</strong>creases, prov<strong>in</strong>g<br />
once aga<strong>in</strong> that the pric<strong>in</strong>g power <strong>of</strong> these products<br />
cannot be compa<strong>red</strong> to that <strong>of</strong> luxury goods (similar<br />
to what happened to P<strong>and</strong>ora).<br />
Aggressive discount<strong>in</strong>g from the US ‘mom &<br />
pop” jewellers<br />
In the Americas (which accounts for 49% <strong>of</strong> sales),<br />
comps have slowed sequentially from 15% <strong>in</strong><br />
86
Consumer Br<strong>and</strong>s & Retail<br />
Global luxury goods<br />
September 2012<br />
abc<br />
Q3 2011 to 3% <strong>in</strong> Q4 2011, before becom<strong>in</strong>g flat<br />
<strong>in</strong> Q1 2012 <strong>and</strong> then negative (-5%) <strong>in</strong> Q2.<br />
On top <strong>of</strong> the above-mentioned negative trends<br />
affect<strong>in</strong>g silver jewellery sales, Tiffany is always<br />
more vulnerable than its European peers to the<br />
discount<strong>in</strong>g habits <strong>of</strong> the US local ‘mom & pop’<br />
jewellers <strong>in</strong> tougher times. This is particularly true<br />
for a significant part <strong>of</strong> Tiffany’s diamond<br />
jewellery <strong>of</strong>fer<strong>in</strong>g where there is a ‘commodity’<br />
aspect – ie. basic lower-carat products for which<br />
the customer is less ready to pay a premium for<br />
the br<strong>and</strong> on top <strong>of</strong> the price <strong>of</strong> the stone when the<br />
economy is less buoyant. As a rem<strong>in</strong>der, Tiffany<br />
has a no-discount policy.<br />
Another reason beh<strong>in</strong>d Tiffany’s underperformance<br />
is that it does not benefit as much<br />
from tourist-related sales (which can account for<br />
more than 50% <strong>of</strong> European sales for European<br />
players).<br />
Beyond that, it is still a bit early to determ<strong>in</strong>e<br />
whether or not the br<strong>and</strong> <strong>in</strong>itiatives s<strong>in</strong>ce the end<br />
<strong>of</strong> 2011 <strong>in</strong> terms <strong>of</strong> product <strong>in</strong>novation <strong>and</strong><br />
merch<strong>and</strong>is<strong>in</strong>g were less impactful than before.<br />
Tiffany’s 2011 sales breakdown by region<br />
Americas<br />
49%<br />
Source: Company data<br />
Japan<br />
17%<br />
Other<br />
1%<br />
Asia Pacific<br />
21%<br />
Europe<br />
12%<br />
Earn<strong>in</strong>gs, valuation <strong>and</strong> risks<br />
Sales rose 2% <strong>in</strong> Q2 (worldwide comps down 1%,<br />
contribution from new stores +4%, FX -1%).<br />
Exclud<strong>in</strong>g one-<strong>of</strong>fs which affected Q2 last year,<br />
EBIT dropped 12% <strong>in</strong> Q2, with a 270bp EBIT<br />
marg<strong>in</strong> decl<strong>in</strong>e to 17.4%, entirely l<strong>in</strong>ked to a<br />
270bp deterioration <strong>in</strong> the gross marg<strong>in</strong>. SG&A<br />
only rose 1%, marg<strong>in</strong>ally lower than sales, but<br />
management noted a different tim<strong>in</strong>g <strong>of</strong> market<strong>in</strong>g<br />
spend<strong>in</strong>g compa<strong>red</strong> to last year (less <strong>in</strong> Q2, more<br />
<strong>in</strong> Q3). Inventories were 21% higher than a year<br />
ago (notably due to higher <strong>in</strong>put costs <strong>and</strong><br />
<strong>in</strong>creased rough diamond sourc<strong>in</strong>g). Management<br />
still expects a more moderate <strong>in</strong>crease over this<br />
fiscal year (+10%).<br />
We lower our FY 2012 EBIT estimates by 1%,<br />
<strong>and</strong> leave our FY 2013 estimates unchanged; thus<br />
our DCF-based target price is unchanged at<br />
USD69. The assumptions used to generate our<br />
DCF-derived target price are detailed on page 89.<br />
Under our research model, for stocks with a<br />
volatility <strong>in</strong>dicator, the Neutral b<strong>and</strong> is 10<br />
percentage po<strong>in</strong>ts above <strong>and</strong> below the hurdle rate<br />
for US stocks <strong>of</strong> 7.0%. Our target price <strong>of</strong> USD69<br />
implies a potential return <strong>of</strong> 10%, with<strong>in</strong> the<br />
Neutral b<strong>and</strong>; therefore, we reiterate our Neutral<br />
(V) rat<strong>in</strong>g on Tiffany. We add the volatility flag <strong>in</strong><br />
recognition <strong>of</strong> the stock’s historical volatility<br />
hav<strong>in</strong>g <strong>in</strong>creased. Potential return equals the<br />
percentage difference between the current share<br />
price <strong>and</strong> the target price, <strong>in</strong>clud<strong>in</strong>g the forecast<br />
dividend yield when <strong>in</strong>dicated.<br />
After its marked underperformance y-t-d (shares<br />
down 7% vs +21% on average for the European<br />
players, Tiffany currently trades at 14.7x calendar<br />
2013e, a 4% discount to the European peers. But<br />
we believe this valuation gap is not attractive<br />
enough to justify tak<strong>in</strong>g a risky view that the more<br />
favourable basis <strong>of</strong> comparison <strong>in</strong> Q4 will be<br />
sufficient for earn<strong>in</strong>gs growth to resume <strong>and</strong> allow<br />
the company to meet its revised guidance (Tiffany<br />
said that Q3 earn<strong>in</strong>gs should also be down y-o-y).<br />
Upside risks to our rat<strong>in</strong>g <strong>in</strong>clude stronger-thanexpected<br />
comps <strong>in</strong> the US <strong>and</strong> SG&A leverage as<br />
well as speculation that Tiffany may be a takeover<br />
target follow<strong>in</strong>g the term<strong>in</strong>ation <strong>of</strong> the watch<br />
contract with Swatch (announced on<br />
87
Consumer Br<strong>and</strong>s & Retail<br />
Global luxury goods<br />
September 2012<br />
abc<br />
11 September, 2011), which has been described as<br />
a poison pill (see FT article from 22 May 2008).<br />
Downside risks to our rat<strong>in</strong>g <strong>in</strong>clude a more<br />
pronounced US slowdown than the one embedded<br />
<strong>in</strong> our forecasts, <strong>and</strong> non-domestic <strong>in</strong>vestment<br />
weigh<strong>in</strong>g on earn<strong>in</strong>gs (stores, ad spend).<br />
Tiffany results & forecasts<br />
________________ 2011a _________________ _________2012 _________<br />
USDm FY08 FY09 FY10a Q1 Q2 Q3 Q4 FY Q1(a) Q2 (a) FY(e) FY13e FY14e<br />
Net sales 2,860.0 2,709.7 3,085.3 761.0 872.7 821.8 1,187.6 3,642.9 819.2 886.6 3,800.0 4,100.0 4,440.0<br />
Gross Pr<strong>of</strong>it 1,645.4 1,530.2 1,822.3 443.7 514.7 475.8 717.0 2,151.2 469.0 499.2 2,211.6 2,419.0 2,632.9<br />
Gross marg<strong>in</strong> 57.5% 56.5% 59.1% 58.3% 59.0% 57.9% 60.4% 59.0% 57.3% 56.3% 58.2% 59.0% 59.3%<br />
SG&A 1,172.6 1,089.7 1,227.5 307.7 374.2 329.7 431.2 1,442.7 334.0 344.6 1,456.2 1,565.5 1,682.9<br />
SG&A as % <strong>of</strong> sales 41.0% 40.2% 39.8% 40.4% 42.9% 40.1% 36.3% 39.6% 40.8% 38.9% 38.3% 38.2% 37.9%<br />
Operat<strong>in</strong>g Income reported 472.8 440.5 594.8 136.0 140.5 146.2 285.9 708.4 135.0 154.6 755.4 853.5 950.1<br />
Operat<strong>in</strong>g Income HSBC* 472.8 440.5 610.8 145.0 174.0 146.2 285.9 750.9 135.0 154.6 755.4 853.5 950.1<br />
Operat<strong>in</strong>g marg<strong>in</strong> HSBC* 16.5% 16.3% 19.8% 19.0% 19.9% 17.8% 24.1% 20.6% 16.5% 17.4% 19.9% 20.8% 21.4%<br />
Interest <strong>in</strong>come 28.9 50.5 47.3 10.1 9.6 10.4 13.3 43.5 10.6 14.3 53.0 20.0 10.0<br />
Earn<strong>in</strong>gs before tax 346.1 390.0 547.4 125.8 130.9 135.8 272.5 665.0 124.4 140.3 702.4 833.5 940.1<br />
Income taxes 126.1 124.3 179.0 44.8 40.9 46.1 94.0 225.8 42.9 48.5 242.3 287.6 324.3<br />
tax rate 36.4% 31.9% 32.7% 35.6% 31.2% 33.9% 34.5% 34.0% 34.5% 34.6% 34.5% 34.5% 34.5%<br />
Net earn<strong>in</strong>gs 220.0 264.8 368.4 81.1 90.0 89.7 178.5 439.2 81.5 91.8 460.1 546.0 615.7<br />
Net EPS common (Diluted) HSBC* 1.74 2.11 2.93 0.67 0.86 0.70 1.39 3.60 0.64 0.72 3.61 4.28 4.83<br />
Net EPS common (Diluted) reported 1.74 2.11 2.87 0.63 0.69 0.70 1.39 3.40 0.64 0.72 3.61 4.28 4.83<br />
Weighted avg com share outst. (D) 126.4 125.4 128.4 129.4 129.8 128.8 128.3 129.1 128.2 127.7 127.6 127.6 127.6<br />
Americas 1,586.6 1,410.9 1,574.6 374.7 438.2 387.7 605.1 1,805.8 386.0 434.0 1,855.3 1,986.1 2,144.4<br />
Japan 543.4 527.1 546.5 123.4 142.5 146.4 204.2 616.5 142.0 159.0 653.5 673.1 686.6<br />
Asia ex-Japan 378.6 430.0 549.2 167.2 173.2 183.2 224.6 748.2 195.0 174.0 823.0 938.3 1,069.6<br />
Europe 284.6 311.8 360.8 85.6 101.3 92.5 141.7 421.1 88.0 100.0 416.9 446.1 477.3<br />
Other 66.7 29.9 54.2 10.1 17.4 11.9 11.9 51.3 9.0 20.0 51.3 56.4 62.1<br />
Total sales 2,860.0 2,709.7 3,085.3 761.0 872.6 821.8 1,187.6 3,642.9 820.0 887.0 3,800.0 4,100.0 4,440.0<br />
Americas 55% 52% 51% 49% 50% 47% 51% 50% 47% 49% 49% 48% 48%<br />
Japan 19% 19% 18% 16% 16% 18% 17% 17% 17% 18% 17% 16% 15%<br />
Asia ex-Japan 13% 16% 18% 22% 20% 22% 19% 21% 24% 20% 22% 23% 24%<br />
Europe 10% 12% 12% 11% 12% 11% 12% 12% 11% 11% 11% 11% 11%<br />
Other 2% 1% 2% 1% 2% 1% 1% 1% 1% 2% 1% 1% 1%<br />
Total sales 100% 100% 100% 100% 100% 100% 100% 100% 100% 100% 100% 100% 100%<br />
YoY evolution<br />
Sales -3% -5% 14% 20% 30% 21% 8% 18% 8% 2% 4% 8% 8%<br />
Sell<strong>in</strong>g, G&A -3% -7% 13% 18% 37% 10% 10% 18% 9% -8% 1% 8% 8%<br />
EBIT 11% -7% 35% 29% 24% 50% 3% 19% -1% 10% 7% 13% 11%<br />
PBT -34% 13% 40% 35% 28% 61% 2% 21% -1% 7% 6% 19% 13%<br />
Net earn<strong>in</strong>gs -34% 20% 39% 26% 33% 63% -1% 19% 1% 2% 5% 19% 13%<br />
EPS Diluted (HSBC) -25% 21% 39% 39% 56% 51% -3% 23% -5% -16% 0% 19% 13%<br />
Reported sales growth<br />
Americas -10% -11% 12% 19% 25% 17% 5% 15% 3% -1% 3% 7% 8%<br />
Japan 4% -3% 7% 7% 7% 12% 12% 13% 15% 12% 6% 3% 2%<br />
Asia ex-Japan 10% 20% 29% 37% 29% 44% 19% 36% 17% 0% 10% 14% 14%<br />
Europe 17% 10% 16% 25% 32% 19% 3% 17% 3% -1% -1% 7% 7%<br />
Other -18% -55% 81% -18% 46% -18% -23% -5% -11% 15% 0% 10% 10%<br />
Total sales -3% -5% 14% 20% 30% 21% 8% 18% 8% 2% 4% 8% 8%<br />
Comp store sales<br />
Americas -14% -11% 8% 17% 23% 15% 3% 13% 0% -5% 0% 4% 5%<br />
Japan -10% -12% -4% -3% 8% 4% 4% 4% 12% 10% 8% 3% 2%<br />
Asia ex-Japan 5% 10% 14% 26% 41% 36% 13% 27% 10% -5% 3% 7% 7%<br />
Europe 6% 9% 18% 15% 11% 6% -2% 6% 0% 2% -2% 3% 3%<br />
Total sales -9% -7% 8% 15% 22% 16% 4% 13% 4% -1% 2% 4% 5%<br />
Source: Company data, HSBC estimates<br />
88
1<br />
0<br />
.<br />
0<br />
Consumer Br<strong>and</strong>s & Retail<br />
Global luxury goods<br />
September 2012<br />
abc<br />
F<strong>in</strong>ancials & valuation: Tiffany<br />
F<strong>in</strong>ancial statements<br />
Year to 01/2012a 01/2013e 01/2014e 01/2015e<br />
Pr<strong>of</strong>it & loss summary (USDm)<br />
Revenue 3,643 3,800 4,100 4,440<br />
EBITDA 854 913 1,021 1,127<br />
Depreciation & amortisation -146 -158 -167 -177<br />
Operat<strong>in</strong>g pr<strong>of</strong>it/EBIT 751 755 854 950<br />
Net <strong>in</strong>terest -43 -53 -20 -10<br />
PBT 665 702 834 940<br />
HSBC PBT 665 702 834 940<br />
Taxation -226 -242 -288 -324<br />
Net pr<strong>of</strong>it 439 460 546 616<br />
HSBC net pr<strong>of</strong>it 465 460 546 616<br />
Cash flow summary (USDm)<br />
Cash flow from operations 196 408 569 637<br />
Capex -239 -230 -248 -268<br />
Cash flow from <strong>in</strong>vestment -239 -230 -248 -268<br />
Dividends -143 -161 -181 -202<br />
Change <strong>in</strong> net debt 323 40 -137 -163<br />
FCF equity -74 145 285 330<br />
Balance sheet summary (USDm)<br />
Intangible fixed assets 0 0 0 0<br />
Tangible fixed assets 767 840 921 1,012<br />
Current assets 2,807 3,022 3,353 3,725<br />
Cash & others 442 402 539 702<br />
Total assets 4,159 4,447 4,859 5,322<br />
Operat<strong>in</strong>g liabilities 1,098 1,111 1,125 1,139<br />
Gross debt 712 712 712 712<br />
Net debt 270 310 173 10<br />
Shareholders funds 2,349 2,626 3,027 3,479<br />
Invested capital 2,034 2,349 2,610 2,896<br />
Ratio, growth <strong>and</strong> per share analysis<br />
Year to 01/2012a 01/2013e 01/2014e 01/2015e<br />
Y-o-y % change<br />
Revenue 18.1 4.3 7.9 8.3<br />
EBITDA 15.0 6.9 11.8 10.4<br />
Operat<strong>in</strong>g pr<strong>of</strong>it 22.9 0.6 13.0 11.3<br />
PBT 21.5 5.6 18.7 12.8<br />
HSBC EPS 23.1 0.0 18.7 12.8<br />
Ratios (%)<br />
Revenue/IC (x) 2.0 1.7 1.7 1.6<br />
ROIC 25.1 22.6 22.5 22.6<br />
ROE 20.6 18.5 19.3 18.9<br />
ROA 11.9 11.5 12.0 12.2<br />
EBITDA marg<strong>in</strong> 23.5 24.0 24.9 25.4<br />
Operat<strong>in</strong>g pr<strong>of</strong>it marg<strong>in</strong> 20.6 19.9 20.8 21.4<br />
EBITDA/net <strong>in</strong>terest (x) 19.7 17.2 51.0 112.7<br />
Net debt/equity 11.5 11.8 5.7 0.3<br />
Net debt/EBITDA (x) 0.3 0.3 0.2 0.0<br />
CF from operations/net debt 72.6 131.4 328.4 6425.6<br />
Per share data (USD)<br />
EPS Rep (fully diluted) 3.40 3.61 4.28 4.83<br />
HSBC EPS (fully diluted) 3.60 3.61 4.28 4.83<br />
DPS 1.16 1.28 1.43 1.61<br />
Book value 18.39 20.74 23.90 27.47<br />
DCF analysis<br />
HSBC assumptions<br />
DCF, compris<strong>in</strong>g<br />
Neutral (V)<br />
Risk-free rate (%) 3.00 EBIT growth 2011-21e CAGR (%) 7.8<br />
Equity premium (%) 4.00 EBIT growth 2021-41e CAGR (%) 4.0<br />
Sector beta 1.20 Fade period 2041-47e<br />
Specific beta 1.20 WACC (%) 8.74<br />
Sensitivity <strong>and</strong> valuation range (USD/share)<br />
Cost <strong>of</strong> capital vs fade period 4 years 8 years 12 years<br />
7.7% 79 81 83<br />
8.2% 73 75 76<br />
8.7% 68 69 70<br />
9.2% 63 64 65<br />
9.7% 58 59 60<br />
Valuation data<br />
Year to 01/2012a 01/2013e 01/2014e 01/2015e<br />
EV/sales 2.3 2.2 2.0 1.8<br />
EV/EBITDA 9.6 9.0 8.0 7.1<br />
EV/IC 4.0 3.5 3.1 2.7<br />
PE* 17.4 17.4 14.7 13.0<br />
P/Book value 3.4 3.0 2.6 2.3<br />
FCF yield (%) -0.9 1.8 3.6 4.2<br />
Dividend yield (%) 1.8 2.0 2.3 2.6<br />
Note: * = Based on HSBC EPS (fully diluted)<br />
Issuer <strong>in</strong>formation<br />
Share price (USD)62.71 Target price (USD)69.00<br />
Reuters (Equity) TIF.N Bloomberg (Equity) TIF US<br />
Market cap (USDm) 7,941 Market cap (USDm) 7,941<br />
Free float (%) 100 Enterprise value (USDm) 8252<br />
Country United States Sector Specialty Retail<br />
Analyst Anto<strong>in</strong>e Belge Contact 33 1 5652 4347<br />
Erwan Rambourg Contact 852 2996 6572<br />
Sophie Dargnies Contact 331 5652 4348<br />
Price relative<br />
94<br />
84<br />
74<br />
64<br />
54<br />
44<br />
34<br />
34<br />
Aug-10 Feb-11 Aug-11 Feb-12 Aug-12<br />
Tiffany Rel to S&P 500<br />
Source: HSBC<br />
Note: price at close <strong>of</strong> 27 Aug 2012<br />
94<br />
84<br />
74<br />
64<br />
54<br />
44<br />
89
Consumer Br<strong>and</strong>s & Retail<br />
Global luxury goods<br />
September 2012<br />
abc<br />
Tod’s<br />
Tod’s br<strong>and</strong> itself (55% <strong>of</strong> sales <strong>in</strong> 2011) amongst the <strong>in</strong>dustry<br />
best performers<br />
But Hogan <strong>and</strong> Fay (whose sales exposure to the Italian market is<br />
over 90%) are dragg<strong>in</strong>g, result<strong>in</strong>g <strong>in</strong> lower sales <strong>and</strong> earn<strong>in</strong>gs<br />
growth relative to peers<br />
Rema<strong>in</strong> Neutral <strong>and</strong> <strong>in</strong>crease target price to EUR90 (from EUR81)<br />
on higher estimates<br />
Tod’s performance blur<strong>red</strong> by<br />
Hogan <strong>and</strong> Fay<br />
Tod’s br<strong>and</strong> itself (55% <strong>of</strong> sales <strong>in</strong> 2011) amongst<br />
the <strong>in</strong>dustry best performers<br />
Whilst the Tod’s group as whole underperformed<br />
the <strong>in</strong>dustry <strong>in</strong> both Q1 <strong>and</strong> Q2 2012 (7% organic<br />
sales growth), the Tod’s br<strong>and</strong> itself (55% <strong>of</strong><br />
group sales <strong>in</strong> 2011) cont<strong>in</strong>ued to grow strongly <strong>in</strong><br />
terms <strong>of</strong> sales.<br />
We believe the ma<strong>in</strong> reasons for the strong<br />
performance <strong>of</strong> the Tod’s br<strong>and</strong> are the follow<strong>in</strong>g:<br />
A dist<strong>in</strong>ctive position<strong>in</strong>g: The Tod’s br<strong>and</strong> has<br />
a dist<strong>in</strong>ctive position<strong>in</strong>g (classic, discreet,<br />
comfortable, yet perceived as luxury) which<br />
makes the br<strong>and</strong> less vulnerable to ‘trad<strong>in</strong>g less’<br />
from European customers (<strong>in</strong>clud<strong>in</strong>g Italians).<br />
The non-reliance on logo products: This is a<br />
positive at a time when Asian consumers are<br />
becom<strong>in</strong>g more sophisticated <strong>and</strong> mov<strong>in</strong>g away<br />
from logo products (as outl<strong>in</strong>ed <strong>in</strong> the thematic<br />
section <strong>of</strong> this report).<br />
A better geographic sales mix than the<br />
overall group: Whilst the overall group’s<br />
geographic mix was Italy (51%), Rest <strong>of</strong> Europe<br />
(20%), North America (7%) <strong>and</strong> Rest <strong>of</strong> the<br />
World (22%), the geographic mix <strong>of</strong> the Tod’s<br />
br<strong>and</strong> itself is more favourable <strong>and</strong> diverse: Italy<br />
at c25%, Rest <strong>of</strong> Europe at c25-30%, North<br />
America at 10-15% <strong>and</strong> Rest <strong>of</strong> the World at<br />
c35% (accord<strong>in</strong>g to our estimates).<br />
The br<strong>and</strong> is an emerg<strong>in</strong>g br<strong>and</strong> outside<br />
Europe: The Tod’s br<strong>and</strong> accounts for most <strong>of</strong><br />
the group sales outside Europe, which grew<br />
47% <strong>in</strong> H1 2012 (with Ch<strong>in</strong>a outpac<strong>in</strong>g this<br />
trend). In our view, Tod’s is clearly not at risk<br />
from our ‘first-mover disadvantage’ theme<br />
outl<strong>in</strong>ed on page 19.<br />
Roger Vivier a (small) gem<br />
Roger Vivier represented only 3% <strong>of</strong> sales <strong>in</strong> 2011,<br />
but its sales more than doubled <strong>in</strong> H1 2012,<br />
overtak<strong>in</strong>g Fay as the number 3 br<strong>and</strong> <strong>in</strong> size with<strong>in</strong><br />
the group.<br />
Hogan <strong>and</strong> Fay dragg<strong>in</strong>g<br />
Italy represented 50% <strong>of</strong> the total group sales <strong>in</strong><br />
2011, <strong>of</strong> which c55% was from Hogan, c20% from<br />
Fay <strong>and</strong> c25% from the Tod’s br<strong>and</strong> itself, plus<br />
Roger Vivier. Hogan <strong>and</strong> Fay, which are ma<strong>in</strong>ly<br />
90
Consumer Br<strong>and</strong>s & Retail<br />
Global luxury goods<br />
September 2012<br />
abc<br />
exposed to the Italian market (c90% for Hogan <strong>and</strong><br />
c95% for Fay) are suffer<strong>in</strong>g more than the Tod’s<br />
br<strong>and</strong> itself (with c15-20% <strong>of</strong> sales from Italy) even<br />
<strong>in</strong> Italy, as Hogan <strong>and</strong> Fay are not as well-known as<br />
Tod’s with tourists. Both br<strong>and</strong>s saw a worsen<strong>in</strong>g <strong>of</strong><br />
their overall sales trends <strong>in</strong> Q2 2012 compa<strong>red</strong> to<br />
Q1: Hogan (-29% at constant FX vs -2%), Fay (-<br />
17% vs -2%) <strong>and</strong> were the ma<strong>in</strong> culprits for the<br />
deterioration <strong>of</strong> group trends <strong>in</strong> Italy (-25% <strong>in</strong> Q2 vs<br />
-4% <strong>in</strong> Q1).<br />
The distribution rationalisation <strong>of</strong> Hogan also<br />
impacted sales. In Italy, the number <strong>of</strong> <strong>in</strong>dependent<br />
retailers distribut<strong>in</strong>g Hogan has been <strong>red</strong>uced by<br />
c10%.<br />
Earn<strong>in</strong>gs, valuation <strong>and</strong> risks<br />
Q2 EBITDA came <strong>in</strong> at EUR60m, up 18% y-o-y<br />
<strong>and</strong> implied a 150bp EBITDA marg<strong>in</strong> improvement<br />
to 27.3%. As expected, Tod’s was able to recoup<br />
part <strong>of</strong> the EBITDA decl<strong>in</strong>e seen <strong>in</strong> Q1 as the<br />
phas<strong>in</strong>g <strong>of</strong> communication cost was skewed towards<br />
Q1 (vs Q2 <strong>and</strong> to a lesser extent Q3 last year). For<br />
H1 overall, EBITDA marg<strong>in</strong> decl<strong>in</strong>ed 70bp (with<br />
management mention<strong>in</strong>g higher rents).<br />
By channel, organic sales growth was +15% <strong>in</strong> retail<br />
<strong>in</strong> Q2 (vs +17% <strong>in</strong> Q1) <strong>and</strong> down 9% <strong>in</strong> wholesale<br />
<strong>in</strong> Q2 (vs +1% <strong>in</strong> Q1). Same store sales growth <strong>in</strong><br />
euro terms accelerated <strong>in</strong> May-July, lead<strong>in</strong>g to a<br />
+10.6% YTD trend compa<strong>red</strong> to +7.8% up to the<br />
beg<strong>in</strong>n<strong>in</strong>g <strong>of</strong> May. The weaker EUR clearly helped,<br />
but accord<strong>in</strong>g to management, trends also<br />
accelerated at constant FX <strong>in</strong> May-July.<br />
Management confirmed that the wholesale order<br />
book for FY12 was flat y-o-y. Management does not<br />
expect Italy to get worse (H2 should be quite similar<br />
to H1), <strong>and</strong> believes that the US can grow at least<br />
25% <strong>in</strong> euro terms over FY 2012 (H1 was up 30% <strong>in</strong><br />
euro terms <strong>and</strong> +23% at constant FX). They also<br />
mentioned that growth rates accelerated <strong>in</strong> Ch<strong>in</strong>a <strong>in</strong><br />
Q2. Prices have <strong>in</strong>creased by 2-3% y-t-d on average.<br />
The group opened 7 stores <strong>in</strong> H1 <strong>and</strong> said it would<br />
open 20 over the FY 2012.<br />
Dur<strong>in</strong>g the conference call, management mentioned<br />
that the 6.5% reported sales <strong>in</strong>crease <strong>and</strong> the 26.1%<br />
EBITDA marg<strong>in</strong> expected by consensus (ie a 10bp<br />
improvement) was ‘feasible’. We expect a 20bp<br />
<strong>in</strong>crease <strong>in</strong> EBITDA marg<strong>in</strong> to 26.2% <strong>in</strong> 2012. On<br />
that basis, Tod’s as a group should be generat<strong>in</strong>g<br />
lower sales <strong>and</strong> earn<strong>in</strong>gs growth compa<strong>red</strong> to peers.<br />
We <strong>in</strong>crease our 2012, 2013 <strong>and</strong> 2014 EPS estimates<br />
by 7%, 10% <strong>and</strong> 9%, respectively, on the back <strong>of</strong><br />
higher sales growth <strong>in</strong> Asia, the stronger euro <strong>and</strong> a<br />
lower tax rate assumption (29.5% vs 32%). The<br />
lower tax rate alone has a +4% impact.<br />
All <strong>in</strong> all, we <strong>in</strong>crease our DCF-based target price<br />
from EUR81 to EUR90 on the back <strong>of</strong> our estimate<br />
changes (see above). The assumptions used to<br />
generate our DCF-derived target price are detailed<br />
on page 93. Tod’s is currently trad<strong>in</strong>g at 17.0x 2012e<br />
<strong>and</strong> 15.3x 2013e PE, <strong>in</strong> l<strong>in</strong>e with the sector.<br />
Under our research model, for stocks without a<br />
volatility <strong>in</strong>dicator, the Neutral b<strong>and</strong> is 5ppts above<br />
<strong>and</strong> below the hurdle rate for Europe ex-UK stocks<br />
<strong>of</strong> 9%. Our new target price implies a potential<br />
return <strong>of</strong> 6.5%, with<strong>in</strong> the Neutral b<strong>and</strong>; we<br />
therefore reiterate Neutral. Potential return equals the<br />
percentage difference between the current share<br />
price <strong>and</strong> the target price, <strong>in</strong>clud<strong>in</strong>g the forecast<br />
dividend yield when <strong>in</strong>dicated.<br />
Downside risks to our rat<strong>in</strong>g <strong>in</strong>clude: (i) longer-thanexpected<br />
economic downturn <strong>in</strong> Italy; (ii) failure to<br />
exp<strong>and</strong> significantly beyond shoes, <strong>and</strong> (iii) new sale<br />
<strong>of</strong> shares by the family, which has repeatedly said<br />
that it wanted to <strong>in</strong>crease the free float <strong>and</strong> only has<br />
more than 50% (currently, the Della Valle family<br />
holds c57%).<br />
Upside risks <strong>in</strong>clude a faster-than-expected recovery<br />
<strong>of</strong> the Hogan’s br<strong>and</strong>.<br />
91
Consumer Br<strong>and</strong>s & Retail<br />
Global luxury goods<br />
September 2012<br />
abc<br />
Tod's - FY results <strong>and</strong> forecasts<br />
Year end December (EURm) 2004a 2005a 2006a 2007a 2008a 2009a 2010a 2011a 2012e 2013e 2014e<br />
Net Sales 421 503 573 657 708 713 788 894 975 1,060 1,135<br />
Change <strong>in</strong> percent 13.3% 19.5% 13.9% 14.7% 7.7% 0.8% 10.4% 13.5% 9.1% 8.7% 7.1%<br />
Total production costs 336 396 445 517 567 570 613 677 736 796 845<br />
as % <strong>of</strong> sales 79.8% 78.7% 77.6% 78.7% 80.1% 79.9% 77.9% 75.8% 75.5% 75.1% 74.5%<br />
Change <strong>in</strong> percent 8.7% 17.8% 12.4% 16.3% 9.6% 0.6% 7.6% 10.4% 8.7% 8.1% 6.2%<br />
EBITDA 89 113 137 153 155 159 193 232 255 280 306<br />
as % <strong>of</strong> sales 21.1% 22.4% 24.0% 23.3% 22.0% 22.2% 24.5% 26.0% 26.2% 26.5% 27.0%<br />
Change <strong>in</strong> percent 15.9% 27.0% 21.8% 11.3% 1.6% 2.0% 21.7% 20.4% 9.7% 10.0% 9.1%<br />
Amortization <strong>and</strong> reserves 22 23 24 27 30 32 33 38 40 43 47<br />
EBIT 67 90 114 126 126 126 160 195 215 237 259<br />
Percent <strong>of</strong> revenue 15.9% 17.9% 19.9% 19.3% 17.8% 17.7% 20.3% 21.8% 22.0% 22.4% 22.8%<br />
Change <strong>in</strong> percent 53.4% 34.3% 26.3% 11.2% -0.5% 0.5% 26.5% 21.7% 10.4% 10.3% 9.3%<br />
F<strong>in</strong>ancial Income 0 2 -1 0 -1 0 3 2 2 4 6<br />
Income before Taxes 67 92 113 127 125 127 163 197 217 241 265<br />
Percent <strong>of</strong> revenue 15.9% 18.3% 19.7% 19.3% 17.7% 17.7% 20.7% 22.0% 22.2% 22.7% 23.4%<br />
Change <strong>in</strong> percent 44.7% 37.2% 23.2% 11.9% -1.2% 1.1% 29.1% 20.6% 10.1% 11.2% 10.0%<br />
Taxes 28 38 46 48 41 40 53 61 64 71 78<br />
Tax rate 42.1% 41.4% 41.0% 37.8% 33.2% 31.9% 32.2% 31.1% 29.5% 29.5% 29.5%<br />
M<strong>in</strong>ority <strong>in</strong>terests 0 1 1 1 1 0 2 1 1 1 1<br />
Consolidated net Pr<strong>of</strong>it 38 53 66 77 83 86 109 135 152 169 186<br />
Percent <strong>of</strong> revenue 9.1% 10.6% 11.5% 11.8% 11.7% 12.0% 13.8% 15.1% 15.6% 16.0% 16.4%<br />
Change <strong>in</strong> percent 49.4% 38.7% 23.8% 17.1% 6.7% 3.8% 27.3% 23.8% 12.7% 11.2% 10.0%<br />
EPS diluted 1.24 1.68 2.08 2.43 2.66 2.80 3.56 4.41 4.97 5.53 6.08<br />
Variation % 36% 24% 17% 9% 5% 27% 24% 13% 11% 10%<br />
Source: Company data, HSBC estimates<br />
Tod's - FY sales by segment<br />
Year end December (EURm) 2004a 2005a 2006a 2007a 2008a 2009a 2010a 2011 2012e 2013e 2014e Split <strong>in</strong><br />
2004<br />
Sales by br<strong>and</strong><br />
Tod's 240 289 326 348 357 349 407 488 569 629 676 57% 60%<br />
Hogan 102 126 155 200 239 257 268 281 256 263 271 24% 24%<br />
Fay 69 77 82 90 93 92 90 88 79 79 81 16% 7%<br />
Other 10 11 9 20 19 16 23 37 71 89 107 2% 9%<br />
Total 421 503 573 657 708 713 788 894 975 1,060 1,135<br />
Sales by product category<br />
Shoes 268 315 358 427 486 506 565 647 715 784 842 64% 74%<br />
Leather goods & accessories 85 112 133 139 127 111 123 145 164 180 194 20% 17%<br />
Apparel 67 75 81 89 95 95 99 102 95 95 98 16% 9%<br />
Other 1 1 1 1 1 1 1 1 1 1 1 0% 0%<br />
Total 421 503 573 657 708 713 788 894 975 1,060 1,135<br />
Sales by channel<br />
DOS 220 259 283 318 336 349 404 474 565 610 664 52% 59%<br />
Third parties 201 244 290 339 372 364 384 420 410 434 459 48% 41%<br />
Total 421 503 573 657 708 713 788 894 975 1,044 1,123<br />
Sales by region<br />
Italy 205 241 280 334 384 405 426 449 399 404 412 49% 36%<br />
Europe 117 135 145 161 161 151 164 182 197 205 213 28% 19%<br />
North America 50 57 60 66 59 46 53 62 80 86 93 12% 8%<br />
Rest <strong>of</strong> World 50 70 88 97 103 111 145 200 300 365 418 12% 37%<br />
Total 421 503 573 657 708 713 788 894 975 1,060 1,135<br />
Source: Company data, HSBC estimates<br />
Split <strong>in</strong><br />
2014e<br />
92
6<br />
.<br />
5<br />
Consumer Br<strong>and</strong>s & Retail<br />
Global luxury goods<br />
September 2012<br />
abc<br />
F<strong>in</strong>ancials & valuation: TOD'S<br />
F<strong>in</strong>ancial statements<br />
Year to 12/2011a 12/2012e 12/2013e 12/2014e<br />
Pr<strong>of</strong>it & loss summary (EURm)<br />
Revenue 894 975 1,060 1,135<br />
EBITDA 232 255 280 306<br />
Depreciation & amortisation -38 -40 -43 -47<br />
Operat<strong>in</strong>g pr<strong>of</strong>it/EBIT 195 215 237 259<br />
Net <strong>in</strong>terest 2 2 4 6<br />
PBT 197 217 241 265<br />
HSBC PBT 197 217 241 265<br />
Taxation -61 -64 -71 -78<br />
Net pr<strong>of</strong>it 135 152 169 186<br />
HSBC net pr<strong>of</strong>it 135 152 169 186<br />
Cash flow summary (EURm)<br />
Cash flow from operations 129 166 198 212<br />
Capex -68 -50 -50 -49<br />
Cash flow from <strong>in</strong>vestment -68 -50 -50 -49<br />
Dividends -61 -78 -88 -97<br />
Change <strong>in</strong> net debt -14 -29 -51 -163<br />
FCF equity 62 117 149 164<br />
Balance sheet summary (EURm)<br />
Intangible fixed assets 202 202 202 202<br />
Tangible fixed assets 191 201 207 209<br />
Current assets 602 673 755 954<br />
Cash & others 188 217 267 431<br />
Total assets 1,044 1,125 1,213 1,414<br />
Operat<strong>in</strong>g liabilities 215 231 247 262<br />
Gross debt 77 77 77 77<br />
Net debt -111 -139 -190 -354<br />
Shareholders funds 683 748 819 1,006<br />
Invested capital 593 628 650 672<br />
Ratio, growth <strong>and</strong> per share analysis<br />
Year to 12/2011a 12/2012e 12/2013e 12/2014e<br />
Y-o-y % change<br />
Revenue 13.5 9.1 8.7 7.1<br />
EBITDA 20.4 9.7 10.0 9.1<br />
Operat<strong>in</strong>g pr<strong>of</strong>it 21.7 10.4 10.3 9.3<br />
PBT 20.6 10.1 11.2 10.0<br />
HSBC EPS 23.8 12.7 11.2 10.0<br />
Ratios (%)<br />
Revenue/IC (x) 1.6 1.6 1.7 1.7<br />
ROIC 24.1 24.8 26.1 27.6<br />
ROE 20.9 21.3 21.6 20.4<br />
ROA 13.8 14.1 14.5 14.2<br />
EBITDA marg<strong>in</strong> 26.0 26.2 26.5 27.0<br />
Operat<strong>in</strong>g pr<strong>of</strong>it marg<strong>in</strong> 21.8 22.0 22.4 22.8<br />
EBITDA/net <strong>in</strong>terest (x)<br />
Net debt/equity -16.1 -18.5 -23.1 -35.0<br />
Net debt/EBITDA (x) -0.5 -0.5 -0.7 -1.2<br />
CF from operations/net debt<br />
Per share data (EUR)<br />
EPS Rep (fully diluted) 4.41 4.97 5.53 6.08<br />
HSBC EPS (fully diluted) 4.41 4.97 5.53 6.08<br />
DPS 2.54 2.86 3.18 3.50<br />
Book value 22.58 24.72 27.09 33.24<br />
DCF analysis<br />
HSBC assumptions<br />
DCF, compris<strong>in</strong>g<br />
Neutral (V)<br />
Risk-free rate (%) 3.00 EBIT growth 2011-21e CAGR (%) 8.8<br />
Equity premium (%) 6.00 EBIT growth 2021-41e CAGR (%) 4.3<br />
Sector beta 1.20 Fade period 2041-47e<br />
Specific beta 1.00 WACC (%) 10.20<br />
Sensitivity <strong>and</strong> valuation range (EUR/share)<br />
Cost <strong>of</strong> capital vs fade period 4 years 8 years 12 years<br />
9.8% 93.0 94.7 96.0<br />
10.0% 90.7 92.3 93.6<br />
10.2% 88.5 90.0 91.2<br />
10.4% 86.5 87.8 89.0<br />
10.6% 84.4 85.7 86.9<br />
Valuation data<br />
Year to 12/2011a 12/2012e 12/2013e 12/2014e<br />
EV/sales 2.8 2.5 2.3 2.0<br />
EV/EBITDA 10.7 9.6 8.5 7.3<br />
EV/IC 4.2 3.9 3.7 3.3<br />
PE* 19.2 17.0 15.3 13.9<br />
P/Book value 3.7 3.4 3.1 2.5<br />
FCF yield (%) 2.4 4.5 5.8 6.3<br />
Dividend yield (%) 3.0 3.4 3.8 4.1<br />
Note: * = Based on HSBC EPS (fully diluted)<br />
Issuer <strong>in</strong>formation<br />
Share price (EUR)84.50 Target price (EUR)90.00<br />
Reuters (Equity) TOD.MI Bloomberg (Equity) TOD IM<br />
Market cap (USDm) 3,237 Market cap (EURm) 2,586<br />
Free float (%) 39 Enterprise value (EURm) 2447<br />
Country Italy Sector Textiles, Apparel & <strong>Luxury</strong><br />
Goods<br />
Analyst Sophie Dargnies Contact 331 5652 4348<br />
Erwan Rambourg Contact 852 2996 6572<br />
Anto<strong>in</strong>e Belge Contact 331 5652 4347<br />
Price relative<br />
120<br />
120<br />
110<br />
110<br />
100<br />
100<br />
90<br />
90<br />
80<br />
80<br />
70<br />
70<br />
60<br />
60<br />
50<br />
50<br />
Aug-10 Feb-11 Aug-11 Feb-12 Aug-12<br />
TOD'S Rel to BCI ALL-SHARE INDEX<br />
Source: HSBC<br />
Note: price at close <strong>of</strong> 27 Aug 2012<br />
93
Consumer Br<strong>and</strong>s & Retail<br />
Global luxury goods<br />
September 2012<br />
abc<br />
Notes<br />
94
Consumer Br<strong>and</strong>s & Retail<br />
Global luxury goods<br />
September 2012<br />
abc<br />
Notes<br />
95
Consumer Br<strong>and</strong>s & Retail<br />
Global luxury goods<br />
September 2012<br />
abc<br />
Notes<br />
96
Consumer Br<strong>and</strong>s & Retail<br />
Global luxury goods<br />
September 2012<br />
abc<br />
Disclosure appendix<br />
Analyst Certification<br />
The follow<strong>in</strong>g analyst(s), economist(s), <strong>and</strong>/or strategist(s) who is(are) primarily responsible for this report, certifies(y) that the<br />
op<strong>in</strong>ion(s) on the subject security(ies) or issuer(s) <strong>and</strong>/or any other views or forecasts expressed here<strong>in</strong> accurately reflect their<br />
personal view(s) <strong>and</strong> that no part <strong>of</strong> their compensation was, is or will be directly or <strong>in</strong>directly related to the specific<br />
recommendation(s) or views conta<strong>in</strong>ed <strong>in</strong> this research report: Erwan Rambourg, Anto<strong>in</strong>e Belge <strong>and</strong> Sophie Dargnies<br />
Important disclosures<br />
Stock rat<strong>in</strong>gs <strong>and</strong> basis for f<strong>in</strong>ancial analysis<br />
HSBC believes that <strong>in</strong>vestors utilise various discipl<strong>in</strong>es <strong>and</strong> <strong>in</strong>vestment horizons when mak<strong>in</strong>g <strong>in</strong>vestment decisions, which<br />
depend largely on <strong>in</strong>dividual circumstances such as the <strong>in</strong>vestor's exist<strong>in</strong>g hold<strong>in</strong>gs, risk tolerance <strong>and</strong> other considerations.<br />
Given these differences, HSBC has two pr<strong>in</strong>cipal aims <strong>in</strong> its equity research: 1) to identify long-term <strong>in</strong>vestment opportunities<br />
based on particular themes or ideas that may affect the future earn<strong>in</strong>gs or cash flows <strong>of</strong> companies on a 12 month time horizon;<br />
<strong>and</strong> 2) from time to time to identify short-term <strong>in</strong>vestment opportunities that are derived from fundamental, quantitative,<br />
technical or event-driven techniques on a 0-3 month time horizon <strong>and</strong> which may differ from our long-term <strong>in</strong>vestment rat<strong>in</strong>g.<br />
HSBC has assigned rat<strong>in</strong>gs for its long-term <strong>in</strong>vestment opportunities as described below.<br />
This report addresses only the long-term <strong>in</strong>vestment opportunities <strong>of</strong> the companies refer<strong>red</strong> to <strong>in</strong> the report. As <strong>and</strong> when<br />
HSBC publishes a short-term trad<strong>in</strong>g idea the stocks to which these relate are identified on the website at<br />
www.hsbcnet.com/research. Details <strong>of</strong> these short-term <strong>in</strong>vestment opportunities can be found under the Reports section <strong>of</strong> this<br />
website.<br />
HSBC believes an <strong>in</strong>vestor's decision to buy or sell a stock should depend on <strong>in</strong>dividual circumstances such as the <strong>in</strong>vestor's<br />
exist<strong>in</strong>g hold<strong>in</strong>gs <strong>and</strong> other considerations. Different securities firms use a variety <strong>of</strong> rat<strong>in</strong>gs terms as well as different rat<strong>in</strong>g<br />
systems to describe their recommendations. Investors should carefully read the def<strong>in</strong>itions <strong>of</strong> the rat<strong>in</strong>gs used <strong>in</strong> each research<br />
report. In addition, because research reports conta<strong>in</strong> more complete <strong>in</strong>formation concern<strong>in</strong>g the analysts' views, <strong>in</strong>vestors<br />
should carefully read the entire research report <strong>and</strong> should not <strong>in</strong>fer its contents from the rat<strong>in</strong>g. In any case, rat<strong>in</strong>gs should not<br />
be used or relied on <strong>in</strong> isolation as <strong>in</strong>vestment advice.<br />
Rat<strong>in</strong>g def<strong>in</strong>itions for long-term <strong>in</strong>vestment opportunities<br />
Stock rat<strong>in</strong>gs<br />
HSBC assigns rat<strong>in</strong>gs to its stocks <strong>in</strong> this sector on the follow<strong>in</strong>g basis:<br />
For each stock we set a requi<strong>red</strong> rate <strong>of</strong> return calculated from the cost <strong>of</strong> equity for that stock’s domestic or, as appropriate,<br />
regional market established by our strategy team. The price target for a stock represents the value the analyst expects the stock<br />
to reach over our performance horizon. The performance horizon is 12 months. For a stock to be classified as Overweight, the<br />
potential return, which equals the percentage difference between the current share price <strong>and</strong> the target price, <strong>in</strong>clud<strong>in</strong>g the<br />
forecast dividend yield when <strong>in</strong>dicated, must exceed the requi<strong>red</strong> return by at least 5 percentage po<strong>in</strong>ts over the next 12 months<br />
(or 10 percentage po<strong>in</strong>ts for a stock classified as Volatile*). For a stock to be classified as Underweight, the stock must be<br />
expected to underperform its requi<strong>red</strong> return by at least 5 percentage po<strong>in</strong>ts over the next 12 months (or 10 percentage po<strong>in</strong>ts<br />
for a stock classified as Volatile*). Stocks between these b<strong>and</strong>s are classified as Neutral.<br />
Our rat<strong>in</strong>gs are re-calibrated aga<strong>in</strong>st these b<strong>and</strong>s at the time <strong>of</strong> any 'material change' (<strong>in</strong>itiation <strong>of</strong> coverage, change <strong>of</strong> volatility<br />
status or change <strong>in</strong> price target). Notwithst<strong>and</strong><strong>in</strong>g this, <strong>and</strong> although rat<strong>in</strong>gs are subject to ongo<strong>in</strong>g management review,<br />
expected returns will be permitted to move outside the b<strong>and</strong>s as a result <strong>of</strong> normal share price fluctuations without necessarily<br />
trigger<strong>in</strong>g a rat<strong>in</strong>g change.<br />
97
Consumer Br<strong>and</strong>s & Retail<br />
Global luxury goods<br />
September 2012<br />
abc<br />
*A stock will be classified as volatile if its historical volatility has exceeded 40%, if the stock has been listed for less than 12<br />
months (unless it is <strong>in</strong> an <strong>in</strong>dustry or sector where volatility is low) or if the analyst expects significant volatility. However,<br />
stocks which we do not consider volatile may <strong>in</strong> fact also behave <strong>in</strong> such a way. Historical volatility is def<strong>in</strong>ed as the past<br />
month's average <strong>of</strong> the daily 365-day mov<strong>in</strong>g average volatilities. In order to avoid mislead<strong>in</strong>gly frequent changes <strong>in</strong> rat<strong>in</strong>g,<br />
however, volatility has to move 2.5 percentage po<strong>in</strong>ts past the 40% benchmark <strong>in</strong> either direction for a stock's status to change.<br />
Rat<strong>in</strong>g distribution for long-term <strong>in</strong>vestment opportunities<br />
As <strong>of</strong> 31 August 2012, the distribution <strong>of</strong> all rat<strong>in</strong>gs published is as follows:<br />
Overweight (Buy) 49% (26% <strong>of</strong> these provided with Investment Bank<strong>in</strong>g Services)<br />
Neutral (Hold) 38% (25% <strong>of</strong> these provided with Investment Bank<strong>in</strong>g Services)<br />
Underweight (Sell) 13% (19% <strong>of</strong> these provided with Investment Bank<strong>in</strong>g Services)<br />
Information regard<strong>in</strong>g company share price performance <strong>and</strong> history <strong>of</strong> HSBC rat<strong>in</strong>gs <strong>and</strong> price targets <strong>in</strong> respect <strong>of</strong> its longterm<br />
<strong>in</strong>vestment opportunities for the companies the subject <strong>of</strong> this report,is available from www.hsbcnet.com/research.<br />
HSBC & Analyst disclosures<br />
Disclosure checklist<br />
Company Ticker Recent price Price Date Disclosure<br />
BURBERRY GROUP BRBY.L 13.28 30-Aug-2012 4, 7<br />
HERMES HRMS.PA 223.75 30-Aug-2012 2, 6, 7<br />
LUXOTTICA LUX.MI 28.72 30-Aug-2012 7, 11<br />
LVMH LVMH.PA 129.20 30-Aug-2012 2, 5, 6, 7, 11<br />
PPR PRTP.PA 124.65 30-Aug-2012 1, 2, 5, 6, 7, 11<br />
PRADA SPA 1913.HK 59.30 30-Aug-2012 6<br />
RICHEMONT(CIE FIN) CFR.VX 58.30 30-Aug-2012 2, 7<br />
SALVATORE FERRAGAM SFER.MI 16.28 30-Aug-2012 7<br />
SWATCH UHR.VX 392.00 30-Aug-2012 4<br />
Source: HSBC<br />
1 HSBC* has managed or co-managed a public <strong>of</strong>fer<strong>in</strong>g <strong>of</strong> securities for this company with<strong>in</strong> the past 12 months.<br />
2 HSBC expects to receive or <strong>in</strong>tends to seek compensation for <strong>in</strong>vestment bank<strong>in</strong>g services from this company <strong>in</strong> the next<br />
3 months.<br />
3 At the time <strong>of</strong> publication <strong>of</strong> this report, HSBC Securities (USA) Inc. is a Market Maker <strong>in</strong> securities issued by this<br />
company.<br />
4 As <strong>of</strong> 31 July 2012 HSBC beneficially owned 1% or more <strong>of</strong> a class <strong>of</strong> common equity securities <strong>of</strong> this company.<br />
5 As <strong>of</strong> 31 July 2012, this company was a client <strong>of</strong> HSBC or had dur<strong>in</strong>g the preced<strong>in</strong>g 12 month period been a client <strong>of</strong><br />
<strong>and</strong>/or paid compensation to HSBC <strong>in</strong> respect <strong>of</strong> <strong>in</strong>vestment bank<strong>in</strong>g services.<br />
6 As <strong>of</strong> 31 July 2012, this company was a client <strong>of</strong> HSBC or had dur<strong>in</strong>g the preced<strong>in</strong>g 12 month period been a client <strong>of</strong><br />
<strong>and</strong>/or paid compensation to HSBC <strong>in</strong> respect <strong>of</strong> non-<strong>in</strong>vestment bank<strong>in</strong>g securities-related services.<br />
7 As <strong>of</strong> 31 July 2012, this company was a client <strong>of</strong> HSBC or had dur<strong>in</strong>g the preced<strong>in</strong>g 12 month period been a client <strong>of</strong><br />
<strong>and</strong>/or paid compensation to HSBC <strong>in</strong> respect <strong>of</strong> non-securities services.<br />
8 A cover<strong>in</strong>g analyst/s has received compensation from this company <strong>in</strong> the past 12 months.<br />
9 A cover<strong>in</strong>g analyst/s or a member <strong>of</strong> his/her household has a f<strong>in</strong>ancial <strong>in</strong>terest <strong>in</strong> the securities <strong>of</strong> this company, as<br />
detailed below.<br />
10 A cover<strong>in</strong>g analyst/s or a member <strong>of</strong> his/her household is an <strong>of</strong>ficer, director or supervisory board member <strong>of</strong> this<br />
company, as detailed below.<br />
11 At the time <strong>of</strong> publication <strong>of</strong> this report, HSBC is a non-US Market Maker <strong>in</strong> securities issued by this company <strong>and</strong>/or <strong>in</strong><br />
securities <strong>in</strong> respect <strong>of</strong> this company<br />
Analysts, economists, <strong>and</strong> strategists are paid <strong>in</strong> part by reference to the pr<strong>of</strong>itability <strong>of</strong> HSBC which <strong>in</strong>cludes <strong>in</strong>vestment<br />
bank<strong>in</strong>g revenues.<br />
98
Consumer Br<strong>and</strong>s & Retail<br />
Global luxury goods<br />
September 2012<br />
abc<br />
For disclosures <strong>in</strong> respect <strong>of</strong> any company mentioned <strong>in</strong> this report, please see the most recently published report on that<br />
company available at www.hsbcnet.com/research.<br />
* HSBC Legal Entities are listed <strong>in</strong> the Disclaimer below.<br />
Additional disclosures<br />
1 This report is dated as at 02 September 2012.<br />
2 All market data <strong>in</strong>cluded <strong>in</strong> this report are dated as at close 27 August 2012, unless otherwise <strong>in</strong>dicated <strong>in</strong> the report.<br />
3 HSBC has procedures <strong>in</strong> place to identify <strong>and</strong> manage any potential conflicts <strong>of</strong> <strong>in</strong>terest that arise <strong>in</strong> connection with its<br />
Research bus<strong>in</strong>ess. HSBC's analysts <strong>and</strong> its other staff who are <strong>in</strong>volved <strong>in</strong> the preparation <strong>and</strong> dissem<strong>in</strong>ation <strong>of</strong> Research<br />
operate <strong>and</strong> have a management report<strong>in</strong>g l<strong>in</strong>e <strong>in</strong>dependent <strong>of</strong> HSBC's Investment Bank<strong>in</strong>g bus<strong>in</strong>ess. Information Barrier<br />
procedures are <strong>in</strong> place between the Investment Bank<strong>in</strong>g <strong>and</strong> Research bus<strong>in</strong>esses to ensure that any confidential <strong>and</strong>/or<br />
price sensitive <strong>in</strong>formation is h<strong>and</strong>led <strong>in</strong> an appropriate manner.<br />
4 As <strong>of</strong> 31 July 2012, HSBC <strong>and</strong>/or its affiliates (<strong>in</strong>clud<strong>in</strong>g the funds, portfolios <strong>and</strong> <strong>in</strong>vestment clubs <strong>in</strong> securities managed<br />
by such entities) either, directly or <strong>in</strong>directly, own or are <strong>in</strong>volved <strong>in</strong> the acquisition, sale or <strong>in</strong>termediation <strong>of</strong>, 1% or more<br />
<strong>of</strong> the total capital <strong>of</strong> the subject companies securities <strong>in</strong> the market for the follow<strong>in</strong>g Company(ies): BURBERRY<br />
GROUP, SWATCH<br />
5 HSBC is act<strong>in</strong>g as broker for Hermes's shares buyback program.<br />
99
Consumer Br<strong>and</strong>s & Retail<br />
Global luxury goods<br />
September 2012<br />
abc<br />
Disclaimer<br />
* Legal entities as at 8 August 2012<br />
‘UAE’ HSBC Bank Middle East Limited, Dubai; ‘HK’ The Hongkong <strong>and</strong> Shanghai Bank<strong>in</strong>g Corporation<br />
Limited, Hong Kong; ‘TW’ HSBC Securities (Taiwan) Corporation Limited; 'CA' HSBC Bank Canada,<br />
Toronto; HSBC Bank, Paris Branch; HSBC France; ‘DE’ HSBC Tr<strong>in</strong>kaus & Burkhardt AG, Düsseldorf; 000<br />
HSBC Bank (RR), Moscow; ‘IN’ HSBC Securities <strong>and</strong> Capital Markets (India) Private Limited, Mumbai;<br />
‘JP’ HSBC Securities (Japan) Limited, Tokyo; ‘EG’ HSBC Securities Egypt SAE, Cairo; ‘CN’ HSBC<br />
Investment Bank Asia Limited, Beij<strong>in</strong>g Representative Office; The Hongkong <strong>and</strong> Shanghai Bank<strong>in</strong>g<br />
Corporation Limited, S<strong>in</strong>gapore Branch; The Hongkong <strong>and</strong> Shanghai Bank<strong>in</strong>g Corporation Limited, Seoul<br />
Securities Branch; The Hongkong <strong>and</strong> Shanghai Bank<strong>in</strong>g Corporation Limited, Seoul Branch; HSBC<br />
Securities (South Africa) (Pty) Ltd, Johannesburg; HSBC Bank plc, London, Madrid, Milan, Stockholm, Tel<br />
Aviv; ‘US’ HSBC Securities (USA) Inc, New York; HSBC Yatirim Menkul Degerler AS, Istanbul; HSBC<br />
México, SA, Institución de Banca Múltiple, Grupo F<strong>in</strong>anciero HSBC; HSBC Bank Brasil SA – Banco<br />
Múltiplo; HSBC Bank Australia Limited; HSBC Bank Argent<strong>in</strong>a SA; HSBC Saudi Arabia Limited; The<br />
Hongkong <strong>and</strong> Shanghai Bank<strong>in</strong>g Corporation Limited, New Zeal<strong>and</strong> Branch <strong>in</strong>corporated <strong>in</strong> Hong Kong<br />
SAR<br />
Issuer <strong>of</strong> report<br />
The Hongkong <strong>and</strong> Shanghai Bank<strong>in</strong>g<br />
Corporation Limited<br />
Level 19, 1 Queen’s Road Central<br />
Hong Kong SAR<br />
Telephone: +852 2843 9111<br />
Telex: 75100 CAPEL HX<br />
Fax: +852 2596 0200<br />
Website: www.research.hsbc.com<br />
This document has been issued by The Hongkong <strong>and</strong> Shanghai Bank<strong>in</strong>g Corporation Limited (“HSBC”) <strong>in</strong> the conduct <strong>of</strong> its Hong Kong regulated bus<strong>in</strong>ess<br />
for the <strong>in</strong>formation <strong>of</strong> its <strong>in</strong>stitutional <strong>and</strong> pr<strong>of</strong>essional <strong>in</strong>vestor (as def<strong>in</strong>ed by Securities <strong>and</strong> Future Ord<strong>in</strong>ance (Chapter 571)) customers; it is not <strong>in</strong>tended for<br />
<strong>and</strong> should not be distributed to retail customers <strong>in</strong> Hong Kong. The Hongkong <strong>and</strong> Shanghai Bank<strong>in</strong>g Corporation Limited is regulated by the Hong Kong<br />
Monetary Authority. All enquires by recipients <strong>in</strong> Hong Kong must be directed to your HSBC contact <strong>in</strong> Hong Kong. If it is received by a customer <strong>of</strong> an<br />
affiliate <strong>of</strong> HSBC, its provision to the recipient is subject to the terms <strong>of</strong> bus<strong>in</strong>ess <strong>in</strong> place between the recipient <strong>and</strong> such affiliate. This document is not <strong>and</strong><br />
should not be construed as an <strong>of</strong>fer to sell or the solicitation <strong>of</strong> an <strong>of</strong>fer to purchase or subscribe for any <strong>in</strong>vestment. HSBC has based this document on<br />
<strong>in</strong>formation obta<strong>in</strong>ed from sources it believes to be reliable but which it has not <strong>in</strong>dependently verified; HSBC makes no guarantee, representation or warranty<br />
<strong>and</strong> accepts no responsibility or liability as to its accuracy or completeness. Expressions <strong>of</strong> op<strong>in</strong>ion are those <strong>of</strong> the Research Division <strong>of</strong> HSBC only <strong>and</strong> are<br />
subject to change without notice. HSBC <strong>and</strong> its affiliates <strong>and</strong>/or their <strong>of</strong>ficers, directors <strong>and</strong> employees may have positions <strong>in</strong> any securities mentioned <strong>in</strong> this<br />
document (or <strong>in</strong> any related <strong>in</strong>vestment) <strong>and</strong> may from time to time add to or dispose <strong>of</strong> any such securities (or <strong>in</strong>vestment). HSBC <strong>and</strong> its affiliates may act as<br />
market maker or have assumed an underwrit<strong>in</strong>g commitment <strong>in</strong> the securities <strong>of</strong> companies discussed <strong>in</strong> this document (or <strong>in</strong> related <strong>in</strong>vestments), may sell<br />
them to or buy them from customers on a pr<strong>in</strong>cipal basis <strong>and</strong> may also perform or seek to perform <strong>in</strong>vestment bank<strong>in</strong>g or underwrit<strong>in</strong>g services for or relat<strong>in</strong>g<br />
to those companies.<br />
HSBC Securities (USA) Inc. accepts responsibility for the content <strong>of</strong> this research report prepa<strong>red</strong> by its non-US foreign affiliate. All U.S. persons receiv<strong>in</strong>g<br />
<strong>and</strong>/or access<strong>in</strong>g this report <strong>and</strong> wish<strong>in</strong>g to effect transactions <strong>in</strong> any security discussed here<strong>in</strong> should do so with HSBC Securities (USA) Inc. <strong>in</strong> the United<br />
States <strong>and</strong> not with its non-US foreign affiliate, the issuer <strong>of</strong> this report.<br />
In the UK this report may only be distributed to persons <strong>of</strong> a k<strong>in</strong>d described <strong>in</strong> Article 19(5) <strong>of</strong> the F<strong>in</strong>ancial Services <strong>and</strong> Markets Act 2000 (F<strong>in</strong>ancial<br />
Promotion) Order 2001. The protections afforded by the UK regulatory regime are available only to those deal<strong>in</strong>g with a representative <strong>of</strong> HSBC Bank plc <strong>in</strong><br />
the UK. In S<strong>in</strong>gapore, this publication is distributed by The Hongkong <strong>and</strong> Shanghai Bank<strong>in</strong>g Corporation Limited, S<strong>in</strong>gapore Branch for the general<br />
<strong>in</strong>formation <strong>of</strong> <strong>in</strong>stitutional <strong>in</strong>vestors or other persons specified <strong>in</strong> Sections 274 <strong>and</strong> 304 <strong>of</strong> the Securities <strong>and</strong> Futures Act (Chapter 289) (“SFA”) <strong>and</strong><br />
acc<strong>red</strong>ited <strong>in</strong>vestors <strong>and</strong> other persons <strong>in</strong> accordance with the conditions specified <strong>in</strong> Sections 275 <strong>and</strong> 305 <strong>of</strong> the SFA. This publication is not a prospectus as<br />
def<strong>in</strong>ed <strong>in</strong> the SFA. It may not be further distributed <strong>in</strong> whole or <strong>in</strong> part for any purpose. The Hongkong <strong>and</strong> Shanghai Bank<strong>in</strong>g Corporation Limited<br />
S<strong>in</strong>gapore Branch is regulated by the Monetary Authority <strong>of</strong> S<strong>in</strong>gapore. Recipients <strong>in</strong> S<strong>in</strong>gapore should contact a "Hongkong <strong>and</strong> Shanghai Bank<strong>in</strong>g<br />
Corporation Limited, S<strong>in</strong>gapore Branch" representative <strong>in</strong> respect <strong>of</strong> any matters aris<strong>in</strong>g from, or <strong>in</strong> connection with this report. In Australia, this publication<br />
has been distributed by The Hongkong <strong>and</strong> Shanghai Bank<strong>in</strong>g Corporation Limited (ABN 65 117 925 970, AFSL 301737) for the general <strong>in</strong>formation <strong>of</strong> its<br />
“wholesale” customers (as def<strong>in</strong>ed <strong>in</strong> the Corporations Act 2001). Where distributed to retail customers, this research is distributed by HSBC Bank Australia<br />
Limited (AFSL No. 232595). These respective entities make no representations that the products or services mentioned <strong>in</strong> this document are available to<br />
persons <strong>in</strong> Australia or are necessarily suitable for any particular person or appropriate <strong>in</strong> accordance with local law. No consideration has been given to the<br />
particular <strong>in</strong>vestment objectives, f<strong>in</strong>ancial situation or particular needs <strong>of</strong> any recipient. This publication is distributed <strong>in</strong> New Zeal<strong>and</strong> by The Hongkong <strong>and</strong><br />
Shanghai Bank<strong>in</strong>g Corporation Limited, New Zeal<strong>and</strong> Branch <strong>in</strong>corporated <strong>in</strong> Hong Kong SAR.<br />
In Japan, this publication has been distributed by HSBC Securities (Japan) Limited. It may not be further distributed <strong>in</strong> whole or <strong>in</strong> part for any purpose. In<br />
Korea, this publication is distributed by The Hongkong <strong>and</strong> Shanghai Bank<strong>in</strong>g Corporation Limited, Seoul Securities Branch ("HBAP SLS") for the general<br />
<strong>in</strong>formation <strong>of</strong> pr<strong>of</strong>essional <strong>in</strong>vestors specified <strong>in</strong> Article 9 <strong>of</strong> the F<strong>in</strong>ancial Investment Services <strong>and</strong> Capital Markets Act (“FSCMA”). This publication is not<br />
a prospectus as def<strong>in</strong>ed <strong>in</strong> the FSCMA. It may not be further distributed <strong>in</strong> whole or <strong>in</strong> part for any purpose. HBAP SLS is regulated by the F<strong>in</strong>ancial Services<br />
Commission <strong>and</strong> the F<strong>in</strong>ancial Supervisory Service <strong>of</strong> Korea.<br />
In Canada, this document has been distributed by HSBC Bank Canada <strong>and</strong>/or its affiliates. Where this document conta<strong>in</strong>s market updates/overviews, or<br />
similar materials (collectively deemed “Commentary” <strong>in</strong> Canada although other affiliate jurisdictions may term “Commentary” as either “macro-research” or<br />
“research”), the Commentary is not an <strong>of</strong>fer to sell, or a solicitation <strong>of</strong> an <strong>of</strong>fer to sell or subscribe for, any f<strong>in</strong>ancial product or <strong>in</strong>strument (<strong>in</strong>clud<strong>in</strong>g, without<br />
limitation, any currencies, securities, commodities or other f<strong>in</strong>ancial <strong>in</strong>struments).<br />
© Copyright 2012, The Hongkong <strong>and</strong> Shanghai Bank<strong>in</strong>g Corporation Limited, ALL RIGHTS RESERVED. No part <strong>of</strong> this publication may be reproduced,<br />
sto<strong>red</strong> <strong>in</strong> a retrieval system, or transmitted, on any form or by any means, electronic, mechanical, photocopy<strong>in</strong>g, record<strong>in</strong>g, or otherwise, without the prior<br />
written permission <strong>of</strong> The Hongkong <strong>and</strong> Shanghai Bank<strong>in</strong>g Corporation Limited. MICA (P) 038/04/2012, MICA (P) 063/04/2012 <strong>and</strong> MICA (P)<br />
206/01/2012<br />
341161<br />
100
Global Consumer Br<strong>and</strong>s & Retail<br />
Research Team<br />
Europe<br />
Consumer Br<strong>and</strong>s & Retail<br />
Anto<strong>in</strong>e Belge<br />
Head <strong>of</strong> Consumer Br<strong>and</strong>s <strong>and</strong> Retail Equity Research<br />
+33 1 56 52 43 47 anto<strong>in</strong>e.belge@hsbc.com<br />
Sophie Dargnies<br />
Analyst<br />
+33 1 56 52 43 48 sophie.dargnies@hsbc.com<br />
Cedric Besnard<br />
Analyst<br />
+33 1 56 52 43 66 cedric.besnard@hsbc.com<br />
Florence Dohan<br />
Analyst<br />
+44 207 992 4647 florence.dohan@hsbc.com<br />
Jérôme Samuel<br />
Analyst<br />
+33 1 56 52 44 23 jerome.samuel@hsbc.com<br />
Emmanuelle Vigneron<br />
Analyst<br />
+33 1 56 52 43 19 emmanuelle.vigneron@hsbc.com<br />
Paul Ross<strong>in</strong>gton<br />
Analyst<br />
+44 20 7991 6734 paul.ross<strong>in</strong>gton@hsbcib.com<br />
Leisure<br />
Lena Thakkar<br />
Analyst<br />
+44 20 7991 3448 lena.thakkar@hsbcib.com<br />
CEEMEA<br />
Consumer Br<strong>and</strong>s & Retail<br />
Michele Olivier<br />
Analyst<br />
+27 11 6764208 michele.olivier@za.hsbc.com<br />
Specialist Sales<br />
Lynn Raphael<br />
+44 20 7991 1331 lynn.raphael@hsbcib.com<br />
David Harr<strong>in</strong>gton<br />
+44 20 7991 5389 david.harr<strong>in</strong>gton@hsbcib.com<br />
Asia<br />
Consumer Br<strong>and</strong>s & Retail<br />
Erwan Rambourg<br />
Head <strong>of</strong> Consumer Br<strong>and</strong>s <strong>and</strong> Retail Equity Research<br />
+852 2996 6572 erwanrambourg@hsbc.com.hk<br />
Chris Zee<br />
Analyst<br />
+852 2822 2912 chriscmzee@hsbc.com.hk<br />
Christopher Leung<br />
Analyst<br />
+852 2996 6531 christopher.k.leung@hsbc.com.hk<br />
L<strong>in</strong>a Yan<br />
Analyst<br />
+852 2822 4344 l<strong>in</strong>ayjyan@hsbc.com.hk<br />
Cather<strong>in</strong>e Chao<br />
Analyst<br />
+852 2996 6570 cather<strong>in</strong>efchao@hsbc.com.hk<br />
Karen Choi<br />
Analyst<br />
+822 3706 8781 karen.choi@kr.hsbc.com<br />
Jena Han<br />
Associate<br />
+822 3706 8772 jenahan@kr.hsbc.com<br />
Sean Monaghan<br />
Analyst<br />
+65 6658 0610 seanmonaghan@hsbc.com.sg<br />
Permada (Mada) Darmono<br />
Analyst<br />
+65 6658 0613 permada.w.darmono@hsbc.com.sg<br />
Thilan Wickramas<strong>in</strong>ghe<br />
Analyst<br />
+65 6658 0609 thilanw@hsbc.com.sg<br />
Abel Lee<br />
Analyst<br />
+8862 6631 2866 abelchlee@hsbc.com.tw<br />
Amit Sachdeva<br />
Analyst<br />
+91 22 2268 1240 amit1sachdeva@hsbc.co.<strong>in</strong><br />
North & Lat<strong>in</strong> America<br />
Consumer & Retail<br />
Francisco J Chevez<br />
Analyst, Lat<strong>in</strong> America & US<br />
+1 212 525 5350 francisco.j.chevez@us.hsbc.com<br />
Stewart Ragar<br />
Analyst<br />
+1 212 525 3460 stewart.h.ragar@us.hsbc.com<br />
Manisha A Chaudhry<br />
Associate, Lat<strong>in</strong> America & US<br />
+1 212 525 3035 manisha.a.chaudhry@us.hsbc.com<br />
Beverages<br />
Lauren Torres<br />
Analyst, Global Beverages<br />
+1 212 525 6972 lauren.torres@us.hsbc.com<br />
James Watson<br />
Analyst, Global Beverages<br />
+1 212 525 4905 james.c.watson@us.hsbc.com<br />
Food & Agricultural Products<br />
Pedro Herrera<br />
Analyst, Global Food & Agricultural Products<br />
+1 212 525 5126 pedro.herrera@us.hsbc.com<br />
Ravi Ja<strong>in</strong><br />
Analyst, Global Food & Agricultural Products<br />
+1 212 525 3442 ravija<strong>in</strong>@us.hsbc.com<br />
Diego T Maia<br />
Analyst, Food & Agricultural Products, Brazil<br />
+55 11 33718192 diego.t.maia@hsbc.com.br<br />
Household Durables<br />
Francisco Suarez<br />
Analyst, Household Durables, Mexico<br />
+52 55 5721 2173 francisco.suarez@hsbc.com.mx<br />
Berenice Munoz<br />
Associate, Household Durables, Mexico<br />
+52 55 5721 5623 berenice.munoz@hsbc.com.mx<br />
abc
Erwan Rambourg*<br />
Analyst<br />
The Hongkong <strong>and</strong> Shanghai Bank<strong>in</strong>g Corporation Limited<br />
+852 2996 6572<br />
erwanrambourg@hsbc.com.hk<br />
Erwan Rambourg is Head <strong>of</strong> Consumer Br<strong>and</strong>s <strong>and</strong> Retail Equity Research <strong>and</strong> is a top ranked analyst cover<strong>in</strong>g the luxury, sport<strong>in</strong>g<br />
goods <strong>and</strong> spirits sectors. He jo<strong>in</strong>ed HSBC <strong>in</strong> January 2005 <strong>and</strong> <strong>in</strong> 2011 relocated from London to Hong Kong as many stocks under<br />
coverage are now Asia-driven. Before mov<strong>in</strong>g to HSBC, Erwan worked for eight years as Market<strong>in</strong>g Manager <strong>in</strong> the luxury <strong>in</strong>dustry,<br />
notably for Richemont <strong>and</strong> LVMH.<br />
Anto<strong>in</strong>e Belge*<br />
Analyst<br />
HSBC Bank Plc, Paris branch<br />
+33 1 56 52 4347<br />
anto<strong>in</strong>e.belge@hsbc.com<br />
Anto<strong>in</strong>e Belge is Head <strong>of</strong> Consumer Br<strong>and</strong>s <strong>and</strong> Retail Equity Research <strong>and</strong> is a top ranked analyst cover<strong>in</strong>g the luxury, sport<strong>in</strong>g goods<br />
<strong>and</strong> spirits sectors. He has been an analyst s<strong>in</strong>ce 1998 <strong>and</strong> jo<strong>in</strong>ed HSBC <strong>in</strong> 2003. Prior to this, he worked for seven years <strong>in</strong> the <strong>in</strong>dustry<br />
as a F<strong>in</strong>ance Controller for Christian Dior <strong>and</strong> Chanel.<br />
Sophie Dargnies*<br />
Analyst<br />
HSBC Bank Plc, Paris branch<br />
+33 1 56 52 4348<br />
sophie.dargnies@hsbc.com<br />
Sophie is an equity analyst cover<strong>in</strong>g the luxury, sport<strong>in</strong>g goods <strong>and</strong> spirits sectors. She jo<strong>in</strong>ed the <strong>Luxury</strong> <strong>and</strong> Sport<strong>in</strong>g Goods<br />
team at HSBC <strong>in</strong> May 2008. Before jo<strong>in</strong><strong>in</strong>g HSBC, Sophie worked as a consultant for three years. She is a graduate <strong>of</strong> EDHEC<br />
Bus<strong>in</strong>ess School.<br />
*Employed by a non-US affiliate <strong>of</strong> HSBC Securities (USA) Inc, <strong>and</strong> is not registe<strong>red</strong>/qualified pursuant to FINRA regulations.