Capacitive-based dilatometer cell constructed of fused quartz for ...
Capacitive-based dilatometer cell constructed of fused quartz for ...
Capacitive-based dilatometer cell constructed of fused quartz for ...

You also want an ePaper? Increase the reach of your titles
YUMPU automatically turns print PDFs into web optimized ePapers that Google loves.
REVIEW OF SCIENTIFIC INSTRUMENTS 79, 033903 2008<br />
<strong>Capacitive</strong>-<strong>based</strong> <strong>dilatometer</strong> <strong>cell</strong> <strong>constructed</strong> <strong>of</strong> <strong>fused</strong> <strong>quartz</strong><br />
<strong>for</strong> measuring the thermal expansion <strong>of</strong> solids<br />
J. J. Neumeier, R. K. Bollinger, G. E. Timmins, C. R. Lane,<br />
R. D. Krogstad, and J. Macaluso<br />
Department <strong>of</strong> Physics, P.O. Box 173840, Montana State University, Bozeman, Montana 59717-3840, USA<br />
Received 20 December 2007; accepted 31 January 2008; published online 13 March 2008<br />
A <strong>dilatometer</strong> <strong>cell</strong> that can detect sub angstrom changes in the length <strong>of</strong> solid specimens in the<br />
temperature range 5 KT350 K is described. It is <strong>constructed</strong> entirely from <strong>fused</strong> <strong>quartz</strong> silica.<br />
This is a capacitive-<strong>based</strong> technique, where the spacing between two metallized plates allows<br />
detection <strong>of</strong> changes in length. It is also a relative measurement in the sense that the capacitor plate<br />
spacing is determined by the relative thermal expansions <strong>of</strong> the <strong>cell</strong> and sample. The advantage <strong>of</strong><br />
using <strong>fused</strong> <strong>quartz</strong> is that it has among the smallest known thermal expansions. As a result, <strong>for</strong> most<br />
measurements, the sample’s thermal expansion dominates the capacitance change. The construction<br />
and per<strong>for</strong>mance are described. It is directly compared to a <strong>dilatometer</strong> <strong>cell</strong> <strong>constructed</strong> <strong>of</strong> copper.<br />
Some thermometry and temperature control issues specific to dilatometry measurements are<br />
discussed. © 2008 American Institute <strong>of</strong> Physics. DOI: 10.1063/1.2884193<br />
I. INTRODUCTION<br />
A wide range <strong>of</strong> techniques are applied in measuring the<br />
thermal expansion <strong>of</strong> solids. These are described in a number<br />
<strong>of</strong> publications. 1–4 This report is concerned with a capacitive<strong>based</strong><br />
thermal expansion <strong>cell</strong> also referred to as a <strong>dilatometer</strong><br />
<strong>cell</strong>. When the sample shrinks or expands, the capacitor<br />
gap d changes, which in turn changes the capacitance according<br />
to C=A/d, where is the permittivity and A is the<br />
capacitor plate area. The sample is generally much larger<br />
than the capacitor gap and the sample is in thermal equilibrium<br />
with the <strong>cell</strong>. As a result, both the thermal expansion <strong>of</strong><br />
the <strong>cell</strong> and that <strong>of</strong> the sample determine d. We refer to this<br />
type <strong>of</strong> measurement as relative since the thermal expansion<br />
<strong>of</strong> the sample relative to the material from which the <strong>cell</strong> is<br />
<strong>constructed</strong> determines the capacitance clarified in Sec.<br />
III D. There<strong>for</strong>e, the material <strong>of</strong> which the <strong>cell</strong> is <strong>constructed</strong><br />
must be carefully chosen; ideally it should have the<br />
smallest possible thermal expansion. Most capacitive-<strong>based</strong><br />
<strong>dilatometer</strong> <strong>cell</strong>s are <strong>constructed</strong> <strong>of</strong> copper or copper<br />
alloys, 5–10 which have large thermal expansions. <strong>Capacitive</strong><strong>based</strong><br />
<strong>cell</strong>s <strong>constructed</strong> <strong>of</strong> materials with small thermal expansions,<br />
such as silicon 11 and <strong>fused</strong> <strong>quartz</strong>, 12 have been developed,<br />
but they have not been widely utilized in measuring<br />
the thermal expansion <strong>of</strong> solids.<br />
<strong>Capacitive</strong>-<strong>based</strong> thermal expansion techniques have a<br />
number <strong>of</strong> advantages. Off-the-shelf capacitance bridges can<br />
measure with a resolution <strong>of</strong> about one part in 10 9 , which<br />
translates to a typical sensitivity to changes in length <strong>of</strong> better<br />
than 0.1 Å. The size <strong>of</strong> the <strong>dilatometer</strong> <strong>cell</strong> can be small<br />
about 8 cm 3 . It is, in principle, possible to measure samples<br />
with lengths in the millimeter to centimeter range. Data can<br />
be collected continuously as the sample/<strong>cell</strong> temperature is<br />
varied. Measurements in magnetic fields are possible too.<br />
Some minor disadvantages exist as well. The thermal expansion<br />
<strong>of</strong> the material from which the <strong>cell</strong> is <strong>constructed</strong> must<br />
be well known in order to reliably subtract its contribution to<br />
the raw data. Also, an addendum must be measured and subtracted<br />
from the raw data; this is a measurement <strong>of</strong> the<br />
change in capacitance <strong>of</strong> the empty <strong>dilatometer</strong> <strong>cell</strong> the<br />
empty <strong>cell</strong> effect. If the <strong>cell</strong> is made <strong>of</strong> an electrically conductive<br />
material, insulating spacers are needed to electrically<br />
isolate the capacitor plates. This can, in principle, lead to<br />
complicated differential thermal expansion effects and a<br />
large empty <strong>cell</strong> effect.<br />
Here we introduce a <strong>dilatometer</strong> <strong>cell</strong> <strong>constructed</strong> from<br />
<strong>fused</strong> <strong>quartz</strong> silica. The main advantage <strong>of</strong> this <strong>cell</strong> over<br />
copper <strong>cell</strong>s lies with the extremely small thermal expansion<br />
<strong>of</strong> <strong>fused</strong> <strong>quartz</strong>, which leads to a smaller contribution <strong>of</strong> the<br />
<strong>cell</strong>’s thermal expansion to the raw data i.e., a smaller<br />
relative effect. A second advantage <strong>of</strong> the <strong>fused</strong> <strong>quartz</strong> <strong>cell</strong><br />
lies in its very small empty <strong>cell</strong> effect. While the <strong>for</strong>mer<br />
makes the determination <strong>of</strong> the absolute thermal expansion<br />
<strong>of</strong> the measured sample more reliable, the latter enables measurement<br />
<strong>of</strong> samples with lengths as small as a few tenths <strong>of</strong><br />
a millimeter. The basic design can be attributed to Kund. 12<br />
We have improved the design, construction method, and assembly<br />
and developed a new sample mounting method.<br />
These changes have resulted in a significant reduction <strong>of</strong> the<br />
empty <strong>cell</strong> effect. Both the relative effect and empty <strong>cell</strong><br />
effect are compared directly to those <strong>of</strong> a <strong>cell</strong> <strong>constructed</strong> <strong>of</strong><br />
copper. We also discuss some aspects <strong>of</strong> thermometry and<br />
heating that are important <strong>for</strong> dilatometry measurements.<br />
II. EXPERIMENTAL<br />
A. Cell design, construction, and assembly<br />
Over the 7 year duration <strong>of</strong> this project, numerous <strong>cell</strong><br />
designs have been <strong>constructed</strong> and extensively tested. One<br />
design was shown in a recent publication. 13 These refinements,<br />
which will not be presented here, led to the design in<br />
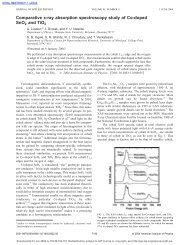
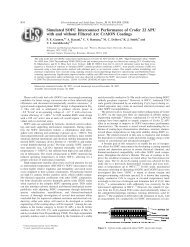
Fig. 1. The <strong>cell</strong> is composed <strong>of</strong> five pieces. Two L-shaped<br />
0034-6748/2008/793/033903/8/$23.00<br />
79, 033903-1<br />
© 2008 American Institute <strong>of</strong> Physics<br />
Downloaded 24 Mar 2008 to 153.90.194.137. Redistribution subject to AIP license or copyright; see http://rsi.aip.org/rsi/copyright.jsp
033903-2 Neumeier et al. Rev. Sci. Instrum. 79, 033903 2008<br />
(a)<br />
(b)<br />
18 mm<br />
20 mm<br />
20 mm<br />
FIG. 1. Color online a Exploded view <strong>of</strong> the <strong>fused</strong> <strong>quartz</strong> <strong>dilatometer</strong><br />
<strong>cell</strong>. b Assembled view <strong>of</strong> the <strong>cell</strong>.<br />
pieces <strong>for</strong>m the stationary and movable capacitor plates. On<br />
the vertical faces <strong>of</strong> the L-shaped pieces, a 100 Å/1000 Å<br />
Cr/Au film is deposited to <strong>for</strong>m the metallic capacitor plates.<br />
The L-shaped pieces are joined with two <strong>fused</strong> <strong>quartz</strong> plates<br />
that are 12140.14 mm 3 in dimension; these act as<br />
springs. The springs are glued to the L-shaped pieces using a<br />
mixture <strong>of</strong> talcum powder and sodium silicate solution. 14,15<br />
The stationary L-shaped piece has a cutout on the top with a<br />
3° angle relative to the capacitor plate. The sample is placed<br />
on top <strong>of</strong> the movable plate and a wedge, also with a 3°<br />
angle, is pushed parallel to the capacitor plates to wedge the<br />
sample between it and the movable plate. This applies tension<br />
to the springs to establish the desired capacitor gap at<br />
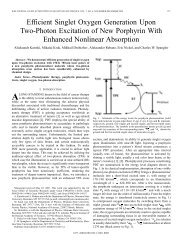
room temperature. Figure 2 shows a sample mounted in one<br />
<strong>of</strong> our <strong>dilatometer</strong> <strong>cell</strong>s. Wedges with a variety <strong>of</strong> widths are<br />
FIG. 2. Color online Assembled <strong>dilatometer</strong> <strong>cell</strong> with a sample installed. A<br />
US nickel 21.2 mm diameter alongside the <strong>cell</strong> helps appreciate the size.<br />
The wires visible in the <strong>for</strong>eground are connected to the low capacitor plate<br />
and guard ring.<br />
fabricated to accommodate samples <strong>of</strong> different lengths.<br />
The L-shaped pieces are fabricated from a <strong>quartz</strong> ingot<br />
Herasil I in these experiments 16 using a surface grinder<br />
fitted with a resin-bonded diamond blade. The <strong>quartz</strong> work<br />
piece is fastened with Crystal Bond 17 to a flat plate <strong>of</strong> magnetic<br />
steel, which is held fast to the grinder via a magnetic<br />
chuck. The surface grinder spins at 3000 rpm, and the blades<br />
have diameters between 15 and 18 cm. Diamond blades <strong>of</strong><br />
custom width were purchased <strong>for</strong> specific grinding tasks and<br />
a cup-shaped blade is used <strong>for</strong> the final finish <strong>of</strong> the capacitor<br />
plates; these possess diamond grits <strong>of</strong> 150 and 220, respectively.<br />
The grinding is done with a constant flow <strong>of</strong> water <strong>for</strong><br />
cooling and no more than 25 m is removed on one pass <strong>of</strong><br />
the grinding wheel. 18 No polishing <strong>of</strong> the <strong>quartz</strong> parts was<br />
done although polishing <strong>of</strong> the regions where the springs are<br />
glued may improve adhesion. 15 Since it is important that the<br />
capacitor plates are parallel, extreme care is taken in the<br />
planning and execution <strong>of</strong> the grinding. Typical steps are as<br />
follows: 1 <strong>for</strong>ming <strong>of</strong> a cube <strong>of</strong> <strong>quartz</strong>, 2 mounting on the<br />
grinder from this point <strong>for</strong>ward, it will not be removed until<br />
step 5 is complete, 3 grinding <strong>of</strong> the L piece to its approximate<br />
dimension, 4 finishing <strong>of</strong> the capacitor plate with<br />
the cup-shaped wheel so that it is perpendicular to grinding<br />
wheel axis, 5 grinding <strong>of</strong> the mounting surface <strong>of</strong> the<br />
spring that is furthest from the capacitor plate with the cupshaped<br />
wheel this also fixes the length <strong>of</strong> the L-shaped<br />
piece, and 6 grinding <strong>of</strong> the spring groove. At this stage,<br />
the part is repositioned on the machine <strong>for</strong> grinding <strong>of</strong> the<br />
3° angle and sample mounting region. Generally, the two<br />
L-shaped pieces and the wedge can be fabricated in<br />
3–5 days. Polished <strong>fused</strong> <strong>quartz</strong> wafers 20 Å roughness<br />
with 100 mm diameter and 0.14 mm thickness were purchased.<br />
They were diced into rectangular plates 12<br />
14 mm 2 <strong>for</strong> use as springs. All parts can be strain relieved<br />
at this stage by placing in a 10% HF acid solution <strong>for</strong> 1 min.<br />
After the L-shaped pieces are finished, the Cr/Au film<br />
was vapor deposited to provide conducting surfaces with<br />
small tabs <strong>for</strong> electrical contacts. On the outer edge <strong>of</strong> one <strong>of</strong><br />
the plates, about 1 mm from the edge, a guard ring is<br />
scratched into the surface to separate the low plate from the<br />
guard ring. During the experiment, the guard ring is<br />
grounded. This reduces fringe-field effects. 5,7 We <strong>constructed</strong><br />
an x-y-z plat<strong>for</strong>m <strong>for</strong> scratching the guard ring. The tip <strong>of</strong> a<br />
phonograph stylus was glued to a piece <strong>of</strong> piano wire which<br />
was attached to the vertical z segment <strong>of</strong> the plat<strong>for</strong>m. The<br />
stationary see Fig. 1 L-shaped piece was secured to the<br />
horizontal surface <strong>of</strong> the stage with double-sided tape. The<br />
guard ring was then carved with the stylus under a<br />
microscope.<br />
Finally, the <strong>cell</strong> is assembled see Fig. 2. We use a mixture<br />
<strong>of</strong> talcum powder and sodium silicate solution, 14 a glue<br />
that has been used <strong>for</strong> decades in the glass industry. This glue<br />
withstands high and cryogenic temperatures. A main advantage<br />
is that in the likely event that a spring breaks, the glue is<br />
easily dissolved by immersing the <strong>cell</strong> overnight in water. To<br />
make the glue, talcum powder is added to fresh sodium silicate<br />
solution <strong>for</strong>ming a thick mixture that is then thinned<br />
50:50 with water. We generally mix about 10 cm 3 and store it<br />
in a hypodermic needle <strong>for</strong> later use. An extensive study <strong>of</strong><br />
Downloaded 24 Mar 2008 to 153.90.194.137. Redistribution subject to AIP license or copyright; see http://rsi.aip.org/rsi/copyright.jsp
033903-3 Fused <strong>quartz</strong> <strong>dilatometer</strong> <strong>cell</strong> Rev. Sci. Instrum. 79, 033903 2008<br />
the <strong>fused</strong> <strong>quartz</strong> bonding process utilizing sodium silicate<br />
solution suggests some guidelines to improve the bond<br />
strength. 15 We have tested some <strong>of</strong> these ideas, such as eliminating<br />
the talcum powder from the glue, but at this stage<br />
cannot comment as to whether or not they provide any improvements<br />
in the decades-old method we have used <strong>for</strong> the<br />
bulk <strong>of</strong> this work. To glue the <strong>cell</strong> together, the two capacitor<br />
plates are held in intimate contact with CuBe springs; this<br />
guarantees parallelicity <strong>of</strong> the plates. The <strong>cell</strong> is stood on<br />
end, a spring is placed in the position furthest from the capacitor<br />
plate, and a small weight is placed on top. A small<br />
drop <strong>of</strong> glue is spread along the outer edge <strong>of</strong> the spring-<strong>cell</strong><br />
joint and capillary action pulls it into the interface. After the<br />
glue dries, the spring closest to the capacitor plate is placed<br />
in position, a weight is placed on top, and it is glued at the<br />
four corners. Once the glue dries, the weight is removed and<br />
some glue is applied in the groove region. Under no circumstances<br />
should an excessive amount <strong>of</strong> glue be used or<br />
should glue be applied anywhere but to the outer edge <strong>of</strong> the<br />
spring-<strong>cell</strong> joint.<br />
At this stage, 50 m diameter annealed platinum leads<br />
are attached to the electrical tabs with silver paint. Short<br />
90 m copper leads are glued to the <strong>cell</strong> with the sodium<br />
silicate glue and soldered to the platinum leads see Fig. 2.<br />
During experiments, the <strong>dilatometer</strong> <strong>cell</strong> is placed in a rectangular<br />
copper Faraday cage. The Faraday cage is permanently<br />
mounted on the end <strong>of</strong> a stainless steel tube with an<br />
o-ring flange on top. The high and low copper leads are<br />
soldered to the central conductor <strong>of</strong> two coax wires that exit<br />
the o-ring flange through hermetically sealed connectors. The<br />
ends <strong>of</strong> these coax wires are permanently mounted to the<br />
Faraday cage, near the <strong>dilatometer</strong> <strong>cell</strong>, to minimize noise<br />
from vibration and stray capacitance. The other copper lead,<br />
connected to the guard ring, is soldered directly to a ground<br />
tab inside the Faraday cage.<br />
B. Cryostat<br />
For the thermal expansion measurements, we use a helium<br />
cryostat with a custom designed insert that allows measurement<br />
in the range 5 KT350 K. The helium Dewar<br />
was purchased from a commercial source. It is a superinsulated<br />
Dewar, 1.2 m high, with a straight-bucket design that<br />
has an inside diameter <strong>of</strong> 15 cm and a liquid helium capacity<br />
<strong>of</strong> about 12 l. A flange was welded to the bottom so that the<br />
Dewar could be securely fastened to a massive disk <strong>of</strong> aluminum<br />
that has rubber vibration isolation feet on its bottom.<br />
The insert has two concentric stainless steel tubes, one <strong>of</strong><br />
6.3 cm diameter and the other with 5.2 cm diameter. The<br />
space between these has layers <strong>of</strong> superinsulation; typically<br />
we place about 10 mbars <strong>of</strong> helium gas at 295 K in this<br />
space to provide thermal exchange with the helium bath. At<br />
the bottom <strong>of</strong> the inner tube, an oxygen free electrolytic<br />
OFE copper can with inside diameter <strong>of</strong> 4.7 cm and length<br />
<strong>of</strong> 17.5 cm is hard soldered. The copper can help provide an<br />
isothermal region <strong>for</strong> the <strong>dilatometer</strong> <strong>cell</strong>. We typically place<br />
50 mbars <strong>of</strong> helium gas in this region at 295 K to promote<br />
thermal exchange. On the outside <strong>of</strong> the copper can, a 60 <br />
heater made <strong>of</strong> manganin wire is glued with GE varnish.<br />
C. Thermometry<br />
During experiments, the Faraday cage is near the bottom<br />
<strong>of</strong> the copper can. Two thermometers are glued on a 2.5 mm<br />
thick slab <strong>of</strong> <strong>fused</strong> <strong>quartz</strong> that is held to the wall <strong>of</strong> the<br />
Faraday cage with springs fabricated from piano wire. The<br />
thermometers are at the same vertical height as the sample.<br />
We use an alumina-encased platinum resistance thermometer<br />
and a hermetically sealed high-temperature Cernox resistance<br />
thermometer. The Cernox Ref. 19 has a larger dR/dT,<br />
where R is the thermometer’s resistance, than platinum below<br />
220 K, above which platinum’s larger dR/dT provides<br />
better sensitivity. They were calibrated in a Quantum Design<br />
Physical Properties Measurement System prior to installation<br />
see below. A Lakeshore model 340 is used to measure the<br />
thermometer resistance during the dilatometry measurements.<br />
We found the firmware in this device inadequate to<br />
calculate the temperature from the resistance values since it<br />
only interpolates linearly between the calibration points. 20<br />
There<strong>for</strong>e, the calibration data are fit <strong>for</strong> entry into our<br />
LABVIEW program <strong>for</strong> the calculation <strong>of</strong> the temperature.<br />
In calibrating the thermometers, the temperature was stabilized<br />
<strong>for</strong> 4 min be<strong>for</strong>e a resistance measurement was done.<br />
The Cernox excitation was 10 mV; the Pt thermometer excitation<br />
was 100 A. The obtained resistance was an average<br />
<strong>of</strong> 25 resistance measurements. Data were collected from<br />
2 to 375 K in 1.0 K increments.<br />
The data <strong>for</strong> each thermometer were plotted as T vs R<br />
and fitted to a polynomial. The Cernox polynomial is <strong>of</strong> the<br />
<strong>for</strong>m<br />
T Cer R = a 0 R −5 + a 1 R −9/2 + a 2 R −4 + ¯ + a 13 R 3/2 .<br />
The fit is valid in the range 2 KT375 K. For the Pt<br />
thermometer, the data were fitted to a polynomial <strong>of</strong> the <strong>for</strong>m<br />
T Pt R = b 0 R −8 + b 1 R −15/2 + ¯ + b 23 R 7/2 .<br />
This particular fit is valid <strong>for</strong> the range 50 KT375 K. In<br />
both cases, the fitting was conducted using the least-squares<br />
routine in MATHEMATICA. These fits were entered into our<br />
LABVIEW data acquisition program <strong>for</strong> the calculation <strong>of</strong> the<br />
temperature during the dilatometry experiments.<br />
In the LABVIEW program, the resistance <strong>for</strong> both thermometers<br />
are collected once every 502 ms <strong>for</strong> the length<br />
<strong>of</strong> time required to produce one capacitance measurement<br />
5.2 s. The resistances are converted to temperatures and a<br />
time stamp is provided by the computer, accurate to 1 ms.<br />
When the capacitance is obtained from the capacitance<br />
bridge, the time/temperature data are fitted to a straight line<br />
using LABVIEW’s least-squares fitting routine. Approximately<br />
104 data points <strong>for</strong> each thermometer will be fitted <strong>for</strong> any<br />
given C. The time <strong>of</strong> C is computed, and the T Cer and T Pt<br />
values corresponding to the C data point are found from the<br />
time/temperature fits.<br />
The two temperatures thus obtained are then averaged by<br />
the following schemes:<br />
T¯ = TCer ,<br />
if T Cer 50 K and<br />
1<br />
2<br />
3<br />
Downloaded 24 Mar 2008 to 153.90.194.137. Redistribution subject to AIP license or copyright; see http://rsi.aip.org/rsi/copyright.jsp
033903-4 Neumeier et al. Rev. Sci. Instrum. 79, 033903 2008<br />
T¯ = SCer T Cer + S Pt T Pt /S Cer + S Pt ,<br />
4<br />
1.00005<br />
<strong>for</strong> 50 KT Cer 375 K, where T¯ is the mean temperature<br />
and S=dR/dT <strong>for</strong> the respective thermometers.<br />
The importance <strong>of</strong> smooth temperature calibration<br />
curves <strong>for</strong> thermal expansion measurements cannot be overemphasized.<br />
This lies with the fact that the thermodynamic<br />
quantity <strong>of</strong> interest, the thermal expansion coefficient , is<br />
the derivative <strong>of</strong> the measured relative change in length versus<br />
temperature i.e., =1/L 300 dL/dT. As a result, any<br />
features or oscillations in the TR fit will show up in . As<br />
a rule, after fitting the TR data, we carefully inspect the first<br />
and second derivatives <strong>of</strong> the fits to ascertain their smoothness.<br />
This attention to the TR fitting has led us to abandon<br />
spline interpolations, which are not as smooth as the fits<br />
given by Eqs. 1 and 2.<br />
D. Heating routine<br />
Prior to beginning a measurement, the inner cryostat<br />
tube is pumped with an oil-free turbopumping station <strong>for</strong><br />
12 h with three intermediate flushings with dry helium gas.<br />
The temperature <strong>of</strong> the <strong>dilatometer</strong> <strong>cell</strong> region is maintained<br />
at 350 K during the pumping; if this is not done, a noticeable<br />
upturn in the thermal expansion coefficient occurs near<br />
300 K because <strong>of</strong> changes in the dielectric constant from<br />
desorbed gases. A typical vacuum at the end <strong>of</strong> this routine is<br />
210 −6 mbar. After pumping, approximately 50 mbars <strong>of</strong><br />
helium gas is admitted to the <strong>dilatometer</strong> <strong>cell</strong> space to provide<br />
thermal exchange. Cryogenic fluid is then added to the<br />
Dewar, cooling the <strong>cell</strong> to the minimum temperature with<br />
this configuration 5 K. At this stage, about 2 l <strong>of</strong> liquid<br />
helium are in the Dewar.<br />
Once the <strong>dilatometer</strong> <strong>cell</strong> has reached its minimum temperature,<br />
current from the Lakeshore 340 is applied to the<br />
heater. We have developed a heating routine that operates<br />
within our LABVIEW data acquisition program. A key aspect<br />
is that the desired resolution <strong>for</strong> this experiment typically<br />
0.1 Å requires that the warming rate remains constant. At<br />
present, the warming rate is held at 0.201 K/min <strong>for</strong> 5 K<br />
T60 K and 0.2002 K/min above 60 K. In the region<br />
near 40 K, where the liquid helium typically boils <strong>of</strong>f, the<br />
rate may go briefly as high as 0.22 K/min. Our heating routine<br />
works in two modes. Below 20 K, a polynomial is used<br />
to ramp the heater power with time as the variable; this polynomial<br />
was determined empirically. Above 20 K, the warming<br />
rate is checked at a rate <strong>of</strong> 20 Hz and the power is increased<br />
only if the rate falls below 0.2 K/min.<br />
III. EMPTY CELL EFFECT<br />
A. Copper versus <strong>fused</strong> <strong>quartz</strong> <strong>for</strong> constructing<br />
<strong>dilatometer</strong> <strong>cell</strong>s<br />
Having explained the details <strong>of</strong> how our <strong>dilatometer</strong> <strong>cell</strong><br />
is <strong>constructed</strong> and how the thermometry and heating are<br />
handled, we can move into actual measurements with the<br />
<strong>fused</strong> <strong>quartz</strong> <strong>cell</strong>. This is also a natural stage <strong>for</strong> comparing<br />
copper and <strong>fused</strong> <strong>quartz</strong> <strong>dilatometer</strong> <strong>cell</strong>s. At present, copper<br />
is used almost universally as a construction material <strong>for</strong><br />
capacitive-<strong>based</strong> thermal expansion <strong>cell</strong>s. One reason <strong>for</strong><br />
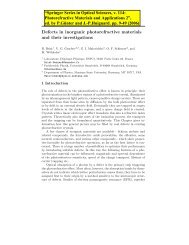
C(T)/C<br />
300<br />
1.00002<br />
0.999990<br />
0.999960<br />
0.999930<br />
0.999900<br />
Expected<br />
Observed<br />
0 50 100 150 200 250 300<br />
temperature (K)<br />
FIG. 3. Expected empty <strong>cell</strong> effect determined with Eq. 5 and that observed<br />
in measurements with our <strong>fused</strong> <strong>quartz</strong> <strong>dilatometer</strong> <strong>cell</strong> plotted as<br />
CT/C 300 vs T.<br />
using <strong>fused</strong> <strong>quartz</strong> over copper has to do with the use <strong>of</strong> an<br />
electrically insulating versus electrically conducting material.<br />
If the latter is used, then insulating spacers are needed to<br />
electrically isolate the high and low capacitor plates from<br />
one another. Un<strong>for</strong>tunately, these insulating spacers are at<br />
critical positions in the <strong>cell</strong>. As a result, differential thermal<br />
expansion effects will occur that must be subtracted from<br />
any measurement data. This adds an additional contribution<br />
to the empty <strong>cell</strong> effect, which, ideally, should be due only to<br />
the thermal expansion <strong>of</strong> the capacitor plate area and the gap.<br />
If a thermal expansion <strong>cell</strong> is <strong>constructed</strong> <strong>of</strong> an electrically<br />
insulating material, such as <strong>fused</strong> <strong>quartz</strong>, no insulator is required<br />
to electrically isolate the capacitor plates; thus the<br />
empty <strong>cell</strong> effect should be better behaved and most likely<br />
smaller in magnitude. The empty <strong>cell</strong> effect is determined by<br />
measuring the capacitance versus temperature <strong>of</strong> the <strong>dilatometer</strong><br />
<strong>cell</strong> with a piece <strong>of</strong> the material from which the <strong>cell</strong> is<br />
<strong>constructed</strong> in place <strong>of</strong> a sample.<br />
The second advantage <strong>of</strong> a <strong>fused</strong> <strong>quartz</strong> <strong>cell</strong> over one<br />
<strong>constructed</strong> <strong>of</strong> copper has to do with the very small thermal<br />
expansion <strong>of</strong> <strong>fused</strong> <strong>quartz</strong>. This leads to a far smaller contribution<br />
<strong>of</strong> the <strong>cell</strong> material to any measurement data i.e., a<br />
smaller relative effect over a large temperature range. However,<br />
at 27 K the thermal expansion coefficient magnitudes<br />
are equal <strong>for</strong> <strong>fused</strong> <strong>quartz</strong> and copper, and below this temperature,<br />
that <strong>of</strong> copper is smaller. 21,22 Thus, as far as the<br />
relative effect is concerned see Sec. III D, there is no clear<br />
advantage <strong>of</strong> <strong>fused</strong> <strong>quartz</strong> over copper below 27 K.<br />
B. Empty <strong>cell</strong> effect<br />
We begin by evaluating the empty <strong>cell</strong> effect, which can<br />
easily be calculated. It is given by<br />
CT = C 300 1+LT/L 300 ,<br />
5<br />
where CT is the temperature-dependent capacitance, C 300 is<br />
the capacitance at 300 K, LT/L 300 is the linear thermal<br />
expansion <strong>of</strong> the material from which the <strong>cell</strong> is <strong>constructed</strong><br />
normalized to the length at 300 K, L 300 , and LT=LT<br />
−L 300 . Equation 5 is the ideal case scenario. It includes<br />
only the effects associated with the temperature-dependent<br />
capacitor plate area and gap.<br />
Figure 3 shows the calculation using Eq. 5 and linear<br />
Downloaded 24 Mar 2008 to 153.90.194.137. Redistribution subject to AIP license or copyright; see http://rsi.aip.org/rsi/copyright.jsp
033903-5 Fused <strong>quartz</strong> <strong>dilatometer</strong> <strong>cell</strong> Rev. Sci. Instrum. 79, 033903 2008<br />
C(T)/C<br />
300<br />
1.002<br />
0.9980<br />
0.9940<br />
0.9900<br />
<strong>fused</strong> <strong>quartz</strong> <strong>cell</strong> - measured<br />
copper <strong>cell</strong> - expected<br />
copper <strong>cell</strong> - measured<br />
0.9860<br />
0 50 100 150 200 250 300<br />
temperature (K)<br />
FIG. 4. The top curve is the measured empty <strong>cell</strong> effect <strong>for</strong> our <strong>fused</strong> <strong>quartz</strong><br />
<strong>dilatometer</strong> <strong>cell</strong>. The middle curve is the expected empty <strong>cell</strong> effect <strong>for</strong> a<br />
copper <strong>dilatometer</strong> <strong>cell</strong> determined with Eq. 5 and the bottom curve is that<br />
observed in measurements with our copper <strong>dilatometer</strong> <strong>cell</strong>.<br />
thermal expansion data <strong>for</strong> <strong>fused</strong> <strong>quartz</strong>. 21 These particular<br />
<strong>fused</strong> <strong>quartz</strong> data are used since they are determined from an<br />
absolute measurement rather than a relative measurement. In<br />
the latter, the thermal expansion <strong>of</strong> the material from which<br />
the <strong>cell</strong> was <strong>constructed</strong> would have been subtracted. Along<br />
with the expected empty <strong>cell</strong> effect, the observed effect is<br />
shown, as determined through measurements using the <strong>cell</strong><br />
described herein. These data are typical <strong>of</strong> what we have<br />
observed <strong>for</strong> numerous <strong>cell</strong>s. We believe that the discrepancy<br />
between the observed and expected curves is due to contributions<br />
from the glue and imperfect surfaces on which the<br />
springs are glued. At the onset <strong>of</strong> this project, our measured<br />
empty <strong>cell</strong> effect was more than 200 times larger than that<br />
shown in Fig. 3. This was due to an excessive amount <strong>of</strong> glue<br />
on the springs, which caused the springs to bend. The gluing<br />
method we have developed Sec. II A minimizes the amount<br />
<strong>of</strong> glue used, encourages a flat glue joint and flat spring, and<br />
thus minimizes the observed empty <strong>cell</strong> effect. Another<br />
source <strong>for</strong> the previously larger empty <strong>cell</strong> effect was the use<br />
<strong>of</strong> a CuBe spring to hold a <strong>fused</strong> <strong>quartz</strong> sample block previously<br />
used instead <strong>of</strong> the <strong>quartz</strong> wedge against the sample<br />
to maintain the sample position. 12,13 Due to the large thermal<br />
expansion <strong>of</strong> CuBe relative to <strong>fused</strong> <strong>quartz</strong>, this led to large<br />
and sometimes irreproducible features in the empty <strong>cell</strong> effect.<br />
The goal <strong>of</strong> eliminating any metal spring on the <strong>cell</strong> led<br />
us to the <strong>quartz</strong> wedge design.<br />
It is instructive to compare the data in Fig. 3 to similar<br />
data <strong>for</strong> a thermal expansion <strong>cell</strong> <strong>constructed</strong> <strong>of</strong> copper. To<br />
realize this, we <strong>constructed</strong> a <strong>cell</strong> similar to that reported by<br />
Schmiedesh<strong>of</strong>f et al. 9 The details <strong>of</strong> this construction will not<br />
be discussed herein. Figure 4 illustrates this comparison by<br />
showing the measured empty <strong>cell</strong> effect <strong>for</strong> the <strong>fused</strong> <strong>quartz</strong><br />
<strong>cell</strong> topmost curve, the expected empty <strong>cell</strong> effect <strong>for</strong> a<br />
copper <strong>cell</strong> middle curve calculated using Eq. 5 and published<br />
linear thermal expansion data, 22 and the measured effect<br />
<strong>for</strong> our copper <strong>cell</strong>. Comparing the top two curves first,<br />
the expected empty <strong>cell</strong> effect <strong>for</strong> copper is 35 times larger<br />
than our measured effect <strong>for</strong> the <strong>fused</strong> <strong>quartz</strong> <strong>cell</strong>; the maximum<br />
magnitudes <strong>of</strong> CT/C 300 are used <strong>for</strong> this and the following<br />
comparison. The measured effect <strong>for</strong> the copper <strong>cell</strong><br />
lowest curve in Fig. 4 is 4 times larger than the expected<br />
effect and 140 times larger than our observed empty <strong>cell</strong><br />
effect <strong>for</strong> the <strong>fused</strong> <strong>quartz</strong> <strong>cell</strong>. Furthermore, there are large<br />
discontinuous features in the data which can be difficult to<br />
reliably subtract from measurement data taken with a sample<br />
installed in the <strong>cell</strong>. We believe that these features and the<br />
large overall observed empty <strong>cell</strong> effect <strong>for</strong> our copper <strong>cell</strong><br />
compared to the expected behavior can be attributed to differential<br />
thermal expansion effects. Most likely, these could<br />
be minimized through clever improvements in the design.<br />
However, the best empty <strong>cell</strong> effect <strong>for</strong> a copper <strong>cell</strong> will<br />
never be reduced to that <strong>of</strong> a <strong>cell</strong> <strong>constructed</strong> <strong>of</strong> <strong>fused</strong> <strong>quartz</strong>.<br />
We take a moment to view the empty <strong>cell</strong> effects from<br />
the perspective <strong>of</strong> how large a correction they would be to<br />
typical measured L values. For this, we make use <strong>of</strong> A<br />
=1800 pF m and C 300 =15 pF see Sec. III C. For the<br />
<strong>fused</strong> <strong>quartz</strong> <strong>cell</strong>, the CT/C 300 values at 300 and 150 K<br />
0.9999 can be used to calculate the correction in terms <strong>of</strong> a<br />
length from L corr =1/CT−1/C 300 . This leads to the value<br />
L corr =12 nm. For our copper <strong>cell</strong>, an estimate using similar<br />
A and C 300 values but CT/C 300 at 215 K <strong>of</strong> 0.986 reveals<br />
L corr =1.7 m. This value is more than 30% <strong>of</strong> the overall<br />
thermal expansion 13 <strong>of</strong> MgB 2 from 5 KT300 K! The<br />
small empty <strong>cell</strong> effect <strong>of</strong> the <strong>fused</strong> <strong>quartz</strong> <strong>cell</strong> is an important<br />
advantage in determining the absolute thermal expansion<br />
<strong>of</strong> the sample, especially when the sample is small where<br />
L will also be small or in the case <strong>of</strong> samples with small<br />
thermal expansions.<br />
C. Calibration<br />
In the course <strong>of</strong> this project, we have utilized two methods<br />
<strong>of</strong> calibrating the thermal expansion <strong>cell</strong>. The first is,<br />
ideally, devoid <strong>of</strong> any contribution from <strong>fused</strong> <strong>quartz</strong> itself.<br />
The procedure is as follows. After measuring the empty <strong>cell</strong><br />
effect <strong>for</strong> one <strong>of</strong> our <strong>cell</strong>s, we install a piece <strong>of</strong> annealed,<br />
high-purity, polycrystalline copper. Generally, this specimen<br />
is roughly 2 mm in length. We then measure the capacitance<br />
vs T from 5 to 300 K. Naturally, due to the relative effect,<br />
there is a contribution <strong>of</strong> <strong>fused</strong> <strong>quartz</strong> to these data. However,<br />
L/L 300 is zero at 300 and 79.3 K <strong>for</strong> <strong>fused</strong> <strong>quartz</strong>. As<br />
a result, there is no contribution <strong>of</strong> <strong>fused</strong> <strong>quartz</strong> to measurements<br />
at these two temperatures and the calibration routine<br />
reduces to, after subtraction <strong>of</strong> the empty <strong>cell</strong> effect, the adjustment<br />
<strong>of</strong> A until the curve calculated via<br />
L/L 300 = A/L Cu 1/CT −1/C 300 ,<br />
6<br />
overlaps the two points. In Eq. 6, L Cu is the length <strong>of</strong> our<br />
copper sample at 300 K and C 300 is the capacitance at 300 K.<br />
One <strong>of</strong> the reasons <strong>for</strong> choosing this method was to isolate<br />
our calibration from the published data <strong>for</strong> copper below<br />
15 K, <strong>for</strong> which Kroeger and Swenson have noted 22 that<br />
there is no agreement among published results. Since the<br />
agreement at 300 and 79.3 K is reliable, 22–24 we only used<br />
these two temperatures. However, the maximum disagreement<br />
with the published L/L 300 data 22 is about 1% with this<br />
method; this is at 5 K. Most likely, this can be attributed to<br />
slight variations <strong>of</strong> the temperature where L/L 300 crosses<br />
zero <strong>for</strong> different varieties <strong>of</strong> <strong>fused</strong> <strong>quartz</strong>. We mention this<br />
method due to the novel approach and because future work<br />
Downloaded 24 Mar 2008 to 153.90.194.137. Redistribution subject to AIP license or copyright; see http://rsi.aip.org/rsi/copyright.jsp
033903-6 Neumeier et al. Rev. Sci. Instrum. 79, 033903 2008<br />
Quartz Wedge<br />
Sample<br />
110<br />
108<br />
106<br />
copper <strong>cell</strong> - uncorrected<br />
LQ<br />
Stationary Plate<br />
Moveable Plate<br />
d (µm)<br />
104<br />
102<br />
FIG. 5. Diagram illustrating the region <strong>of</strong> the <strong>cell</strong> near the sample. The right<br />
capacitor plate movable plate position is determined by the sample, while<br />
the left capacitor plate stationary plate position is determined by the thermal<br />
expansion <strong>of</strong> a length <strong>of</strong> <strong>quartz</strong> L Q equal to the length <strong>of</strong> the sample<br />
minus the capacitor gap d.<br />
might have better access to more precise data <strong>for</strong> specific<br />
types <strong>of</strong> <strong>fused</strong> <strong>quartz</strong>.<br />
The second calibration method, which we currently use<br />
after subtraction <strong>of</strong> the empty <strong>cell</strong> effect is to adjust <strong>for</strong> the<br />
relative effect see Sec. III D and fit A simultaneously to<br />
obtain the best possible fit to L/L 300 data <strong>for</strong> copper. Generally,<br />
an iterative approach would be used. This method<br />
yields L/L 300 data <strong>for</strong> our copper sample differing from the<br />
published L/L 300 data 22 by no more than 810 −6 over the<br />
whole temperature range. Typical obtained values <strong>for</strong> A are<br />
in the 1600–2000 pF m range. In most experiments, we<br />
measure in the 10–20 pF range d=200–100 m.<br />
D. Corrections due to thermal expansion <strong>of</strong> <strong>cell</strong>: The<br />
relative effect<br />
Besides the empty <strong>cell</strong> effect, a very important aspect is<br />
the correction necessary to compensate <strong>for</strong> the thermal expansion<br />
<strong>of</strong> the <strong>cell</strong> itself. This can be best appreciated by the<br />
drawing shown in Fig. 5. We emphasize that the geometry in<br />
Fig. 5 is chosen <strong>for</strong> clarity, but the argument given below is<br />
valid <strong>for</strong> any geometry in which the <strong>cell</strong> and sample are in<br />
thermal equilibrium and the capacitor plates are parallel. The<br />
drawing illustrates the region near the sample. The capacitor<br />
gap d is determined by the separation between the movable<br />
capacitor plate on the right and the stationary capacitor<br />
plate on the left. The position <strong>of</strong> the movable capacitor<br />
plate is clearly determined by the right side <strong>of</strong> the sample.<br />
However, the length L Q in Fig. 5 will be determined solely<br />
by the linear thermal expansion <strong>of</strong> <strong>fused</strong> <strong>quartz</strong>. As a result,<br />
the linear thermal expansion <strong>of</strong> any sample must be adjusted<br />
<strong>for</strong> the thermal expansion <strong>of</strong> a length <strong>of</strong> <strong>fused</strong> <strong>quartz</strong>, L Q<br />
=L S −d, where L S is the length <strong>of</strong> the sample. The correction<br />
is calculated with<br />
L Q T = L 300 Q 1+L/L 300 .<br />
7<br />
In Eq. 7, L/L 300 is the linear thermal expansion <strong>of</strong> <strong>fused</strong><br />
<strong>quartz</strong> 21 and L 300 Q is the value <strong>of</strong> L Q at 300 K. We refer to this<br />
as the relative effect. Furthermore, it should be clear from the<br />
diagram in Fig. 5 that one can never use a <strong>fused</strong> <strong>quartz</strong> <strong>cell</strong> to<br />
measure the thermal expansion <strong>of</strong> <strong>fused</strong> <strong>quartz</strong>.<br />
The importance <strong>of</strong> this correction <strong>for</strong> the comparison <strong>of</strong><br />
<strong>fused</strong> <strong>quartz</strong> and copper thermal expansion <strong>cell</strong>s can only be<br />
d<br />
100<br />
98<br />
<strong>quartz</strong> <strong>cell</strong> - corrected<br />
0 50 100 150 200 250 300<br />
temperature (K)<br />
FIG. 6. The capacitor gap d vs T. Lowest curve at 5 K is the raw data<br />
after correction <strong>for</strong> the empty <strong>cell</strong> effect <strong>for</strong> the gap <strong>of</strong> our <strong>fused</strong> <strong>quartz</strong><br />
<strong>dilatometer</strong> <strong>cell</strong> from measurements <strong>of</strong> a 4238 m long sample <strong>of</strong> MgB 2 .<br />
The curve just above at 5 K was corrected <strong>for</strong> the relative effect associated<br />
with the thermal expansion <strong>of</strong> <strong>fused</strong> <strong>quartz</strong>. The top curve represents the<br />
expected behavior if an identical sample was measured in a <strong>dilatometer</strong> <strong>cell</strong><br />
<strong>constructed</strong> <strong>of</strong> copper; this curve includes the relative effect; no empty <strong>cell</strong><br />
effect has been added.<br />
appreciated by considering measurements <strong>of</strong> a sample other<br />
than copper. For this reason, we use measurements on MgB 2<br />
which were published previously. 13 Figure 6 shows the gap<br />
<strong>of</strong> our thermal expansion <strong>cell</strong> versus temperature <strong>for</strong> actual<br />
measurements <strong>of</strong> a 4238 m long sample <strong>of</strong> MgB 2 . The<br />
curve which shows the smallest gap at 5 K is the data after<br />
subtraction <strong>of</strong> the empty <strong>cell</strong> effect. Correction <strong>for</strong> the thermal<br />
expansion <strong>of</strong> <strong>quartz</strong> i.e., the relative effect yields the<br />
curve which lies slightly above it at 5 K. Because <strong>of</strong> the fact<br />
that <strong>fused</strong> <strong>quartz</strong> initially contracts on cooling and then expands<br />
reaching the same length at 79.3 K as at room<br />
temperature, 21 the corrected data cross over the uncorrected<br />
data at 79.3 K. The top curve shows the expected gap if the<br />
same measurement was conducted in a copper thermal expansion<br />
<strong>cell</strong>. Because the thermal expansion <strong>of</strong> copper is<br />
roughly three times that <strong>of</strong> polycrystalline MgB 2 , when the<br />
sample shrinks, the gap actually gets larger see diagram in<br />
Fig. 5 as a result <strong>of</strong> the relative effect. This behavior was<br />
calculated using the published data 13 <strong>for</strong> MgB 2 , the value<br />
d=101.8 m at 300 K, and an equation identical to Eq. 7<br />
with the published L/L 300 values 22 <strong>for</strong> copper. The data in<br />
this plot illustrate a distinct advantage <strong>of</strong> the <strong>fused</strong> <strong>quartz</strong><br />
<strong>cell</strong> in that the correction <strong>for</strong> the thermal expansion <strong>of</strong> the<br />
material from which the <strong>cell</strong> is <strong>constructed</strong> i.e., the relative<br />
effect is 63 times smaller <strong>for</strong> <strong>fused</strong> <strong>quartz</strong> <strong>for</strong> the specific<br />
case <strong>of</strong> MgB 2 .<br />
IV. PERFORMANCE OF THE FUSED QUARTZ<br />
THERMAL EXPANSION CELL<br />
Rather than use an excessive amount <strong>of</strong> space to illustrate<br />
the per<strong>for</strong>mance <strong>of</strong> the <strong>cell</strong> described herein, we refer to<br />
some recently published work and show one example <strong>of</strong><br />
work in progress to highlight the utility <strong>of</strong> this device. The<br />
<strong>cell</strong> was used to investigate the critical behavior <strong>of</strong> a ferromagnetic<br />
phase transition 25 in La 0.7 Ca 0.3 MnO 3 . Although the<br />
Downloaded 24 Mar 2008 to 153.90.194.137. Redistribution subject to AIP license or copyright; see http://rsi.aip.org/rsi/copyright.jsp
033903-7 Fused <strong>quartz</strong> <strong>dilatometer</strong> <strong>cell</strong> Rev. Sci. Instrum. 79, 033903 2008<br />
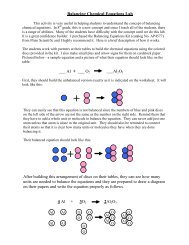
µ (10 -8 K -1 )<br />
14<br />
12<br />
10<br />
8<br />
6<br />
4<br />
Nb single crystal<br />
T<br />
c<br />
2<br />
5 7 9 11 13 15<br />
temperature (K)<br />
FIG. 7. Thermal expansion coefficient <strong>of</strong> a 10.818 mm long single crystal<br />
<strong>of</strong> Nb near the superconducting transition temperature T c . Clearly evident is<br />
the jump in expected <strong>for</strong> a second-order phase transition.<br />
feature in the thermal expansion coefficient at the ferromagnetic<br />
transition temperature T c is quite large in this system,<br />
the need to have little scatter in the data as T c is approached<br />
from above or below in order to determine the<br />
critical exponent is challenging. The data shown in Fig. 3<br />
<strong>of</strong> Souza et al. 25 were determined from a point-by-point derivative<br />
<strong>of</strong> L/L and were not subjected to any smoothing.<br />
Finally, in this work, we evaluated a fundamental relation<br />
from thermodynamics which uses the overlap <strong>of</strong> T and<br />
the heat capacity C P to prove that the phase transition is<br />
continuous.<br />
As noted above, the <strong>cell</strong> was used to measure the thermal<br />
expansion <strong>of</strong> the superconducting compound 13 MgB 2 .<br />
We found that obtaining sufficient resolution to observe the<br />
normal to superconducting phase transition was especially<br />
challenging. In particular, special attention to grounding <strong>of</strong><br />
the experimental system was essential in obtaining the<br />
110 −6 pF stability in our capacitance bridge that was required<br />
to yield subangstrom resolution. That resolution was<br />
indeed obtained as is evident in the inset <strong>of</strong> Fig. 3 in that<br />
publication. 13 Despite the ex<strong>cell</strong>ent resolution <strong>of</strong> the L/L<br />
data, obtaining the thermal expansion coefficient was more<br />
problematic because <strong>of</strong> the relative poor resolution <strong>of</strong> the<br />
temperature channel 26 and less than adequate control <strong>of</strong> our<br />
temperature ramping rate, which has improved since the time<br />
<strong>of</strong> publication. As a result, the L/L data were carefully<br />
fitted with Chebyshev polynomials prior to taking the temperature<br />
derivative to determine . This procedure was described<br />
previously. 13<br />
More recently, we have measured the normal to superconducting<br />
phase transition <strong>of</strong> a 10.818 mm long single crystal<br />
<strong>of</strong> Nb. These measurements have incorporated the most<br />
recent improvements to the heating routing Secs. II C and<br />
III D. Our approach in this case was to measure L/L in the<br />
vicinity <strong>of</strong> T c 14 times, differentiate each curve to obtain ,<br />
and average all <strong>of</strong> the data sets. 27 The results are shown in<br />
Fig. 7. The jump in at T c is expected <strong>for</strong> the second-order<br />
phase transition from the superconducting to the normal<br />
state. The ability to clearly observe the jump at T c in a superconductor<br />
serves well to exemplify the high resolution <strong>of</strong><br />
our dilatometry system since the effect is very small. Note<br />
that the jump in Nb is about 4.5 times smaller than the<br />
jump 13 in MgB 2 .<br />
Another investigation with this <strong>cell</strong> was the paramagnetic<br />
to antiferromagnetic phase transition 28 in Na 0.80 CoO 2<br />
and Na 0.75 CoO 2 . There we were able to observe the paramagnetic<br />
to antiferromagnetic phase transition and to determine<br />
the critical exponent associated with the phase transition.<br />
Since the measured samples were single crystals, we were<br />
able to clearly observe the anisotropy in L/L and in our<br />
data. In addition, we used the method reported previously 25<br />
to show that the phase transitions are continuous.<br />
Finally, we note our measurements <strong>of</strong> the thermal expansion<br />
<strong>of</strong> single crystalline Li 0.9 Mo 6 O 17 , which is a well-known<br />
quasi-one-dimensional conductor. 29 The samples are plateletlike<br />
single crystals with very poor electrical conductivity out<br />
<strong>of</strong> the platelet plane. In this study, the two measured crystals<br />
had thicknesses <strong>of</strong> 0.523 and 0.308 mm; the thermal expansion<br />
<strong>for</strong> these lengths was easily determined with our <strong>fused</strong><br />
<strong>quartz</strong> <strong>cell</strong>. This is a tribute to the small empty <strong>cell</strong> effect.<br />
The high planar electrical conductivity <strong>of</strong> this compound is<br />
dominated by zigzag Mo–O chains which lie along the b<br />
axis. Our thermal expansion data were able to show that the<br />
zigzag chains move closer together with cooling because <strong>of</strong><br />
the large thermal expansion <strong>of</strong> the a axis. In fact, relative to<br />
the planar b and c axes, this distance contracts at least twice<br />
as strongly. This facilitates a crossover in dimensionality that<br />
leads to superconductivity at low temperature, a threedimensional<br />
phenomenon.<br />
V. CONCLUSION<br />
This report has described our thermal expansion measurement<br />
system, the heart <strong>of</strong> which is a novel thermal expansion<br />
<strong>cell</strong> <strong>constructed</strong> entirely from <strong>fused</strong> <strong>quartz</strong>. There<br />
are two main advantages <strong>of</strong> this <strong>cell</strong> over <strong>cell</strong>s <strong>constructed</strong> <strong>of</strong><br />
copper. First, is that <strong>quartz</strong> is an electrical insulator, which<br />
alleviates the problem <strong>of</strong> electrically isolating the capacitor<br />
plates in copper thermal expansion <strong>cell</strong>s. This leads to a far<br />
smaller empty <strong>cell</strong> effect. Second is the significantly smaller<br />
thermal expansion <strong>of</strong> <strong>fused</strong> <strong>quartz</strong>, which leads to a substantially<br />
smaller contribution to measurement data from the<br />
thermal expansion <strong>of</strong> the <strong>cell</strong> i.e., a smaller relative effect.<br />
Furthermore, the <strong>cell</strong> is simple in design, being composed <strong>of</strong><br />
only five parts. A number <strong>of</strong> recent measurements with <strong>cell</strong>s<br />
<strong>of</strong> this design were highlighted. Some <strong>of</strong> the developments in<br />
this work could be applied in the construction <strong>of</strong> <strong>cell</strong>s from<br />
other materials such as silicon 11 and sapphire, and <strong>for</strong> special<br />
applications, such as use in pulsed magnetic fields where<br />
eddy current heating could be limited by the use <strong>of</strong> an electrical<br />
insulator. We also presented aspects <strong>of</strong> thermometry<br />
and heating that are important to dilatometry measurements.<br />
ACKNOWLEDGMENTS<br />
We are especially thankful to Michael Kund and<br />
Klaus Andres <strong>for</strong> their assistance and encouragement<br />
during the early stages <strong>of</strong> this project and Michael Simmonds<br />
<strong>for</strong> his continued interest and assistance. We thank Michael<br />
Downloaded 24 Mar 2008 to 153.90.194.137. Redistribution subject to AIP license or copyright; see http://rsi.aip.org/rsi/copyright.jsp
033903-8 Neumeier et al. Rev. Sci. Instrum. 79, 033903 2008<br />
Hundley <strong>for</strong> his help in unraveling the problems with the<br />
Lakeshore 340 firmware. We have benefited from George<br />
Schmiedesh<strong>of</strong>f’s sharing <strong>of</strong> his copper-<strong>cell</strong> design. Thanks to<br />
David Cebulla <strong>for</strong> making the drawings in Fig. 1, to Hugo<br />
Sandim <strong>for</strong> the Nb single crystal, and to Stan Tozer <strong>for</strong> the<br />
microcoax used in our Faraday cage. This material is <strong>based</strong><br />
upon work supported by the National Science Foundation<br />
Grant Nos. DMR-0301166 and 9982834 CAREER,<br />
DMR-0504769, DMR-0552458 REU-Site, and DMR-<br />
0244058 REU-Site and the U.S. Department <strong>of</strong> Energy<br />
Office <strong>of</strong> Basic Energy Sciences Grant No. DE-FG-<br />
06ER46269. Partial financial support from Florida Atlantic<br />
University and Montana State University is gratefully<br />
acknowledged.<br />
1 T. H. K. Barron and G. K. White, Heat Capacity and Thermal Expansion<br />
at Low Temperatures Kluwer Academic, New York, 1999.<br />
2 B. Yates, Thermal Expansion Plenum, New York, 1972.<br />
3 S. Kanagaraj and S. Pattanayak, Cryogenics 43, 399 2003.<br />
4 K. Andres, Cryogenics 2, 931961; K. Andres and H. Rohrer, Helv.<br />
Phys. Acta 34, 398 1961.<br />
5 G. K. White, Cryogenics 1, 1511961.<br />
6 G. Brändli and R. Griessen, Cryogenics 13, 299 1973.<br />
7 R. Pott and R. Schefzyk, J. Phys. E 16, 444 1983.<br />
8 M. Rotter, H. Müller, E. Gratz, M. Doerr, and M. Loewenhaupt, Rev. Sci.<br />
Instrum. 69, 2742 1998.<br />
9 G. M. Schmiedesh<strong>of</strong>f, A. W. Lounsbury, D. J. Luna, S. J. Tracy, A. J.<br />
Schramm, S. W. Tozer, V. F. Correa, S. T. Hannahs, T. P. Murphy, E. C.<br />
Palm, A. H. Lacerda, S. L. Bud’ko, P. C. Canfield, J. L. Smith, J. C.<br />
Lashley, and J. C. Cooley, Rev. Sci. Instrum. 77, 123907 2006.<br />
10 M. O. Steinitz, J. Genossar, W. Schnepf, and D. A. Tindall, Rev. Sci.<br />
Instrum. 57, 2971986.<br />
11 R. Villar, M. Hortal, and S. Vieira, Rev. Sci. Instrum. 51, 271980.<br />
12 M. Kund, Uniaxiale Effekte in Organischen und Keramischen<br />
Supraleitern Verlag Harri Deutsch, Frankfurt, 1995.<br />
13 J. J. Neumeier, T. Tomita, M. Debassai, J. S. Schilling, P. W. Barnes, D. G.<br />
Hinks, and J. D. Jorgensen, Phys. Rev. B 72, 220505R 2005.<br />
14 E. V. Angerer, Technische Kunstgriffe bei Physikalischen Untersuchungen<br />
Friedr. Vieweg and Sohn, Braunschweig, 1966, p.59.<br />
15 E. J. Elliffe, J. Bogenstahl, A. Deshpande, J. Hough, C. Killow, S. Reid,<br />
D. Robertson, S. Rowan, H. Ward, and G. Cagnoli, Class. Quantum Grav.<br />
22, S257 2005.<br />
16 Herasil I has since been replaced by Herasil 102 see www.heraeusoptics.com.<br />
17 This product can be found at www.aremco.com.<br />
18 During grinding, the machine operator should wear a dust mask to protect<br />
against inhalation <strong>of</strong> the <strong>quartz</strong> mist, which could lead to silicosis.<br />
19 We use the Cernox thermometer with part No. CX-1070-SD because <strong>of</strong> its<br />
large dR/dT. The excitation level <strong>of</strong> 10 mV, higher than the recommended<br />
ranges, reduces thermometer noise.<br />
20 If one calculates the thermal expansion coefficient =1/L 300 dL/dT<br />
using temperature values interpolated with the Lakeshore 340 firmware,<br />
distinct steps in the data occur. This results from the 340’s assumption that<br />
the temperature is linear between each set <strong>of</strong> two calibration points. Jumps<br />
were also evident in the data at each tabulated calibration point. We have<br />
not checked whether or not this naïve approach was improved upon in<br />
later firmware versions. This weakness aside, the Lakeshore 340 measures<br />
resistance with per<strong>for</strong>mance on par with modern voltmeter/current-source<br />
devices and its computer-controlled power supply has proven to be an<br />
ex<strong>cell</strong>ent and stable source <strong>for</strong> the heater in this experiment.<br />
21 M. Okaji, N. Yamada, K. Nara, and H. Kato, Cryogenics 35, 8871995;<br />
these data were extended above 273 K using data in Ref. 1.<br />
22 F. R. Kroeger and C. A. Swenson, J. Appl. Phys. 48, 853 1977.<br />
23 K. Wang and R. R. Reeber, High Temp. Mater. Sci. 35, 1811996.<br />
24 M. Okaji, N. Yamada, H. Kato, and K. Nara, Cryogenics 37, 2511997.<br />
25 J. A. Souza, Y.-K. Yu, J. J. Neumeier, and R. F. Jardim, Phys. Rev. Lett.<br />
94, 207209 2005.<br />
26 While the capacitance bridge has a resolution <strong>of</strong> one part in 10 9 , the<br />
Lakeshore 340 has a resistance resolution <strong>of</strong> one part in 10 5 or 10 6 depending<br />
on the resistance range. This has a major impact on the calculation<br />
<strong>of</strong> the thermal expansion coefficient =1/L 300 dL/dT, leading to<br />
scatter in the data.<br />
27 R. K. Bollinger, C. A. M. dos Santos, H. R. Z. Sandim, and J. J. Neumeier<br />
unpublished.<br />
28 C. A. M. dos Santos, J. J. Neumeier, Y.-K. Yu, R. K. Bollinger, R. Jin, D.<br />
Mandrus, and B. C. Sales, Phys. Rev. B 74, 132402 2006.<br />
29 C. A. M. dos Santos, B. D. White, Y.-K. Yu, J. J. Neumeier, and J. A.<br />
Souza, Phys. Rev. Lett. 98, 266405 2007.<br />
Downloaded 24 Mar 2008 to 153.90.194.137. Redistribution subject to AIP license or copyright; see http://rsi.aip.org/rsi/copyright.jsp