Journal of Luminescence 107 (2004) - Department of Physics ...
Journal of Luminescence 107 (2004) - Department of Physics ...
Journal of Luminescence 107 (2004) - Department of Physics ...

You also want an ePaper? Increase the reach of your titles
YUMPU automatically turns print PDFs into web optimized ePapers that Google loves.
ARTICLE IN PRESS<br />
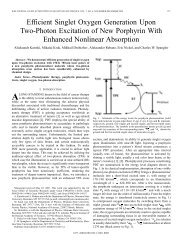
M. Drobizhev et al. / <strong>Journal</strong> <strong>of</strong> <strong>Luminescence</strong> <strong>107</strong> (<strong>2004</strong>) 194–202 197<br />
shows even smaller modulation depth, M ¼ 0:24:<br />
The lowest M ¼ 0:15 is observed for Pc 3 An, where<br />
the Debye–Waller factor (a 1 ¼ 0:63 [15]) is larger<br />
than that <strong>of</strong> Chl. This first observation can suggest<br />
the important role <strong>of</strong> molecular symmetry in TPAinduced<br />
gratings. More specifically, it seems that<br />
molecules with broken inversion symmetry demonstrate<br />
deeper TPA fringes (sharper homogeneous<br />
TPA spectrum) than molecules possessing<br />
center <strong>of</strong> inversion, cf. Chl and SiNc. The case <strong>of</strong><br />
Pc 3 An can be considered as an intermediate one,<br />
since the main electronic conjugation path in<br />
tetrapyrrolic ring is not broken (cf. chlorin), but<br />
mono-anthraceno substitution can introduce certain<br />
asymmetry. By comparing the modulation<br />
contrast in Fig. 1, we can just qualitatively<br />
estimate at this moment that the sharpness <strong>of</strong><br />
TPA spectrum <strong>of</strong> Pc 3 An is closer to that <strong>of</strong><br />
SiNc.<br />
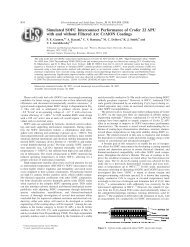
To get more insight into the role <strong>of</strong> molecular<br />
symmetry in homogeneous TPA spectrum, we<br />
measured the temperature dependence <strong>of</strong> TPA<br />
fringes in two extreme cases, i.e. for symmetrical<br />
SiNc and non-symmetrical Chl. The results are<br />
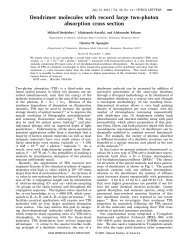
presented in Fig. 3. In both cases, an increase <strong>of</strong><br />
temperature results in diminishing contrast <strong>of</strong> the<br />
fringes. The striking difference between the two<br />
systems is that in Chl the fringes shift to the red<br />
with increasing temperature, whereas in SiNc this<br />
shift is much less pronounced. Indeed, for Chl the<br />
observed shift <strong>of</strong> the grating constitutes a half <strong>of</strong><br />
its period upon increasing temperature from 4 to<br />
60 K. We checked that this shift was completely<br />
reversible when temperature was lowered down to<br />
4 K again, thus ensuring that it is inherent<br />
property<strong>of</strong> the sample.<br />
In order to quantitativelysimulate the temperature<br />
dependence <strong>of</strong> TPA-induced gratings, presented<br />
in Fig. 3, we have elaborated a simple<br />
model described in the next section.<br />
4. The model<br />
The fluorescence spectrum <strong>of</strong> an inhomogeneouslybroadened<br />
ensemble <strong>of</strong> molecules, excited<br />
bylight with two-photon ‘‘action’’ spectrum Iðn 00 Þ<br />
(proportional to the square <strong>of</strong> the Fourier transform<br />
<strong>of</strong> the electric field squared [2,3]) is<br />
Fðn; TÞ ¼<br />
Z N<br />
N<br />
Nðn 0 Þg 1 ðn n 0 ; TÞ dn 0<br />
Z N<br />
g 2 ðn 00 n 0 ; TÞIðn 00 Þ dn 00 ; ð2Þ<br />
N<br />
Chl<br />
100K<br />
SiNc<br />
120K<br />
Fluorescence intensity<br />
60K<br />
50K<br />
30K<br />
11K<br />
50K<br />
30K<br />
11K<br />
(a)<br />
4K<br />
15500 15750 16000 16250<br />
4.5K<br />
12250 12500 12750 13000<br />
Frequency, cm -1 (b) Frequency, cm -1<br />
Fig. 3. S 1 2S 0 fluorescence spectra <strong>of</strong> Chl- (a) and Si-naphthalocyanine- (b) doped PVB film obtained at different temperatures upon<br />
excitation with pairs <strong>of</strong> femtosecond pulses. Vertical line in each plot correspond to one selected peak in the grating at lowest<br />
temperature. For Chl, a large red shift <strong>of</strong> the grating is observed at increasing temperature, whereas for SiNc this shift is much smaller.