Tracked Version of Core Strategy, November 2012 - Selby District ...
Tracked Version of Core Strategy, November 2012 - Selby District ...
Tracked Version of Core Strategy, November 2012 - Selby District ...

You also want an ePaper? Increase the reach of your titles
YUMPU automatically turns print PDFs into web optimized ePapers that Google loves.
<strong>Selby</strong> <strong>District</strong> Submission Draft <strong>Core</strong> <strong>Strategy</strong> – May 2011<br />
___________________________________________________________________<br />
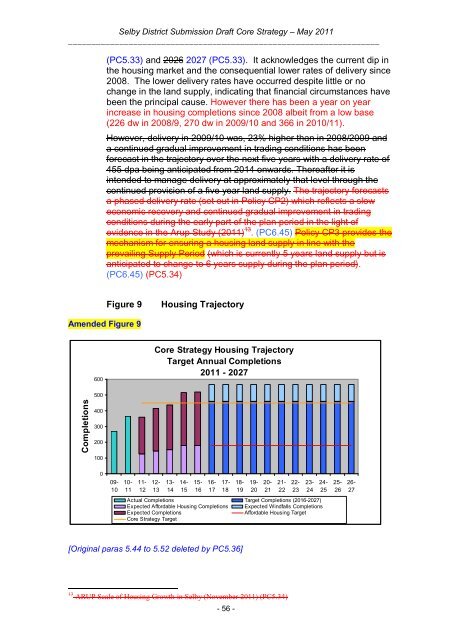
(PC5.33) and 2026 2027 (PC5.33). It acknowledges the current dip in<br />
the housing market and the consequential lower rates <strong>of</strong> delivery since<br />
2008. The lower delivery rates have occurred despite little or no<br />
change in the land supply, indicating that financial circumstances have<br />
been the principal cause. However there has been a year on year<br />
increase in housing completions since 2008 albeit from a low base<br />
(226 dw in 2008/9, 270 dw in 2009/10 and 366 in 2010/11).<br />
However, delivery in 2009/10 was, 23% higher than in 2008/2009 and<br />
a continued gradual improvement in trading conditions has been<br />
forecast in the trajectory over the next five years with a delivery rate <strong>of</strong><br />
455 dpa being anticipated from 2014 onwards. Thereafter it is<br />
intended to manage delivery at approximately that level through the<br />
continued provision <strong>of</strong> a five year land supply. The trajectory forecasts<br />
a phased delivery rate (set out in Policy CP2) which reflects a slow<br />
economic recovery and continued gradual improvement in trading<br />
conditions during the early part <strong>of</strong> the plan period in the light <strong>of</strong><br />
evidence in the Arup Study (2011) 13 . (PC6.45) Policy CP3 provides the<br />
mechanism for ensuring a housing land supply in line with the<br />
prevailing Supply Period (which is currently 5 years land supply but is<br />
anticipated to change to 6 years supply during the plan period).<br />
(PC6.45) (PC5.34)<br />
Figure 9<br />
Housing Trajectory<br />
Amended Figure 9<br />
600<br />
<strong>Core</strong> <strong>Strategy</strong> Housing Trajectory<br />
Target Annual Completions<br />
2011 - 2027<br />
500<br />
Completions<br />
400<br />
300<br />
200<br />
100<br />
0<br />
09-<br />
10<br />
10-<br />
11<br />
11-<br />
12<br />
12-<br />
13<br />
13-<br />
14<br />
14-<br />
15<br />
15-<br />
16<br />
16-<br />
17<br />
17-<br />
18<br />
18-<br />
19<br />
19-<br />
20<br />
20-<br />
21<br />
21-<br />
22<br />
22-<br />
23<br />
23-<br />
24<br />
24-<br />
25<br />
25-<br />
26<br />
26-<br />
27<br />
Actual Completions Target Completions (2016-2027)<br />
Expected Affordable Housing Completions Expected Windfalls Completions<br />
Expected Completions<br />
Affordable Housing Target<br />
<strong>Core</strong> <strong>Strategy</strong> Target<br />
[Original paras 5.44 to 5.52 deleted by PC5.36]<br />
13 ARUP Scale <strong>of</strong> Housing Growth in <strong>Selby</strong> (<strong>November</strong> 2011) (PC5.34)<br />
- 56 -